Forensic Tools for in-depth Performance Investigations
nic jansma | SOASTA | nicj.net | @nicj
Who Are We?

Nic Jansma
SOASTA

Philip Tellis
SOASTA
What We Do
SOASTA mPulse is a Real User Monitoring (RUM) tool for measuring page load performance
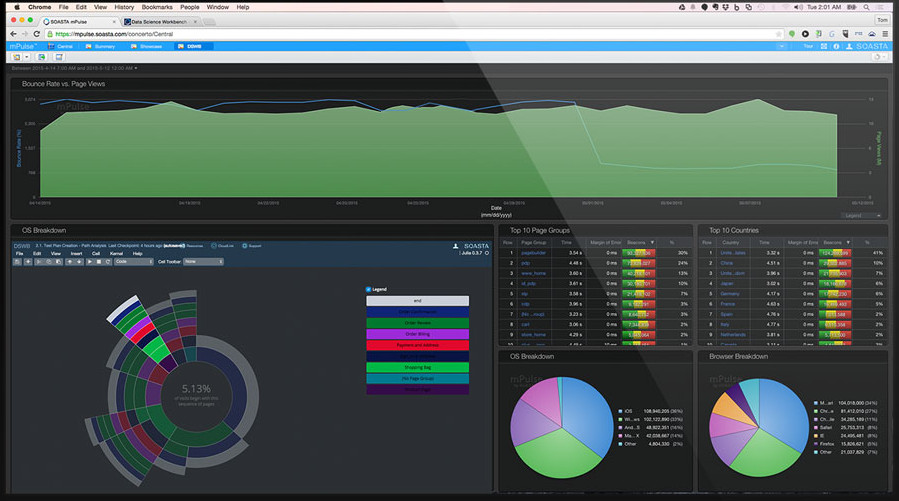
What We Do
- We have a JavaScript library (Boomerang) that captures performance metrics, page load characteristics, XHRs, SPA navigations, and more
- We are a third-party script provider
- We serve
boomerang.jsfrom a CDN to our customers using a script loader snippet they include in their HTML - We can update our customer's
boomerang.jsversion (if they ask) - Our script runs in their page so we have to be super-duper careful
Boomerang
- Created by Philip Tellis @ Yahoo
- Gathers performance metrics and characteristics of the page load and beacons that data to your server (aka RUM)
- Open-source project (with contributions from SOASTA)
- https://github.com/lognormal/boomerang/
Non-Blocking Script Loader Pattern
- lognormal.com/blog/2012/12/12/the-script-loader-pattern
- Better than
<script>nodes orasync - Uses an anonymous
IFRAME
(function(url){
  // Section 1
  var dom,doc,where,iframe = document.createElement('iframe');
  iframe.src = "javascript:void(0)";
  iframe.title = ""; iframe.role="presentation";  // a11y
  (iframe.frameElement || iframe).style.cssText = "width: 0; height: 0; border: 0";
  where = document.getElementsByTagName('script');
  where = where[where.length - 1];
  where.parentNode.insertBefore(iframe, where);

  // Section 2
  try {
    doc = iframe.contentWindow.document;
  } catch(e) {
    dom = document.domain;
    iframe.src="javascript:var d=document.open();d.domain='"+dom+"';void(0);";
    doc = iframe.contentWindow.document;
  }
  doc.open()._l = function() {
    var js = this.createElement("script");
    if(dom) this.domain = dom;
    js.id = "js-iframe-async";
    js.src = url;
    this.body.appendChild(js);
  };
  doc.write('<body onload="document._l();">');
  doc.close();
})('http://some.site.com/script.js');
Customer Concerns
What happens when our customers think our third-party script is causing an issue on their site?
Scenario #1
Aren't you supposed to be non-blocking?
Customer:
"Hi guys, So, I was running some WPT tests today and saw this… I thought that this was supposed to be non-blocking. If anyone sees this, they'll hang me up by my heels."
Screenshot #2 from our customer:
Step #1
Reproduce the Issue
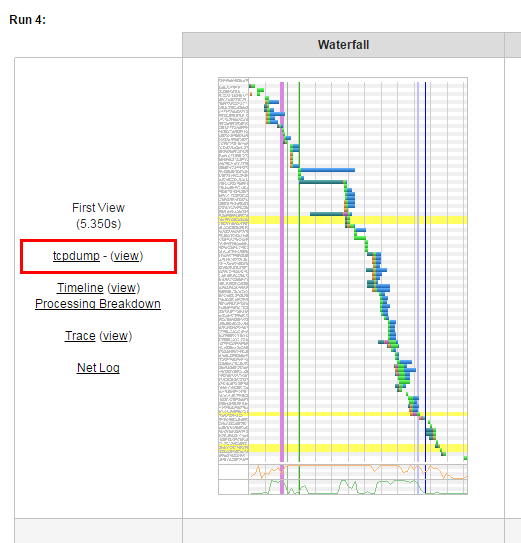
Tool #1
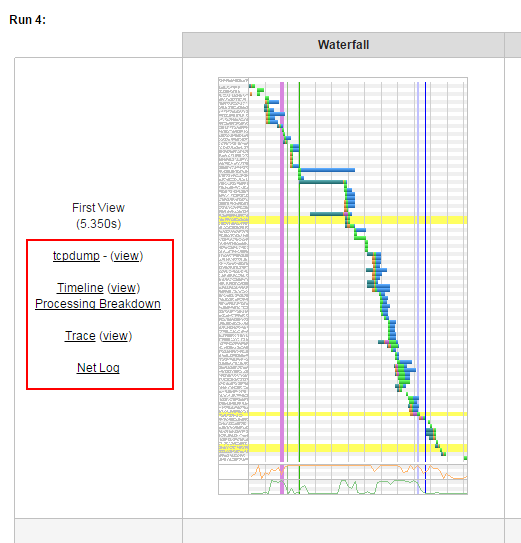
WebPageTest
- For reproducing real-world page load scenarios
- For testing Single Points of Failure (SPOF)
- Can give you: waterfalls, TCP dumps, network and processing breakdowns, traces, net logs, screenshots, videos, Page Speed score, comparisons and more
Step #1
Reproduce the Issue
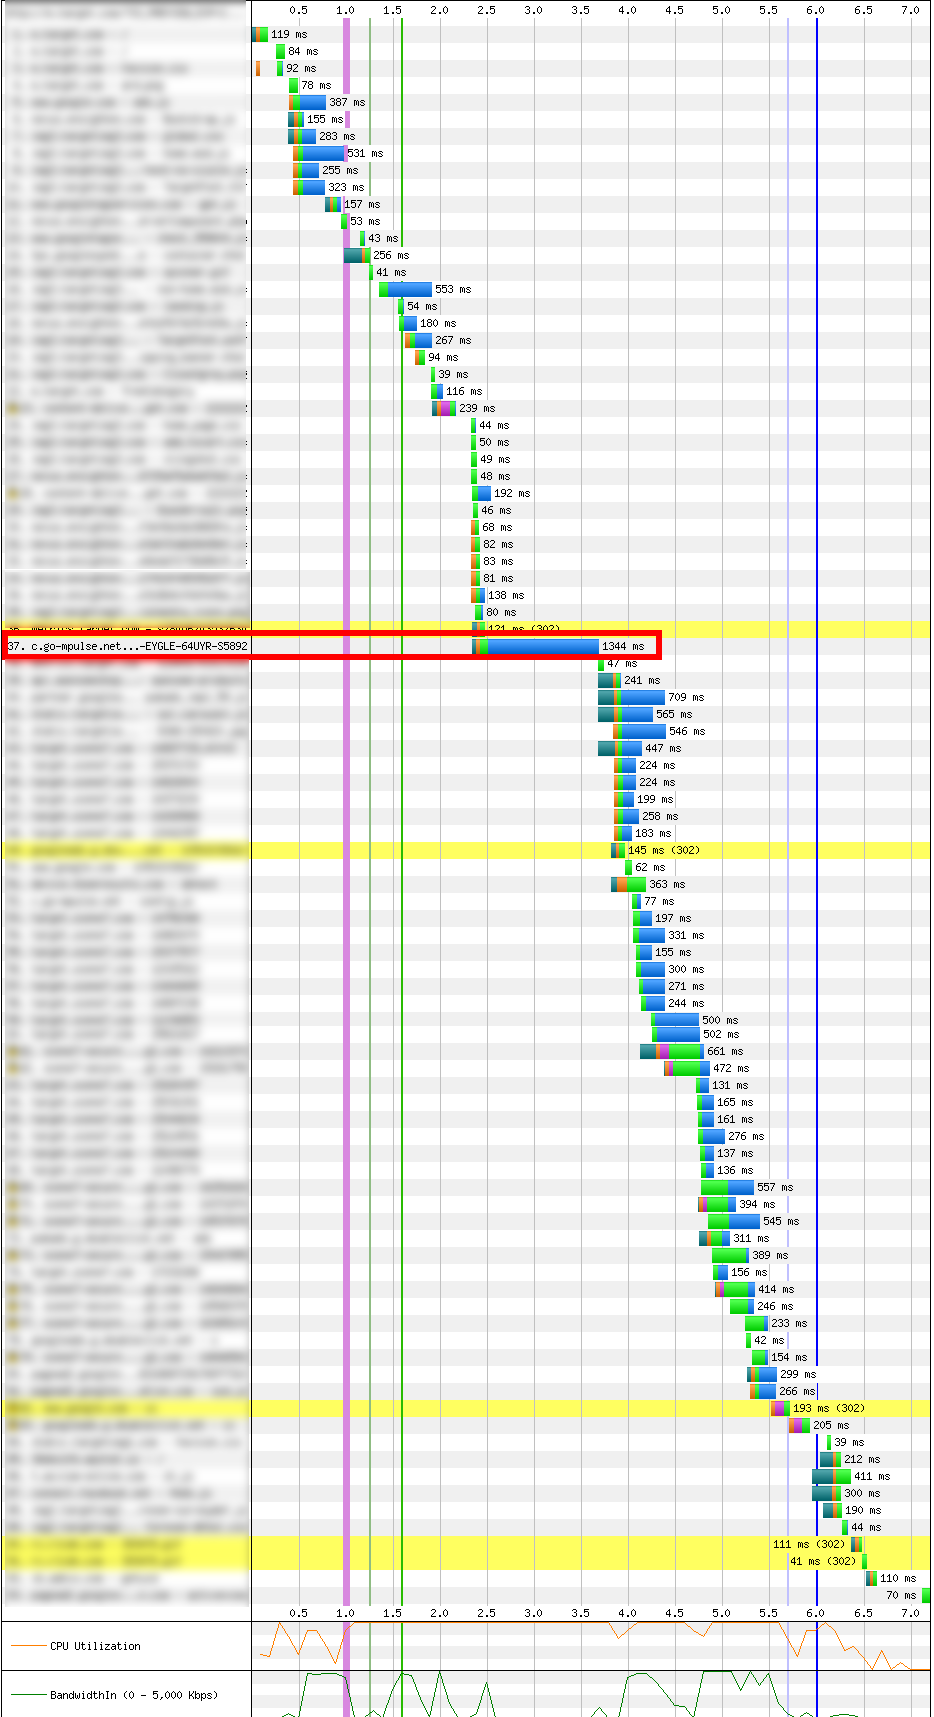
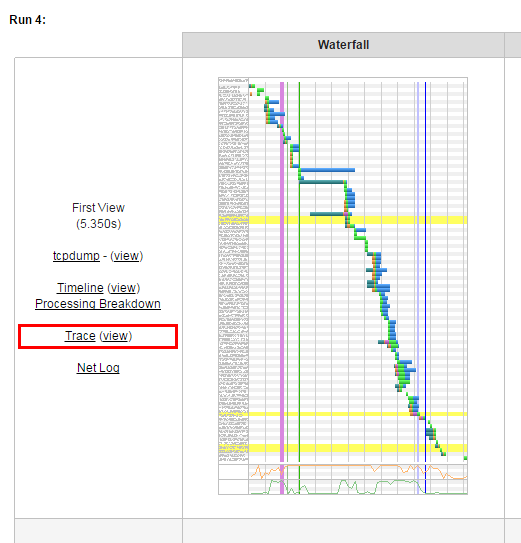
The customer shared their WebPageTest results URL, and we looked closer at the test pass
Out of the 9 runs, 2 showed what appeared to be boomerang.js blocking other downloads
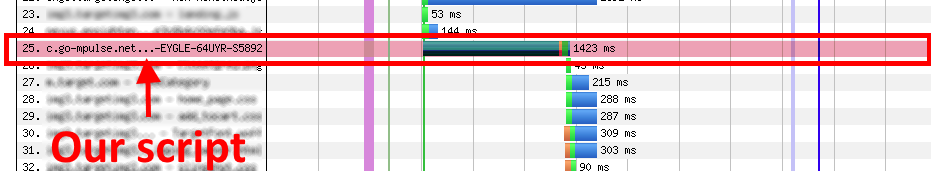
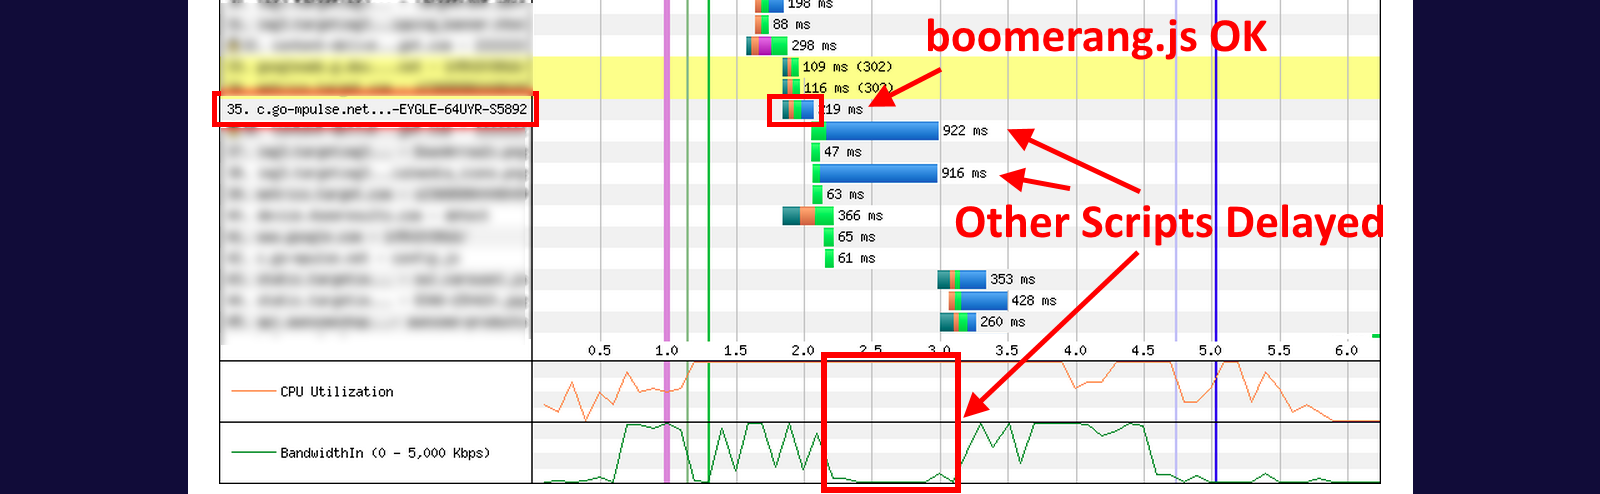
Repro #1:
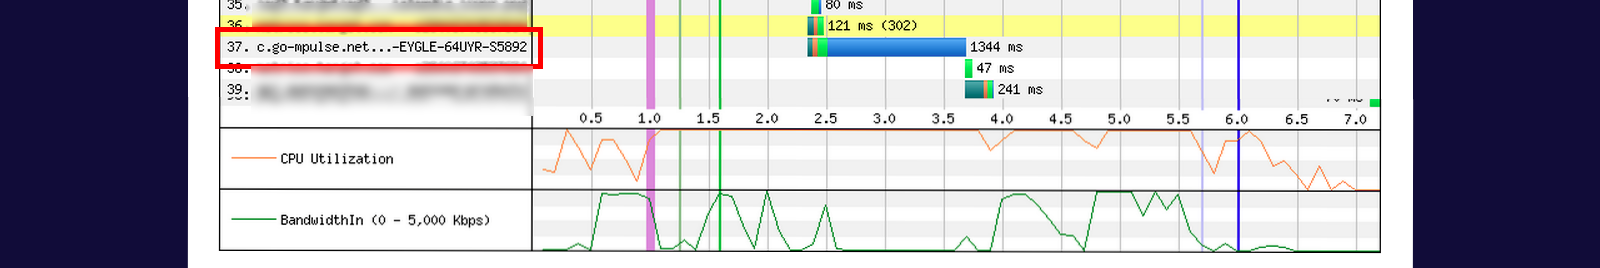
Repro #1 Larger view
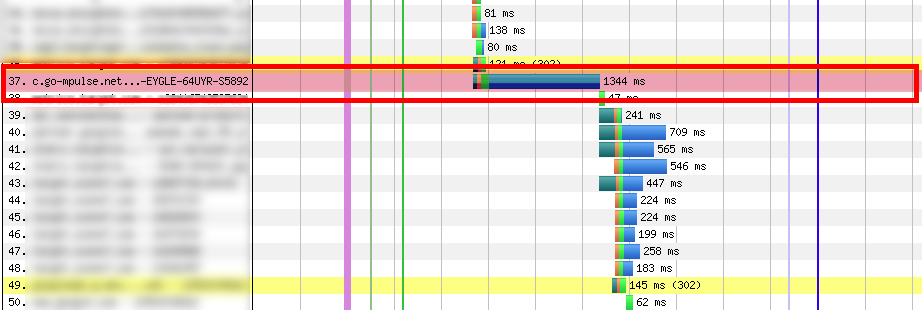
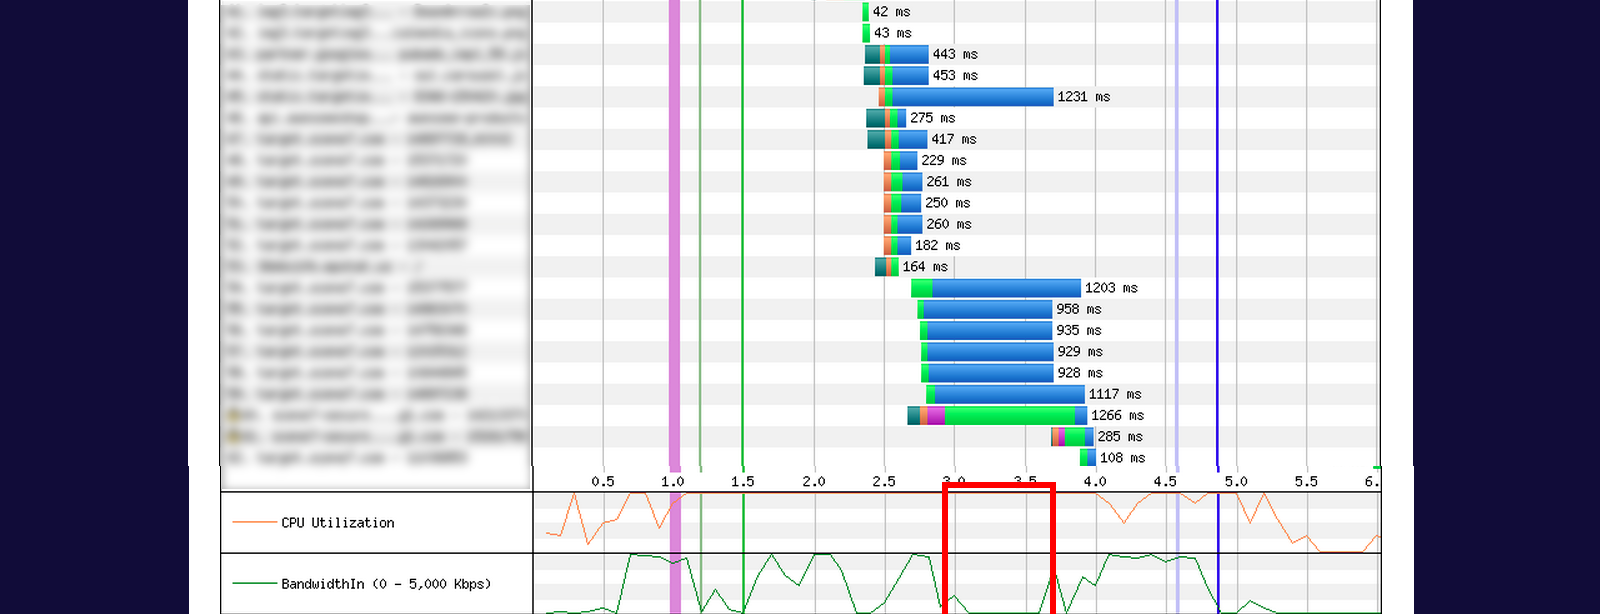
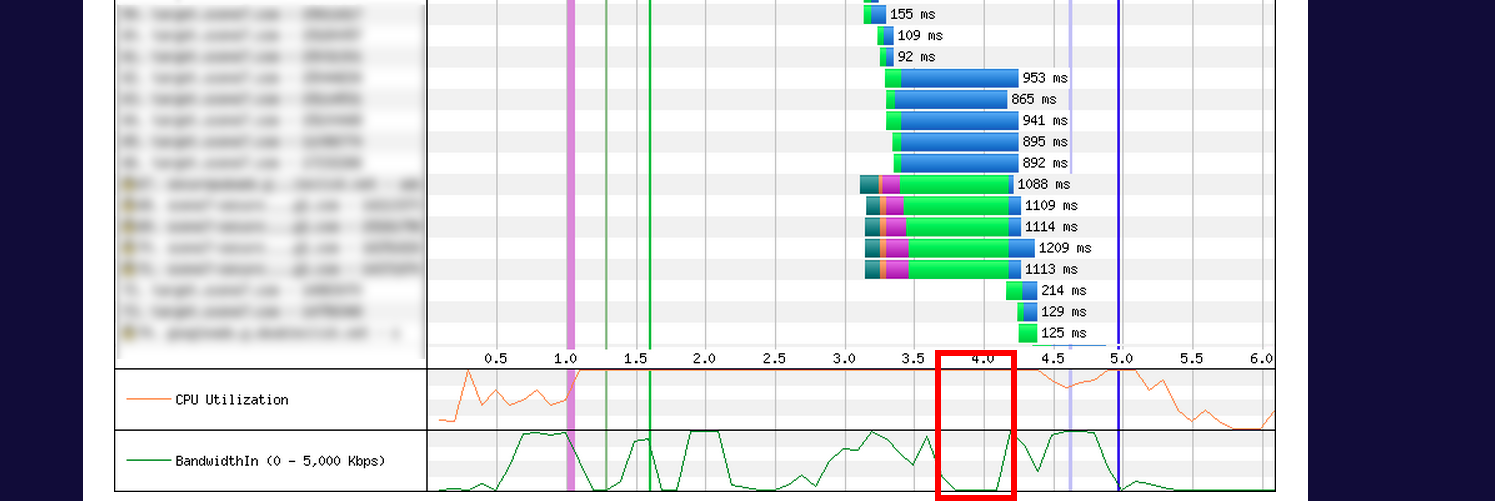
Repro #2:
Step #2
Dive Deeper
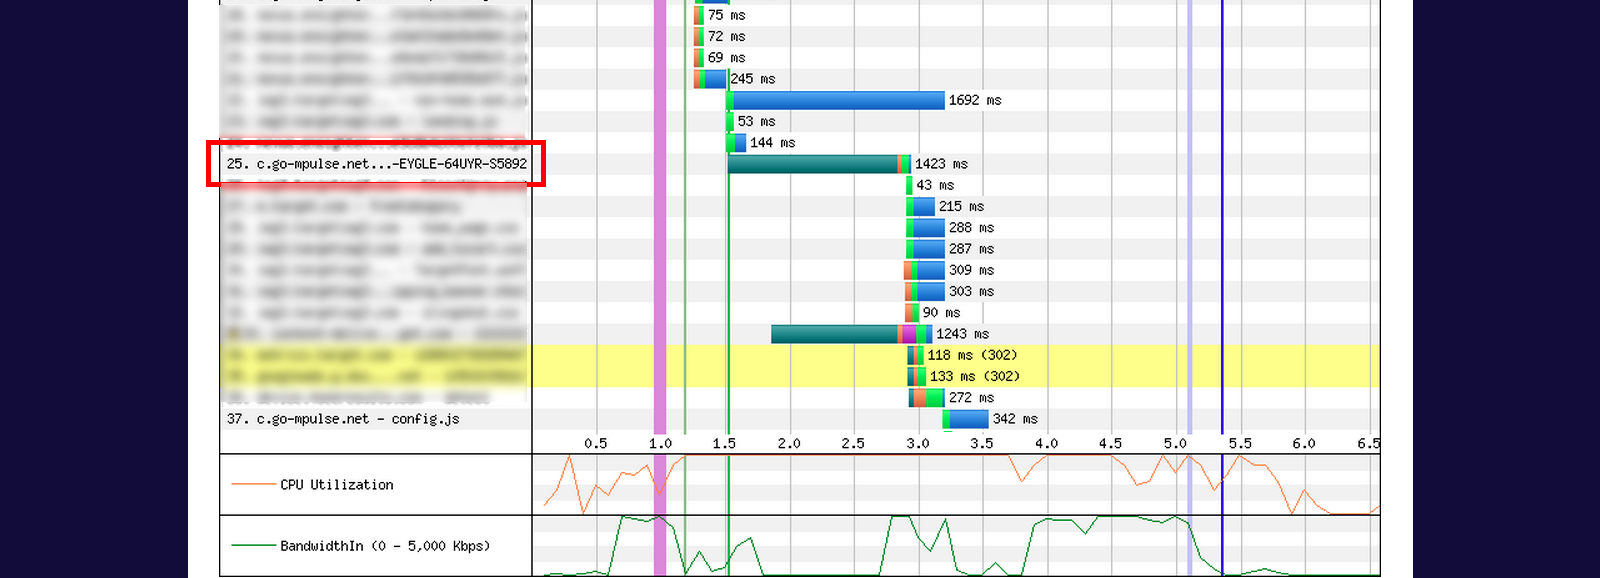
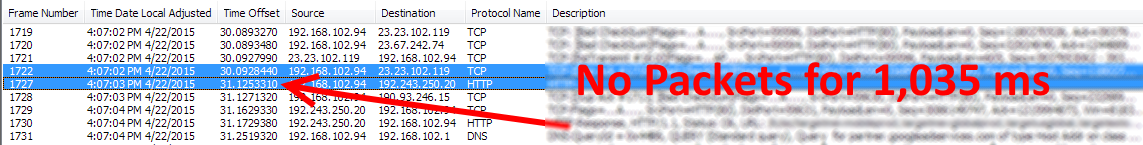
We looked at the 9 test runs, and found 3 more that had some sort of period where nothing happens
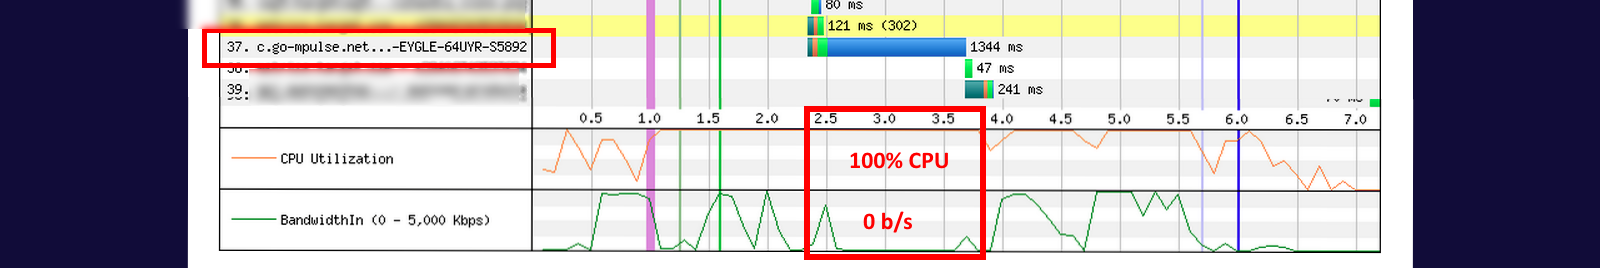
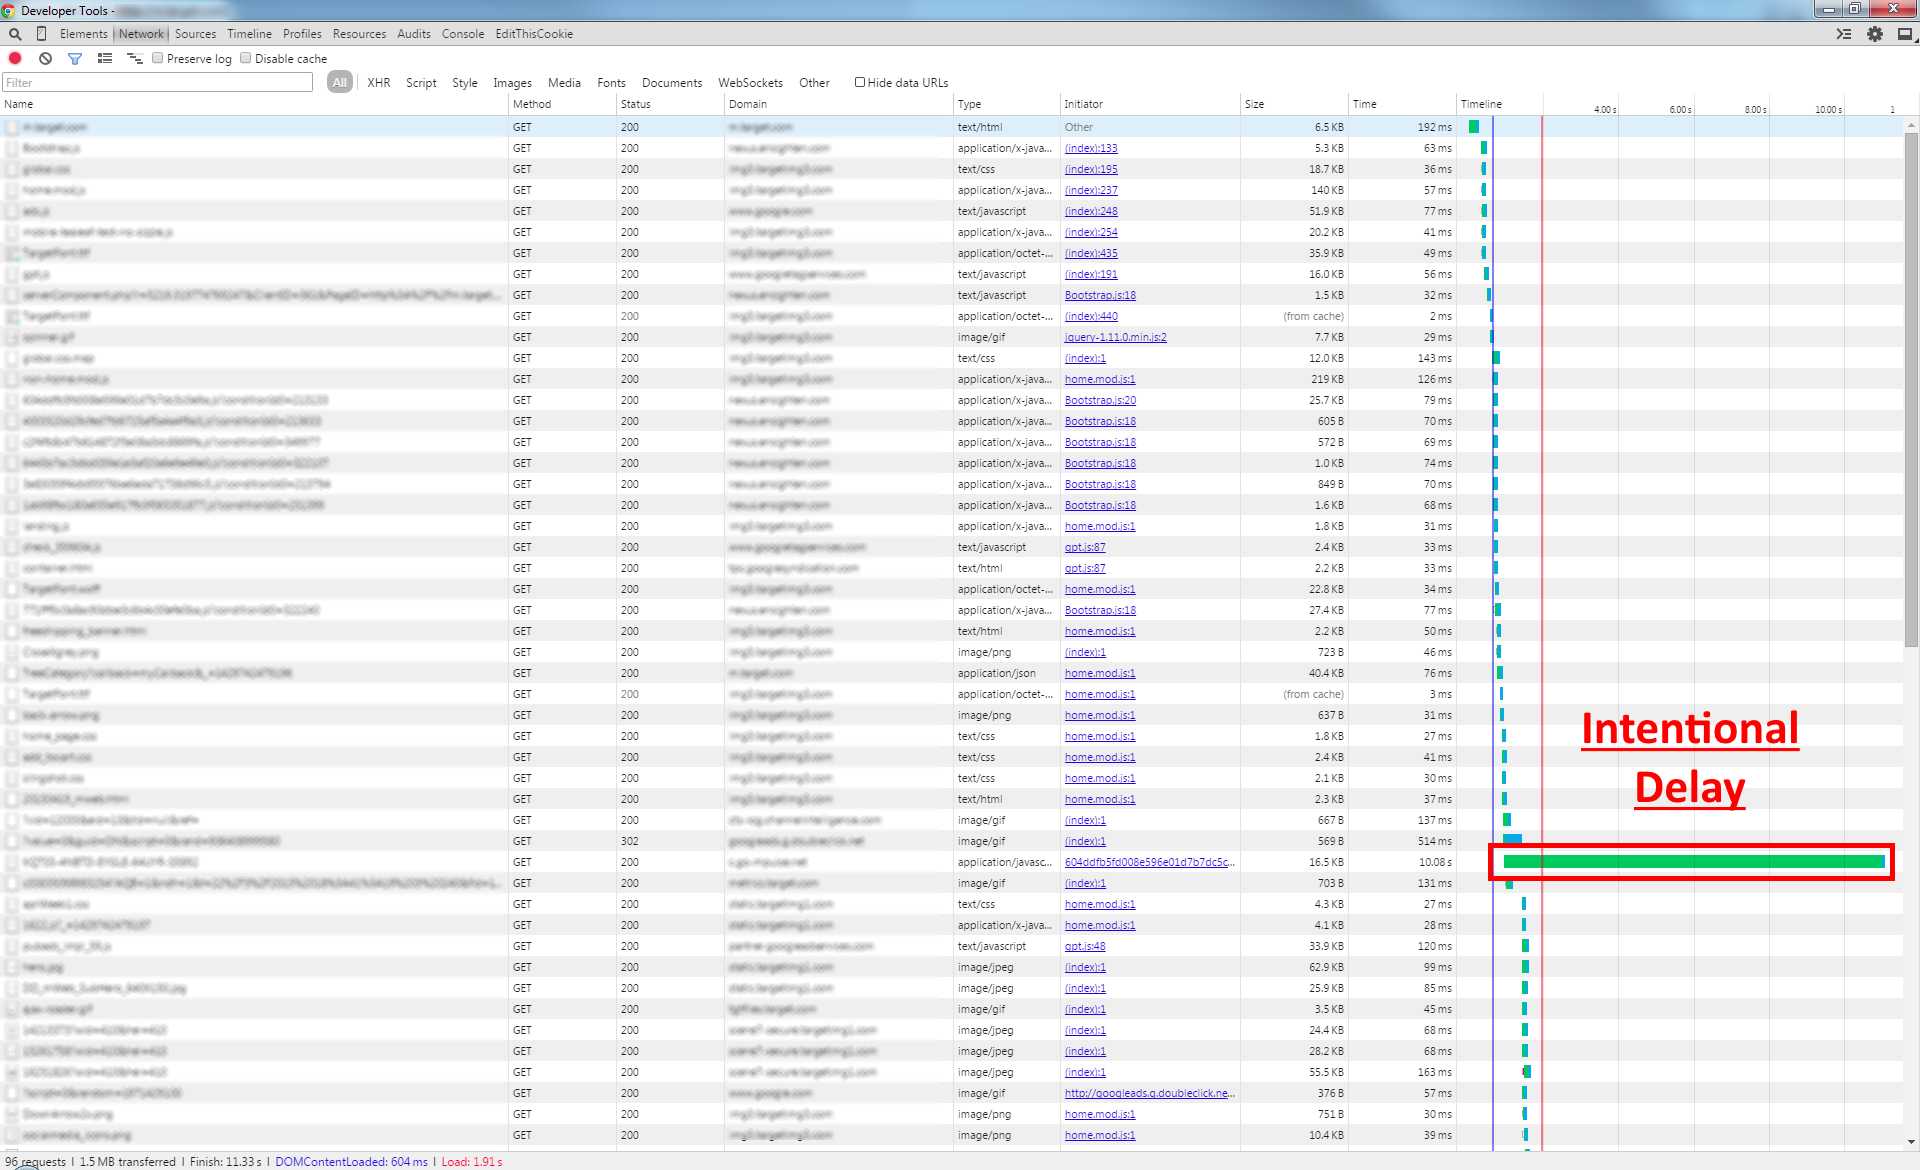
The tests show periods of time where the CPU is 100%, and bandwidth (bytes transferred) drops to 0 for 1-4 seconds.
Repro #1 and #2 show 100% CPU and no bandwidth for over a second:

Non-repros: boomerang.js loaded quickly, but two images appeared to "hang"
Non-repros: boomerang.js loaded much earlier, but other content appears to "hang"
Non-repros: Other content "hanging"
WebPageTest has many options for diving deeper
WebPageTest
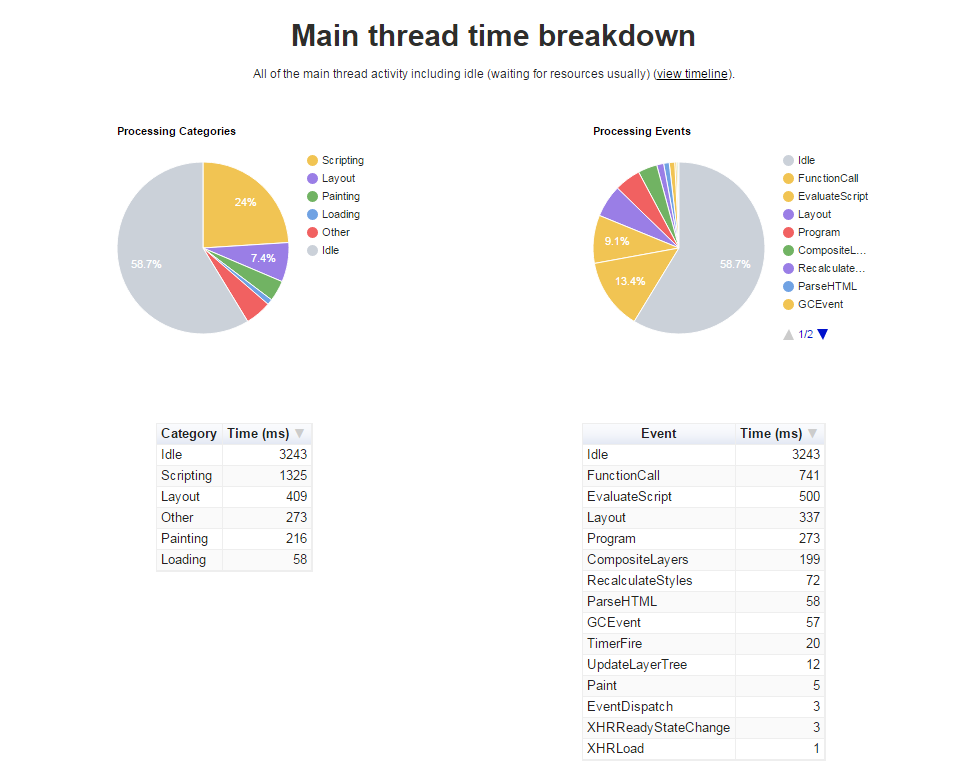
Processing Breakdown
Gives a breakdown of main thread processing and timeline
Processing Breakdown
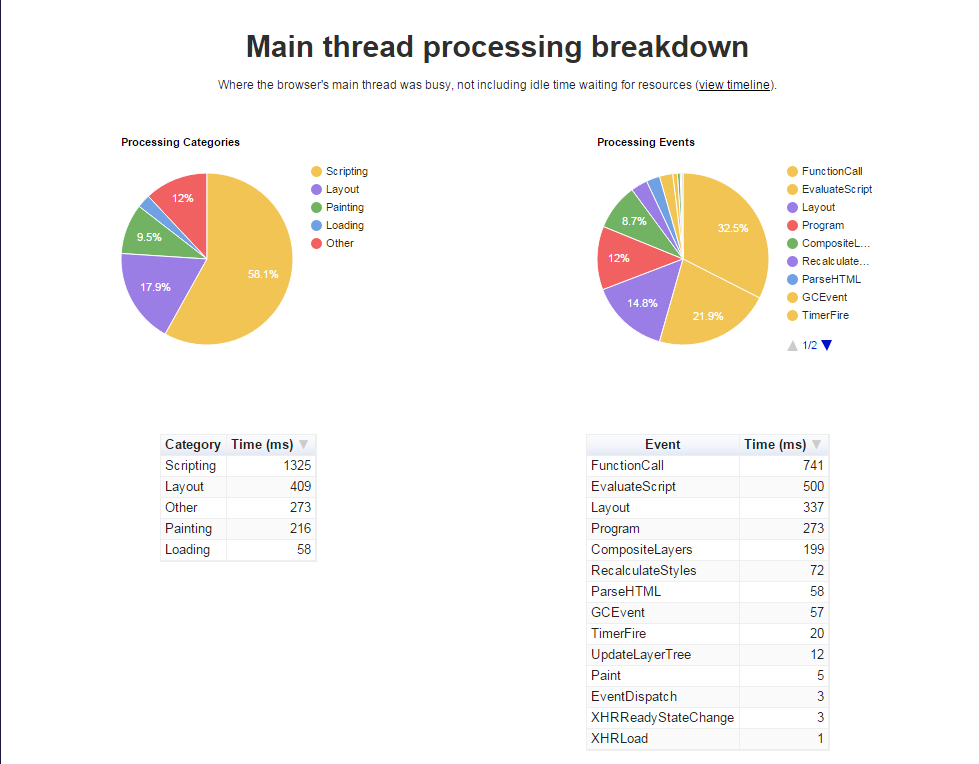
Processing Breakdown
Tool #2
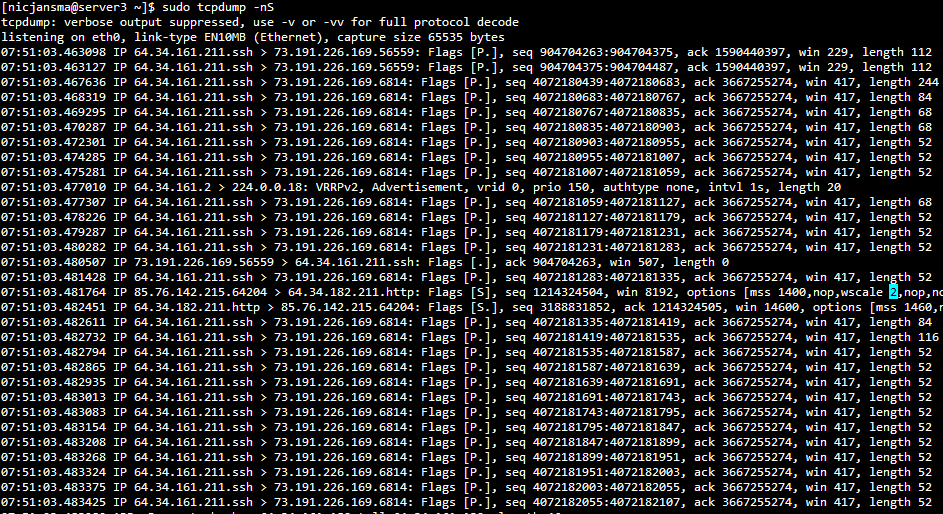
tcpdump
- Packet capturing, viewing and analysis
libpcapis a portable library for capturing
tcpdump
tcpdump.org/manpages/tcpdump.1.html
tcpdump -nS
Tool #3
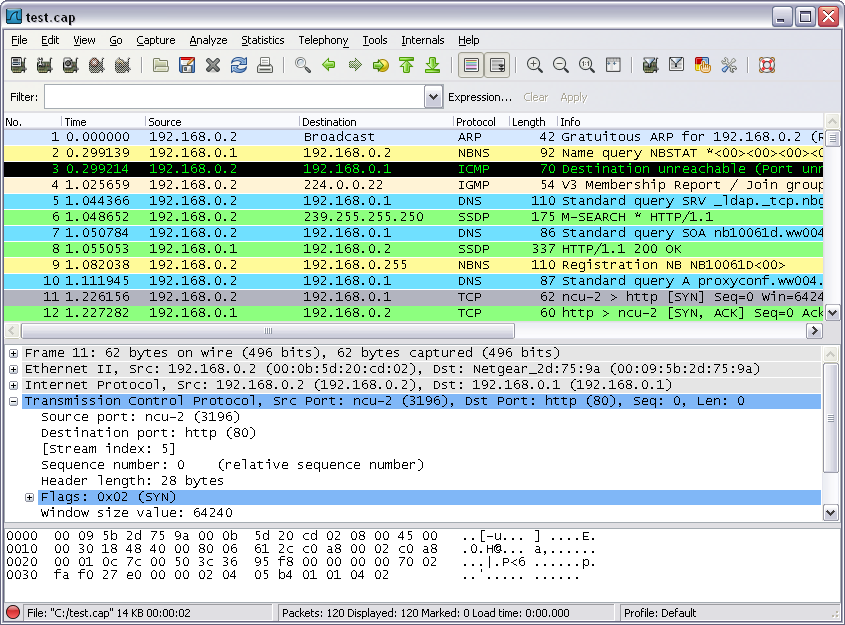
Wireshark
Higher-level analysis of tcpdump
Wireshark
Tool #4
CloudShark
Analyze PCAP (tcpdump) files in your browser
CloudShark
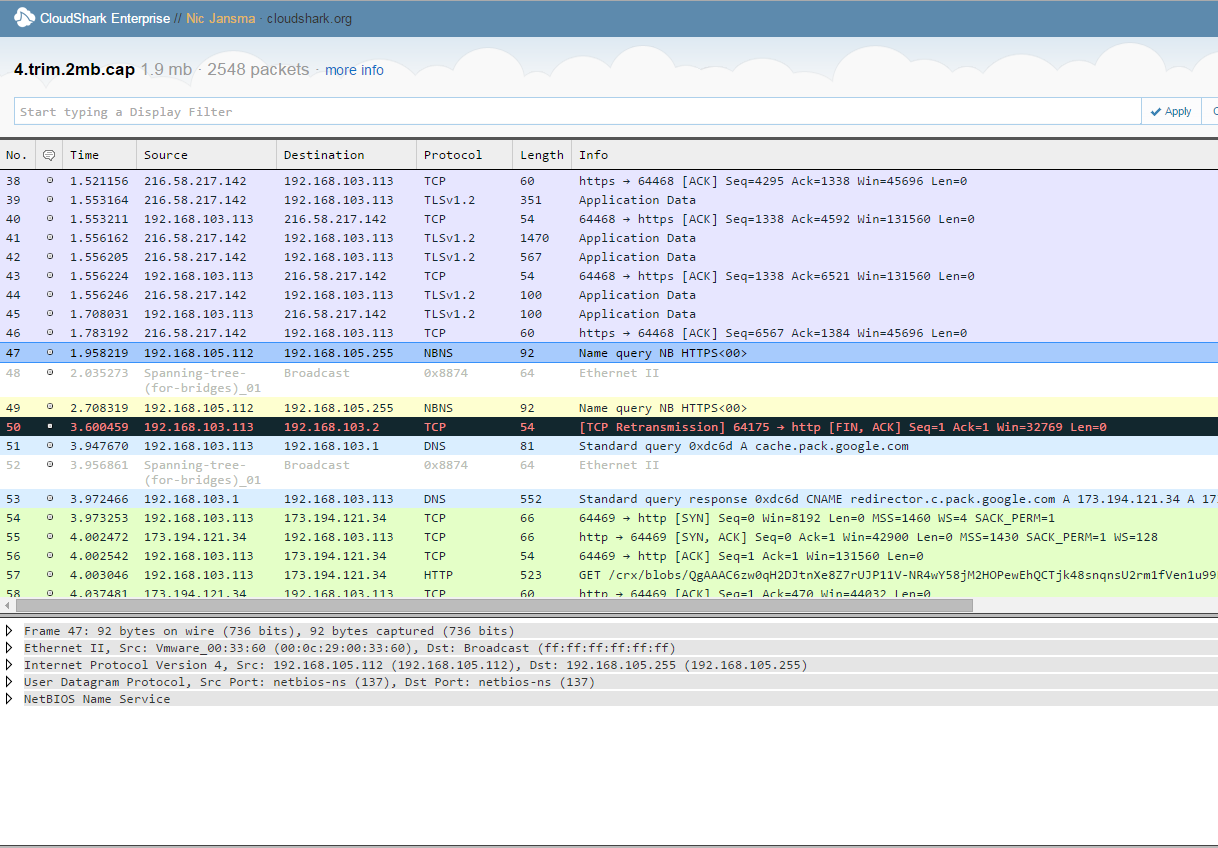
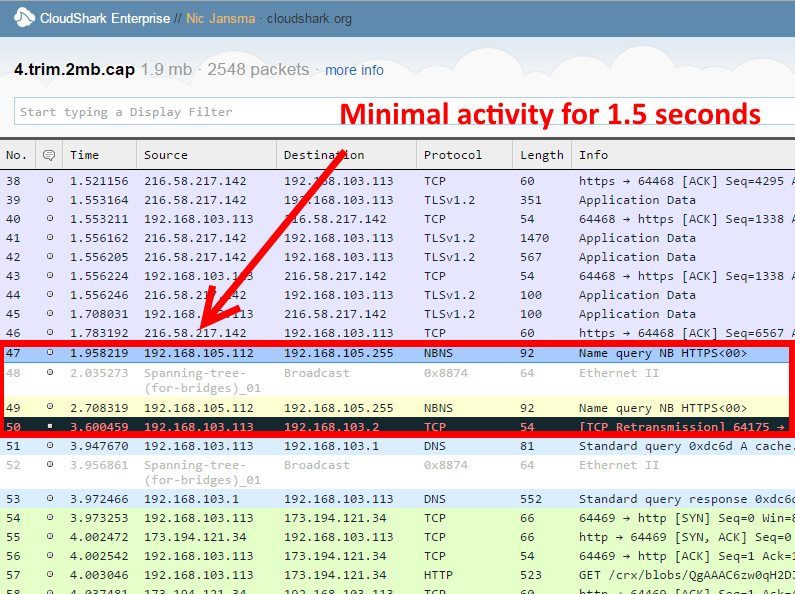
At this point, we downloaded the WebPageTest tcpdump files to dive deeper into the data
In all of the runs that showed a period of "no progress", we found zero network activity
(Repro #1)
We expect the OS network stack to continue TCP communications even if the browser was "blocked" on a script
CloudShark
(Repro #2)
Tool #5
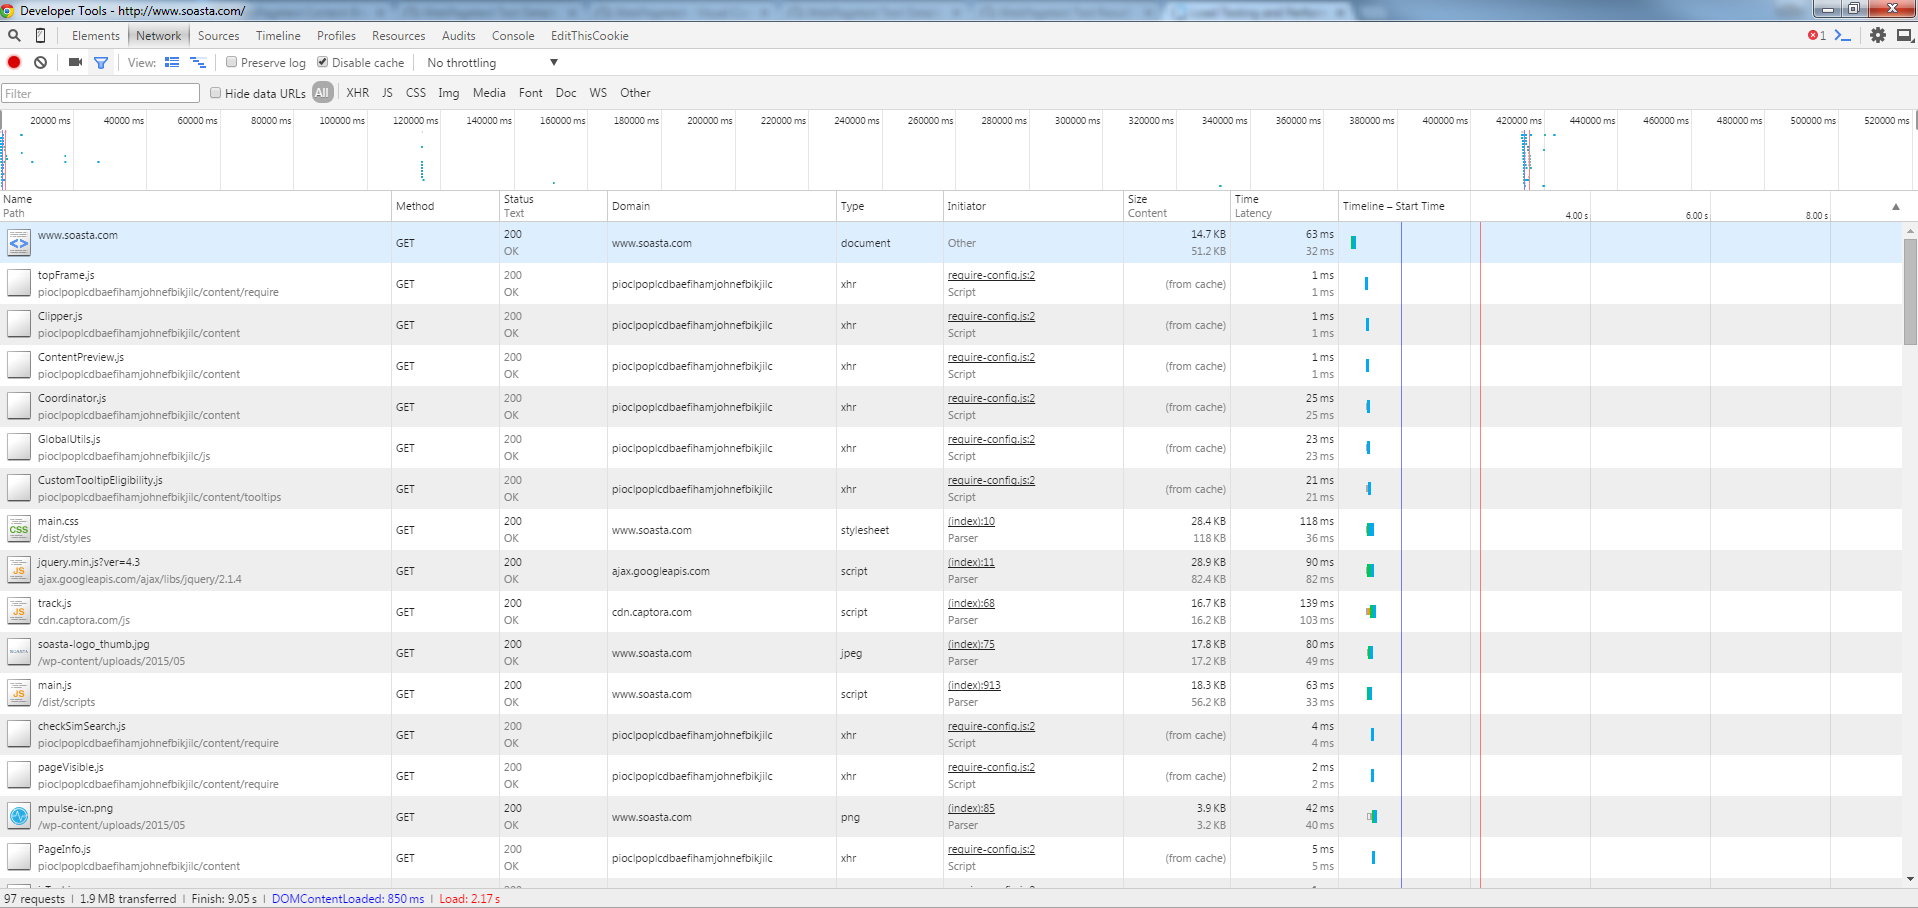
Browser Dev Tools
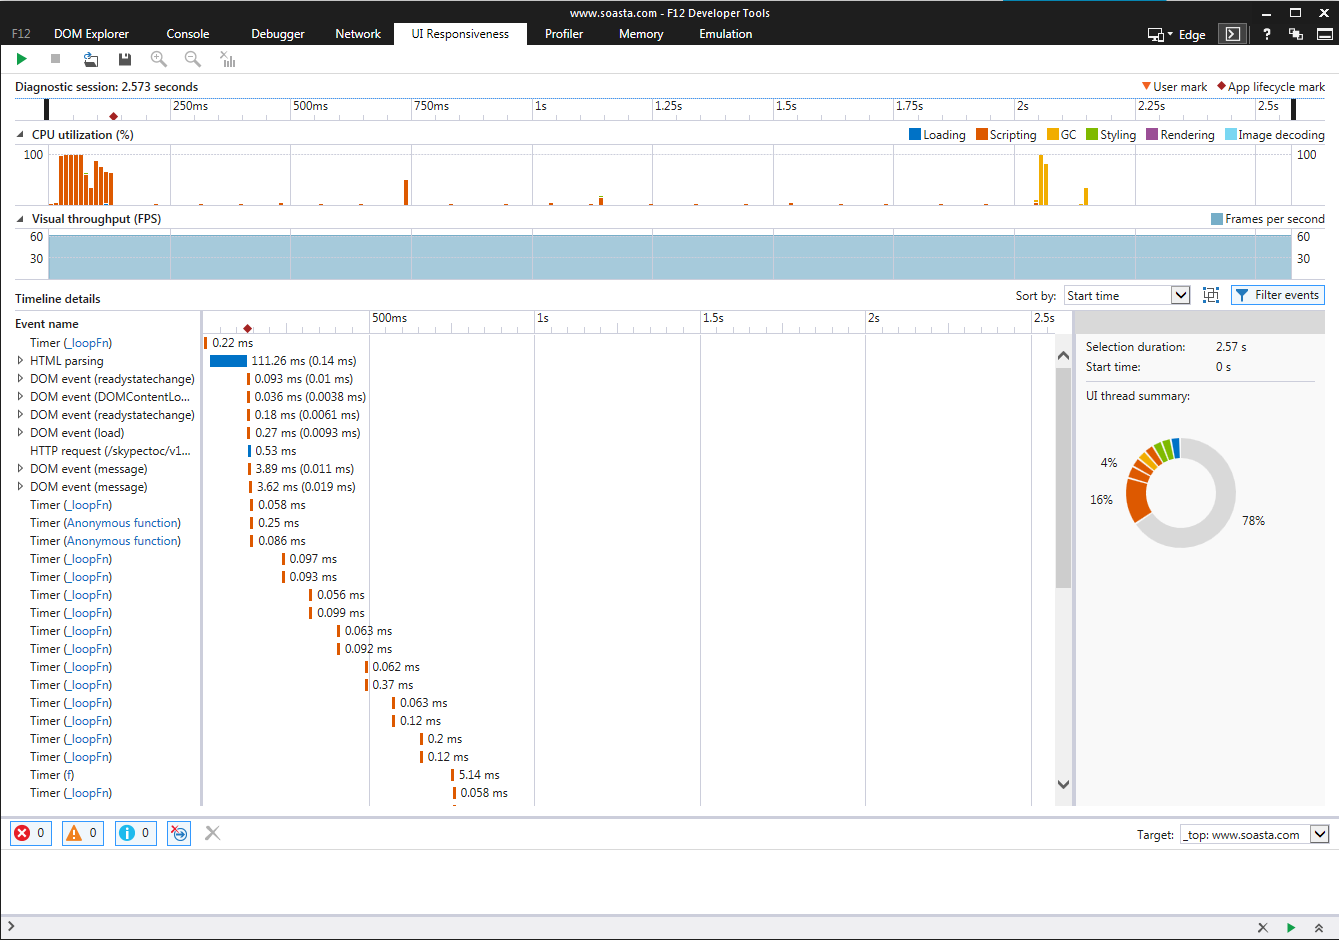
Tool #5
Browser Dev Tools
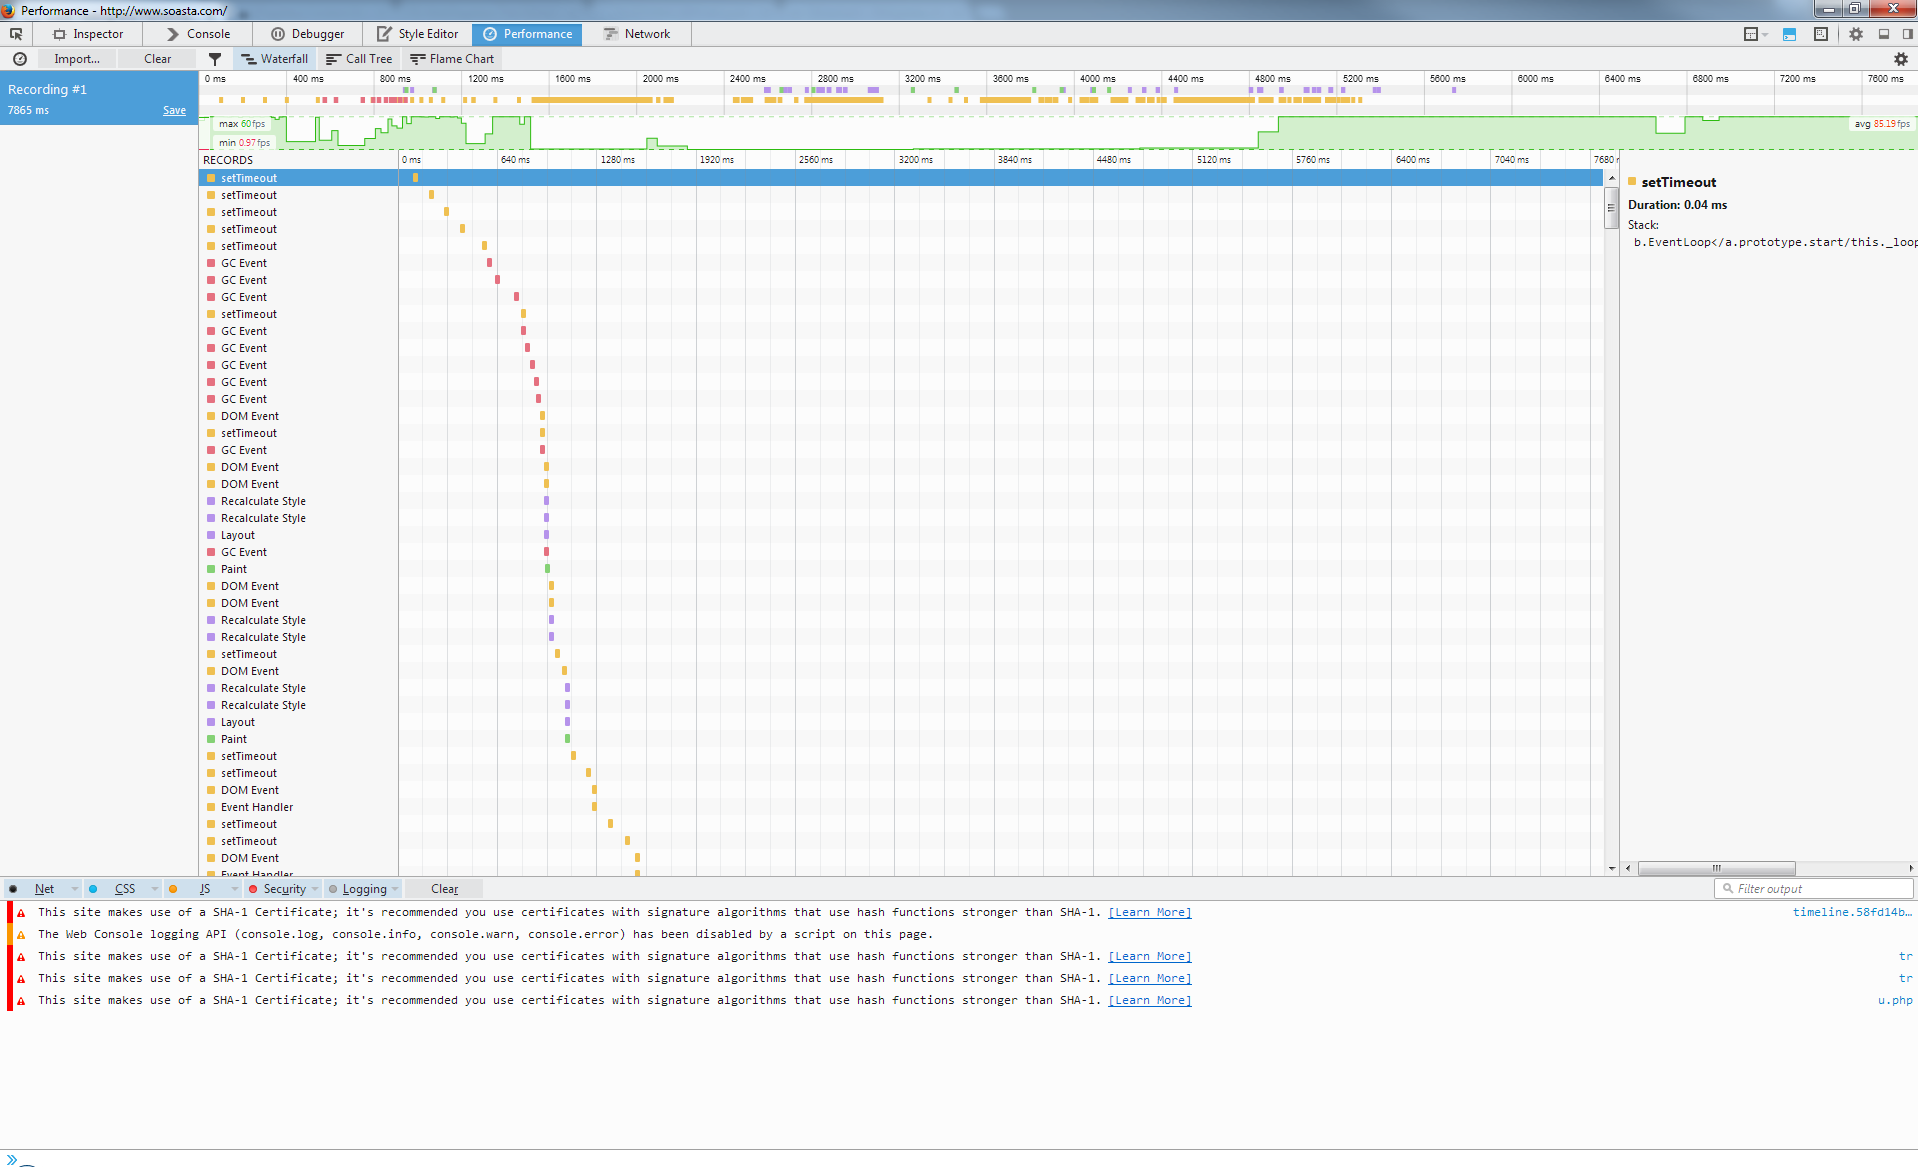
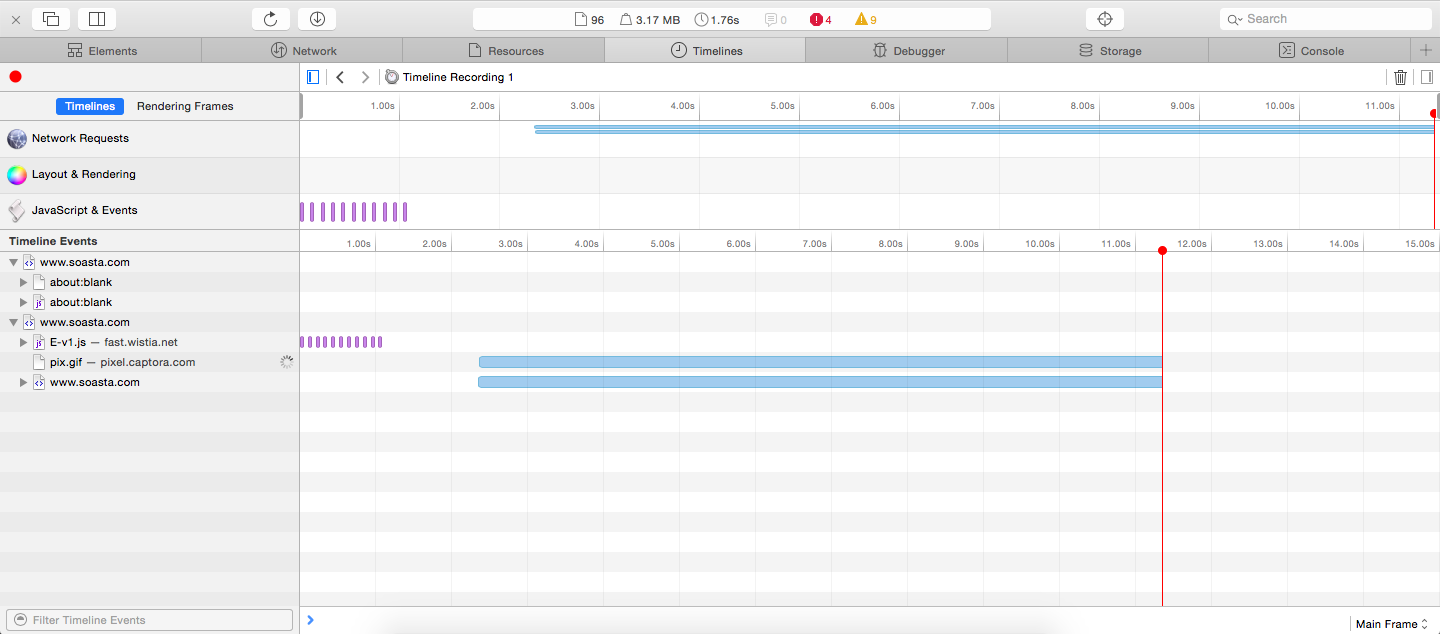
The usefulness of Browser Dev Tools could be a talk on its own, but we'll give some highlights during our investigations
Tool #6
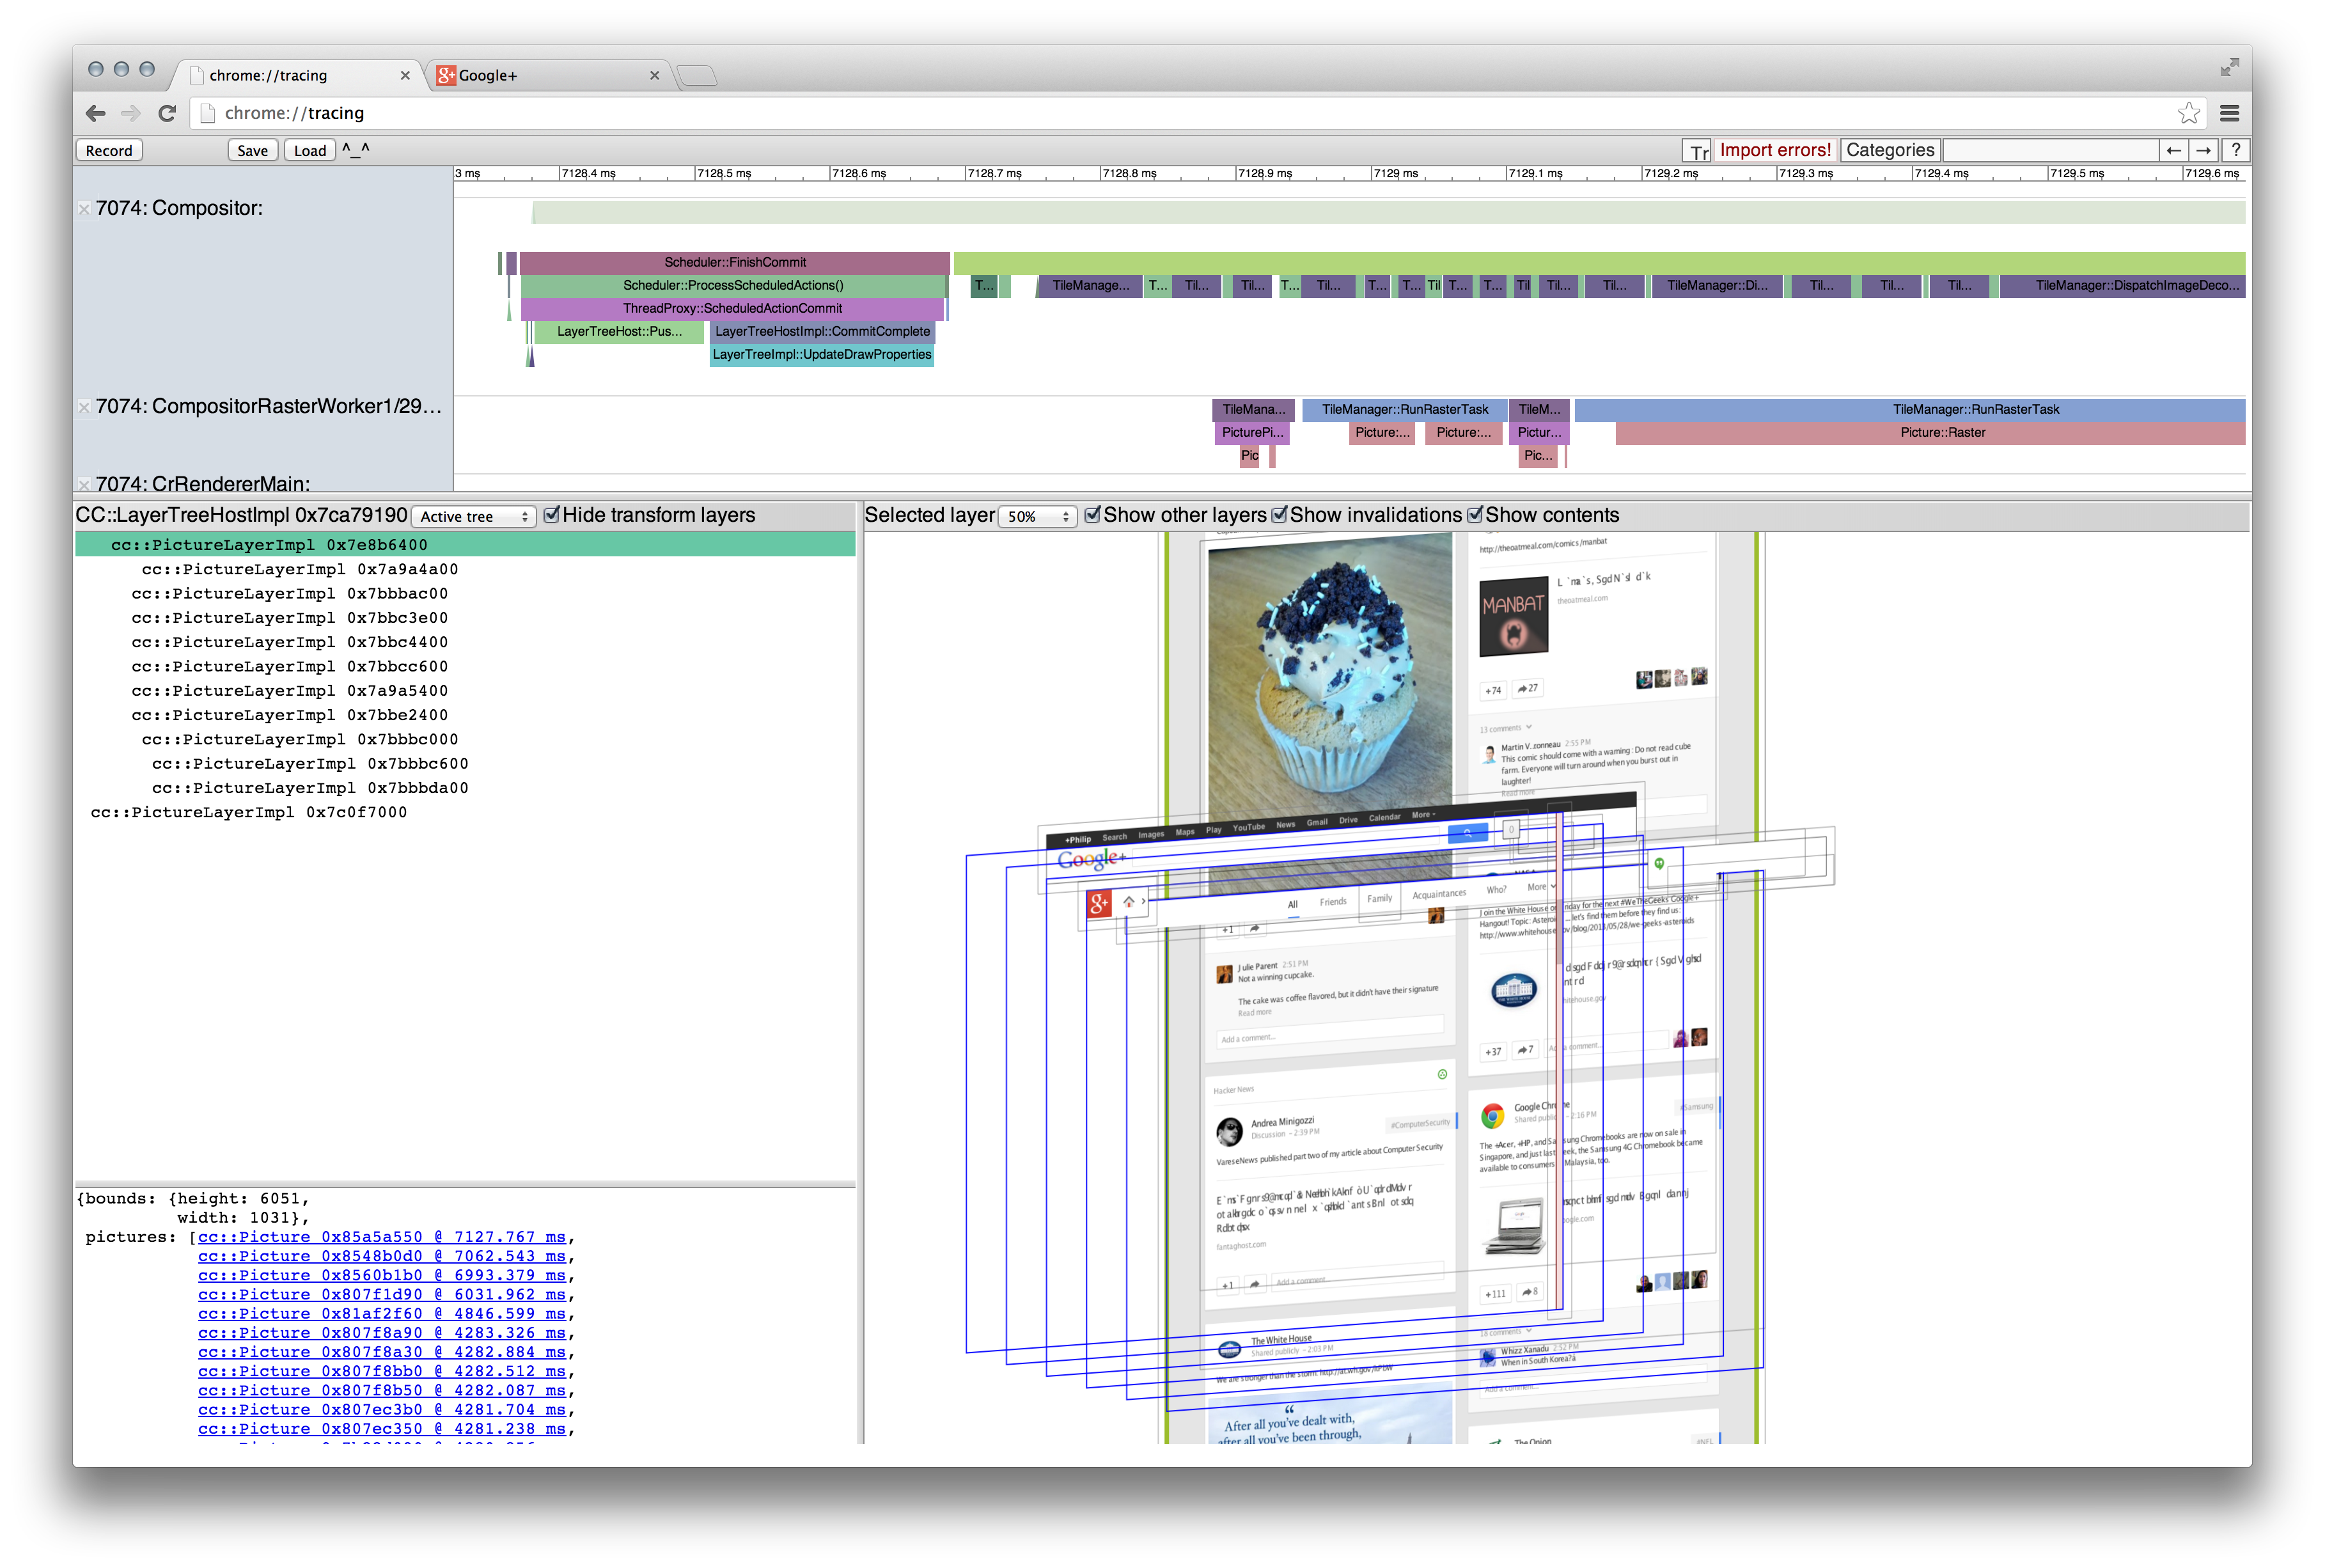
Chrome Tracing
chrome://tracing
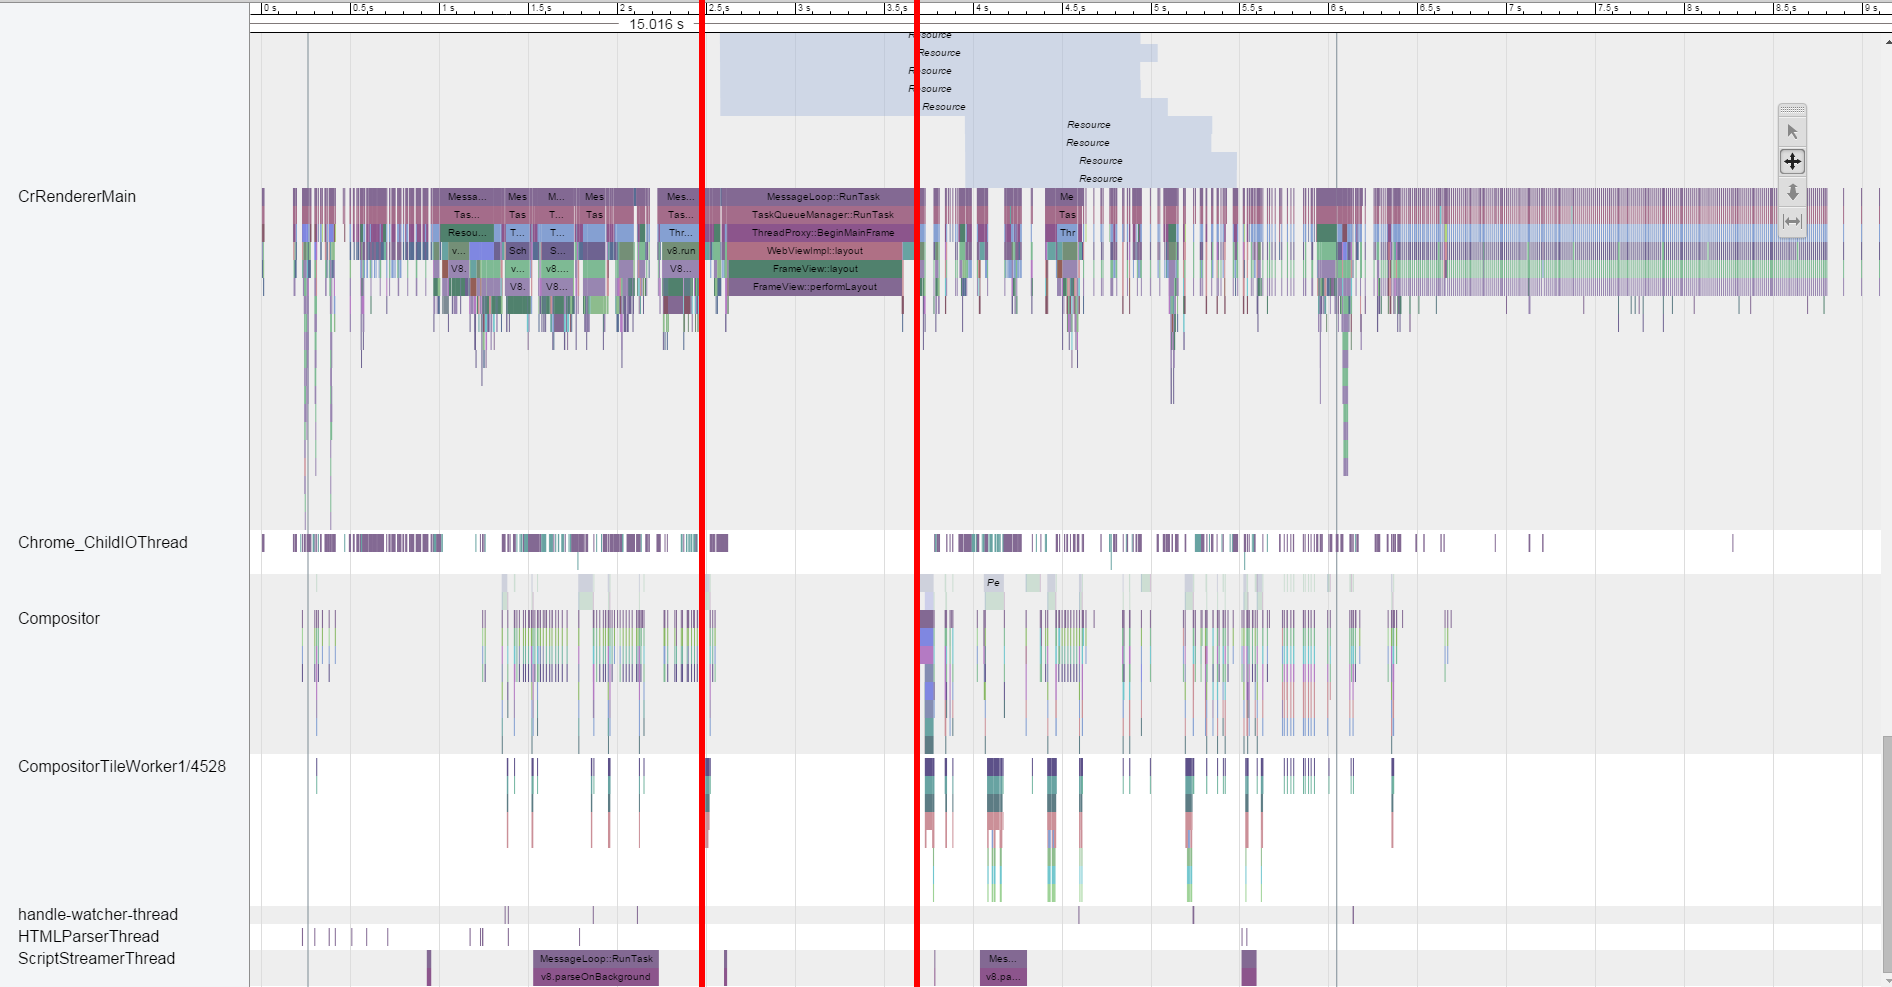
WebPageTest provides Chrome Traces
Chrome Trace
Repro #2:
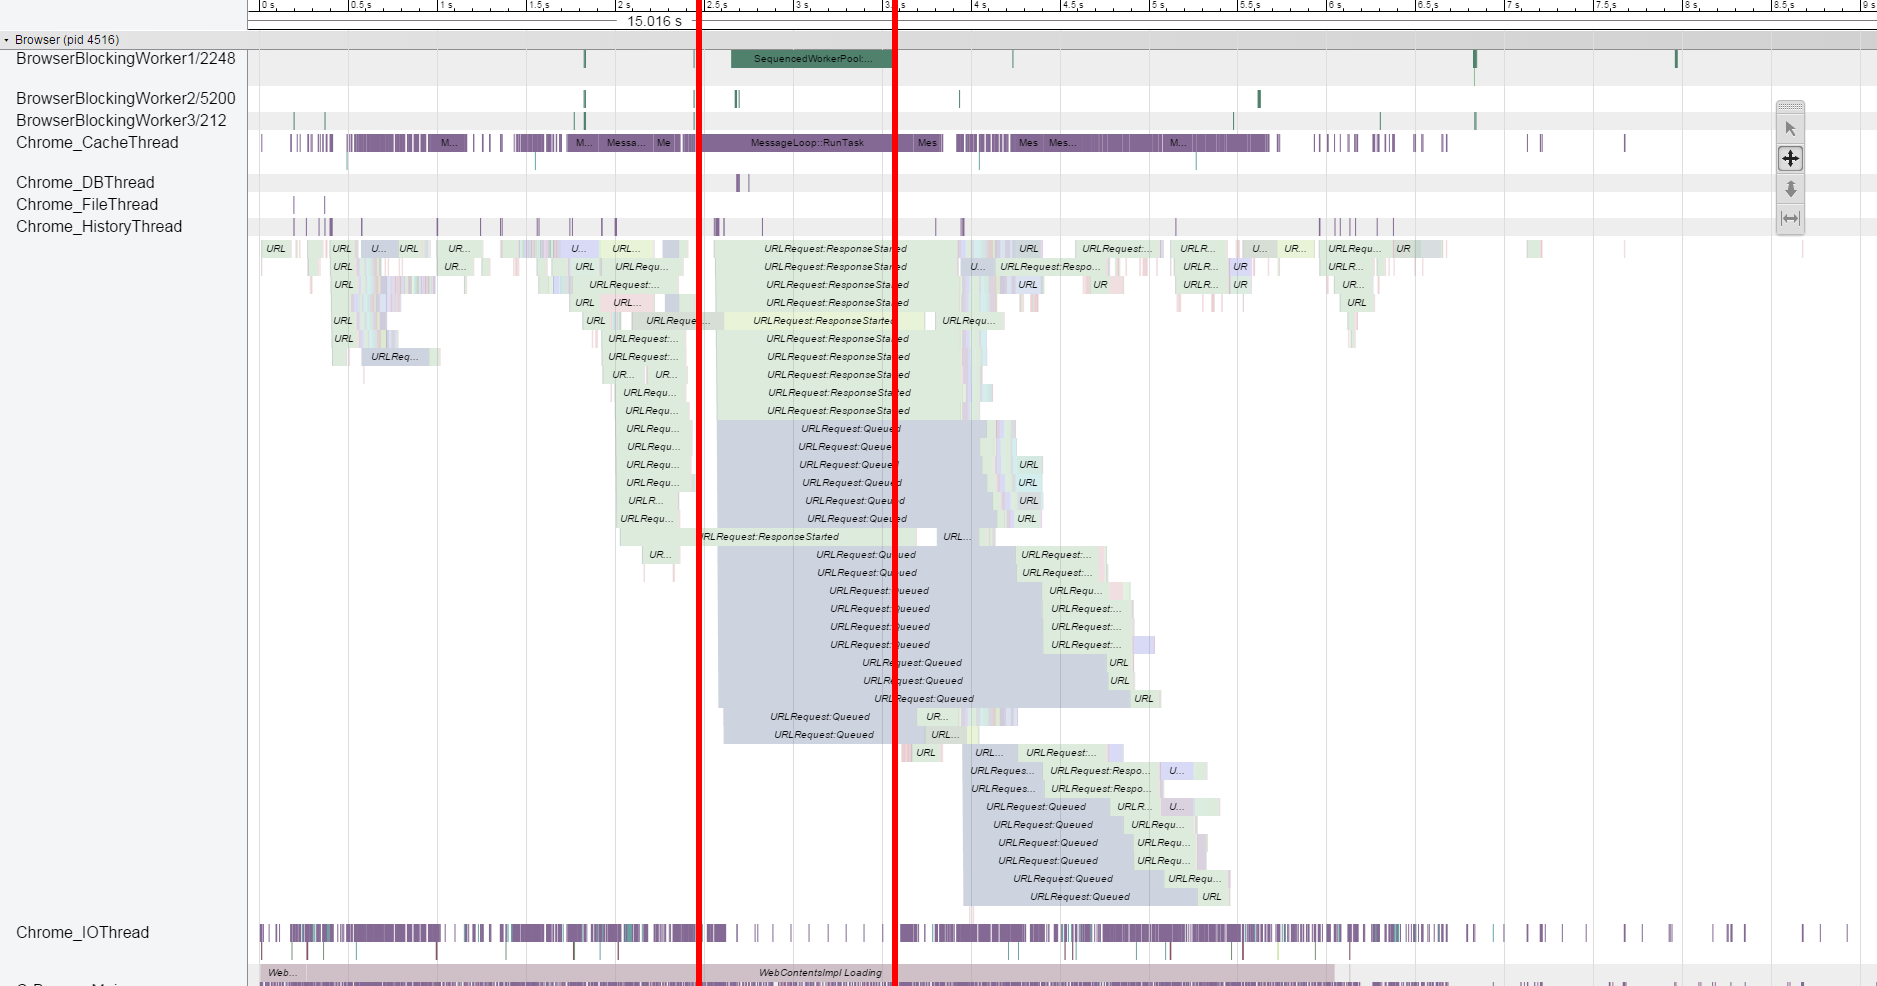
Chrome Trace
Repro #2:
Netlog
NetLog: Chrome’s network logging system
https://www.chromium.org/developers/design-documents/network-stack/netlogRepro #2: Netlog
{"params":{"load_flags":2163712,"method":"GET","priority":"LOWEST",
    "url":"http://c.go-mpulse.net/boomerang/KQTS5-4NBTD-EYGLE-64UYR-S5892"},
    "phase":1,"source":{"id":588,"type":1},"time":"5454412310","type":91},
{"phase":1,"source":{"id":588,"type":1},"time":"5454412310","type":93},
{"phase":2,"source":{"id":588,"type":1},"time":"5454412310","type":93},
{"phase":1,"source":{"id":588,"type":1},"time":"5454412310","type":101},
{"phase":2,"source":{"id":588,"type":1},"time":"5454412310","type":101},
{"phase":1,"source":{"id":588,"type":1},"time":"5454412310","type":102},
{"params":{"byte_count":1460},"phase":0,"source":{"id":275,"type":4},
    "time":"5454412311","type":62},
{"phase":2,"source":{"id":529,"type":1},"time":"5454412311","type":143},
{"phase":1,"source":{"id":529,"type":1},"time":"5454412311","type":143},
{"params":{"byte_count":443},"phase":0,"source":{"id":275,"type":4},
    "time":"5454412313","type":62},
{"phase":2,"source":{"id":529,"type":1},"time":"5454412313","type":143},
{"phase":1,"source":{"id":529,"type":1},"time":"5454412313","type":143},
{"phase":2,"source":{"id":275,"type":4},"time":"5454412313","type":37},
{"phase":2,"source":{"id":529,"type":1},"time":"5454412313","type":143},
Step #2
Dive Deeper
It will be great to (re)prove that our script loader works even if our CDN is down, or if there are delays in the network
How can we do this? There are a couple tools that can help with Single Point of Failure (SPOF) testing
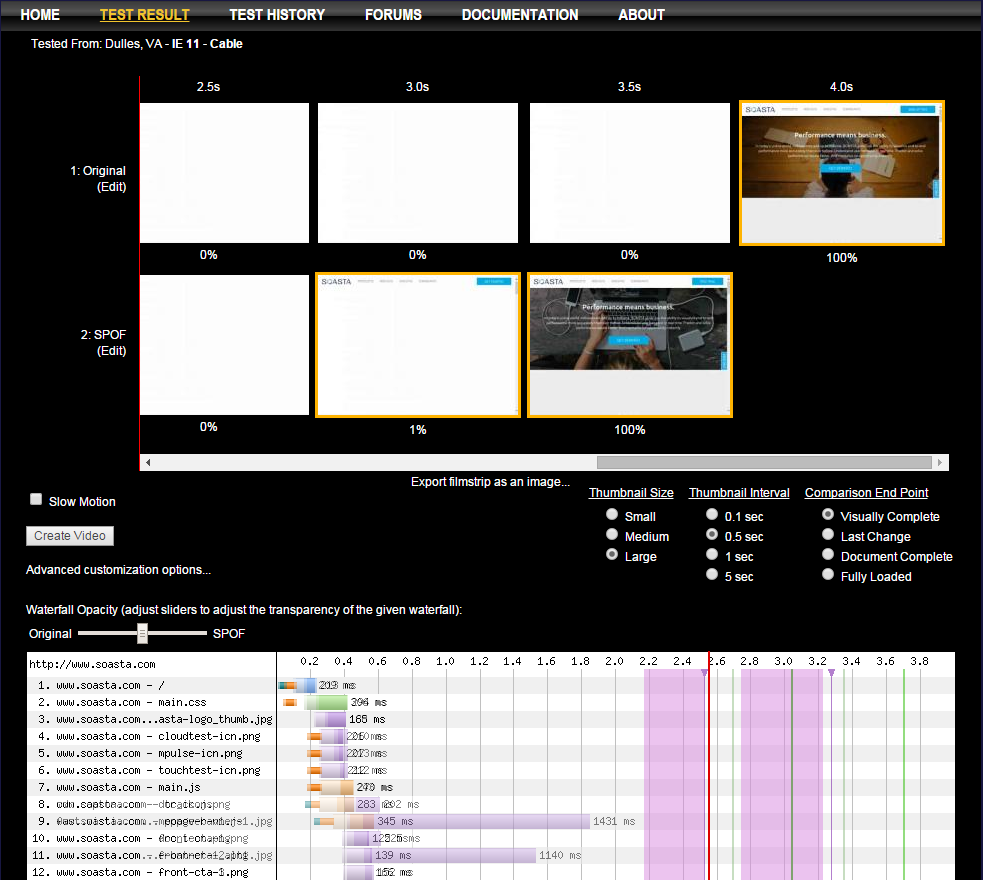
WebPageTest SPOF
blackhole.webpagetest.org drops all traffic
setDnsName c.go-mpulse.net blackhole.webpagetest.org
navigate our-customer.com
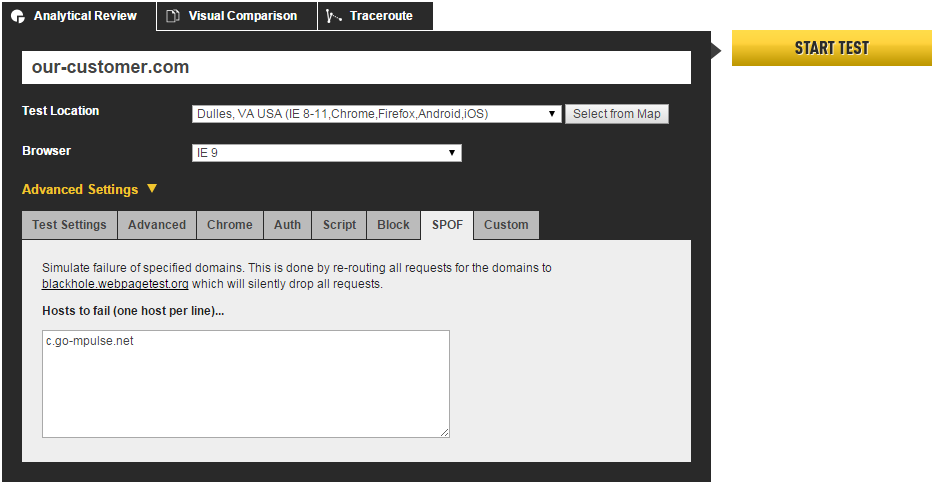
WebPageTest SPOF
No issues with blocking our CDN c.go-mpulse.net
Let's try to do SPOF on our local machine as well
Browser Dev Tools
Waterfall
Tool #7
/etc/hosts
- Great for quickly redirecting traffic to your local machine
- Or for sending traffic to a blackhole
On Windows: C:\windows\system32\drivers\etc\hosts
/etc/hosts
blackhole.webpagetest.org == 72.66.115.13
72.66.115.13 apis.google.com
72.66.115.13 www.google-analytics.com
72.66.115.13 c.go-mpulse.net
Tool #8
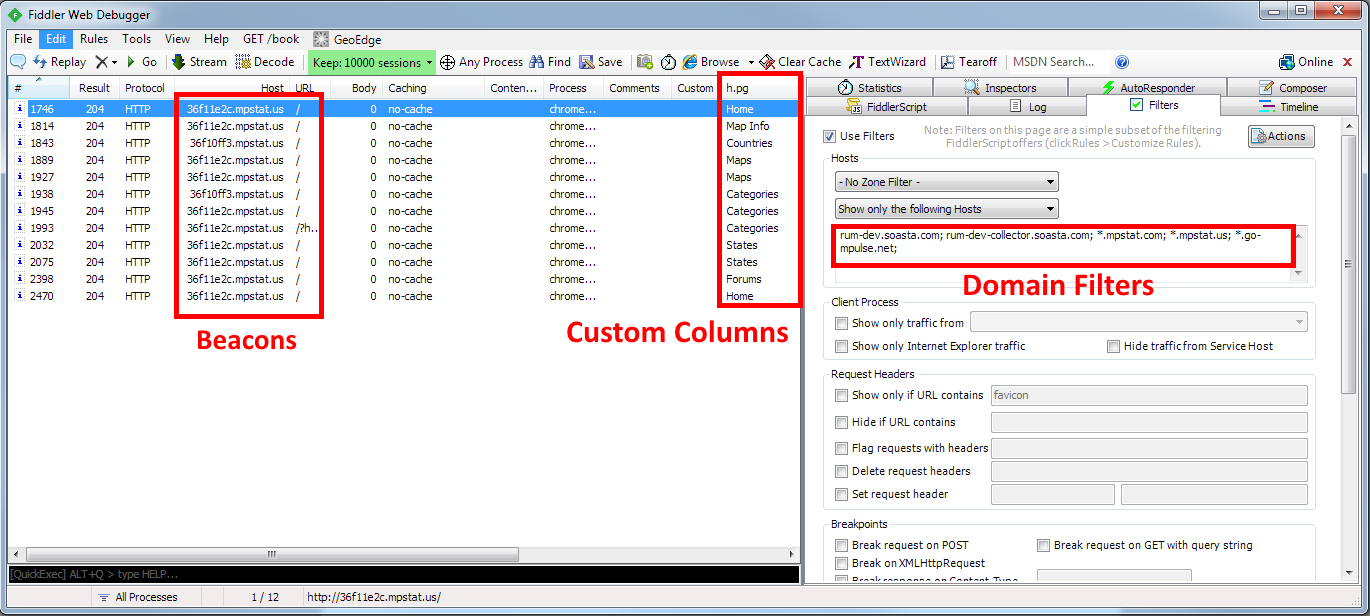
Fiddler
- For monitoring all traffic from desktop or mobile devices
- For injecting different content into live sites
- For artifically delaying traffic
Fiddler
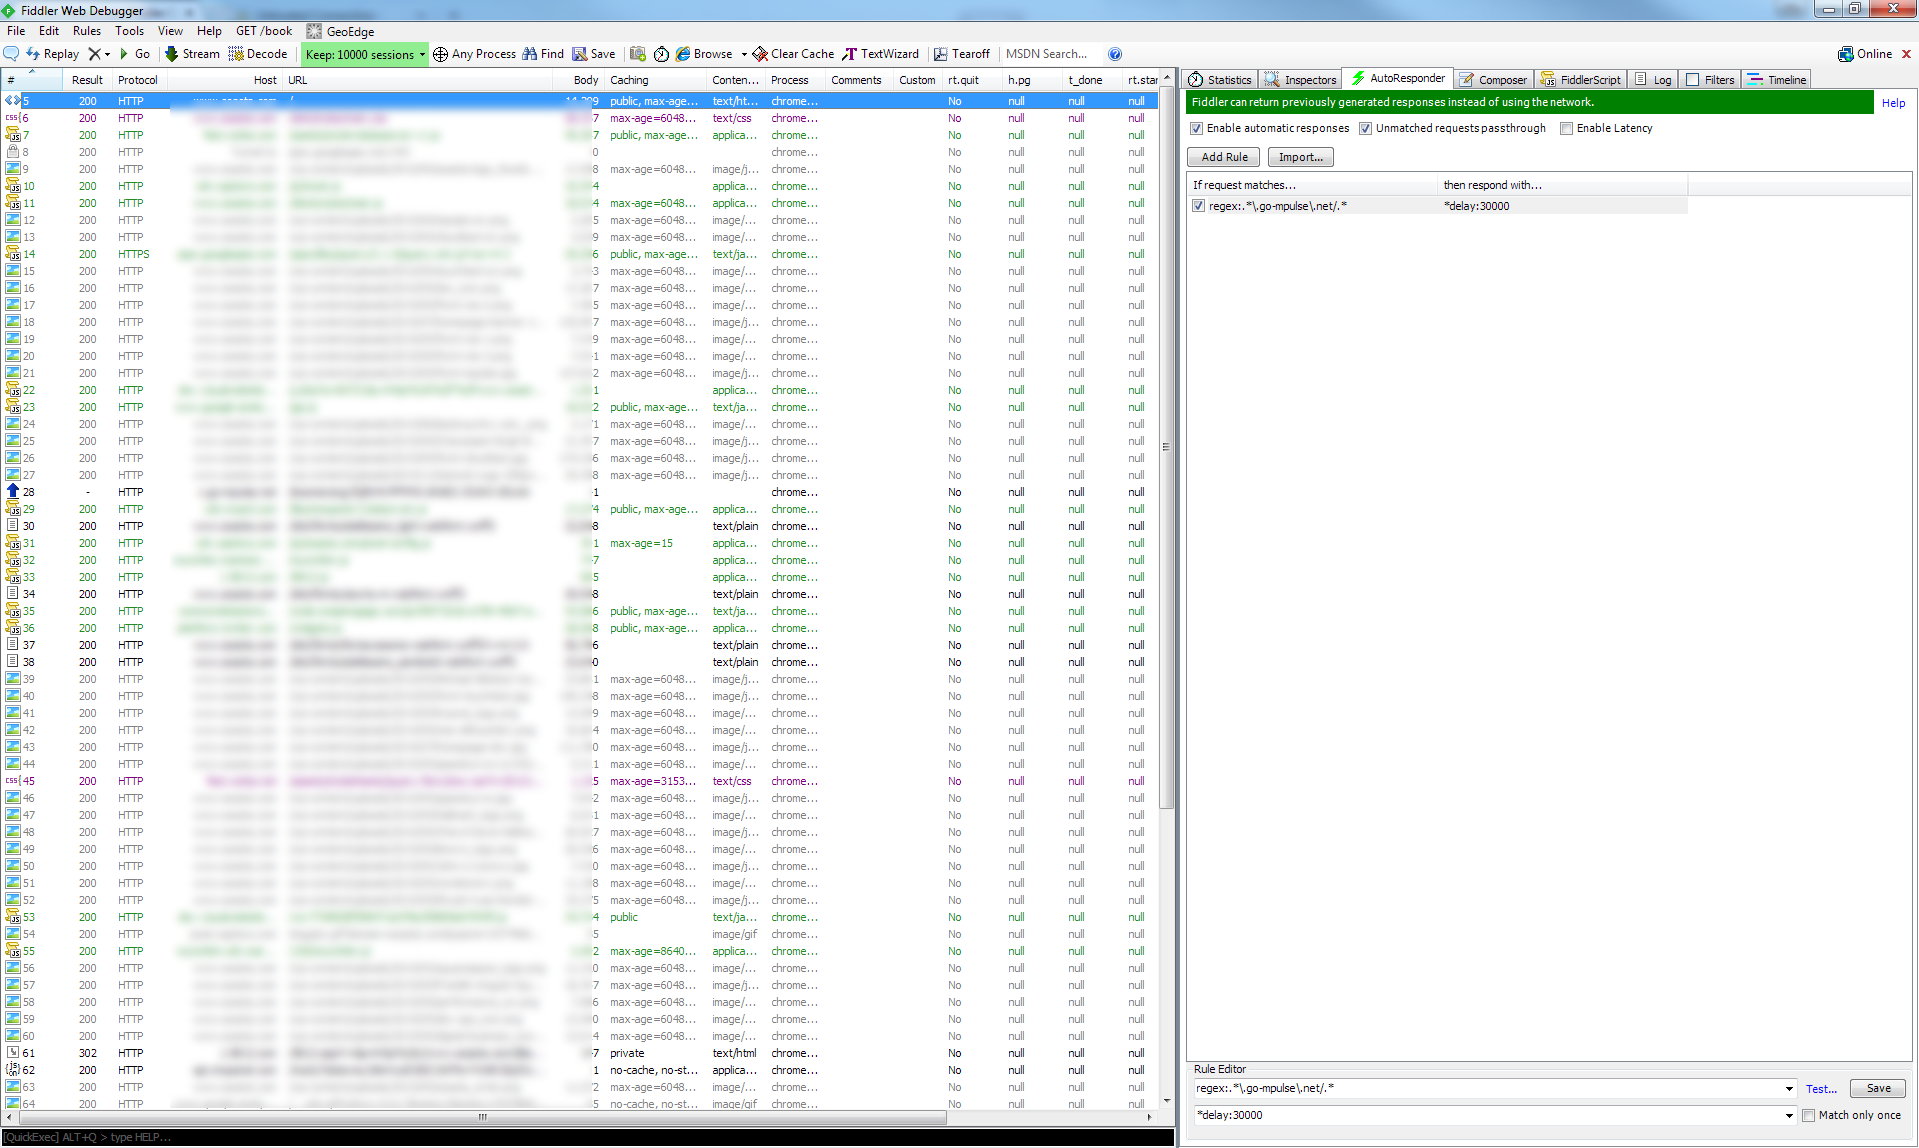
Fiddler SPOF
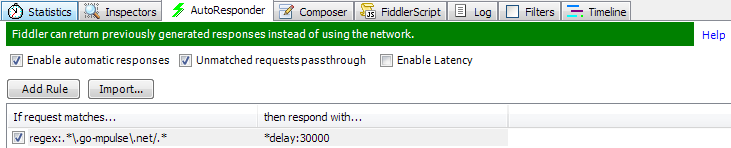
Fiddler SPOF
Scenario #1
Conclusion:
- Able to reproduce the issue on WebPageTest that day, but not later
- Saw periods of no CPU activity
- Saw periods of no TCP activity
- Boomerang had already reached the network interface, so something else was blocking it on the box
- Customer had multiple tag managers
Scenario #1
Conclusion:
- We ran SPOF checks with WebPageTest,
/etc/hosts, and Fiddler - Via WPT and Fiddler SPOF, we show our script is non-blocking
Scenario #2
Pre-render shenanigans
Customer:
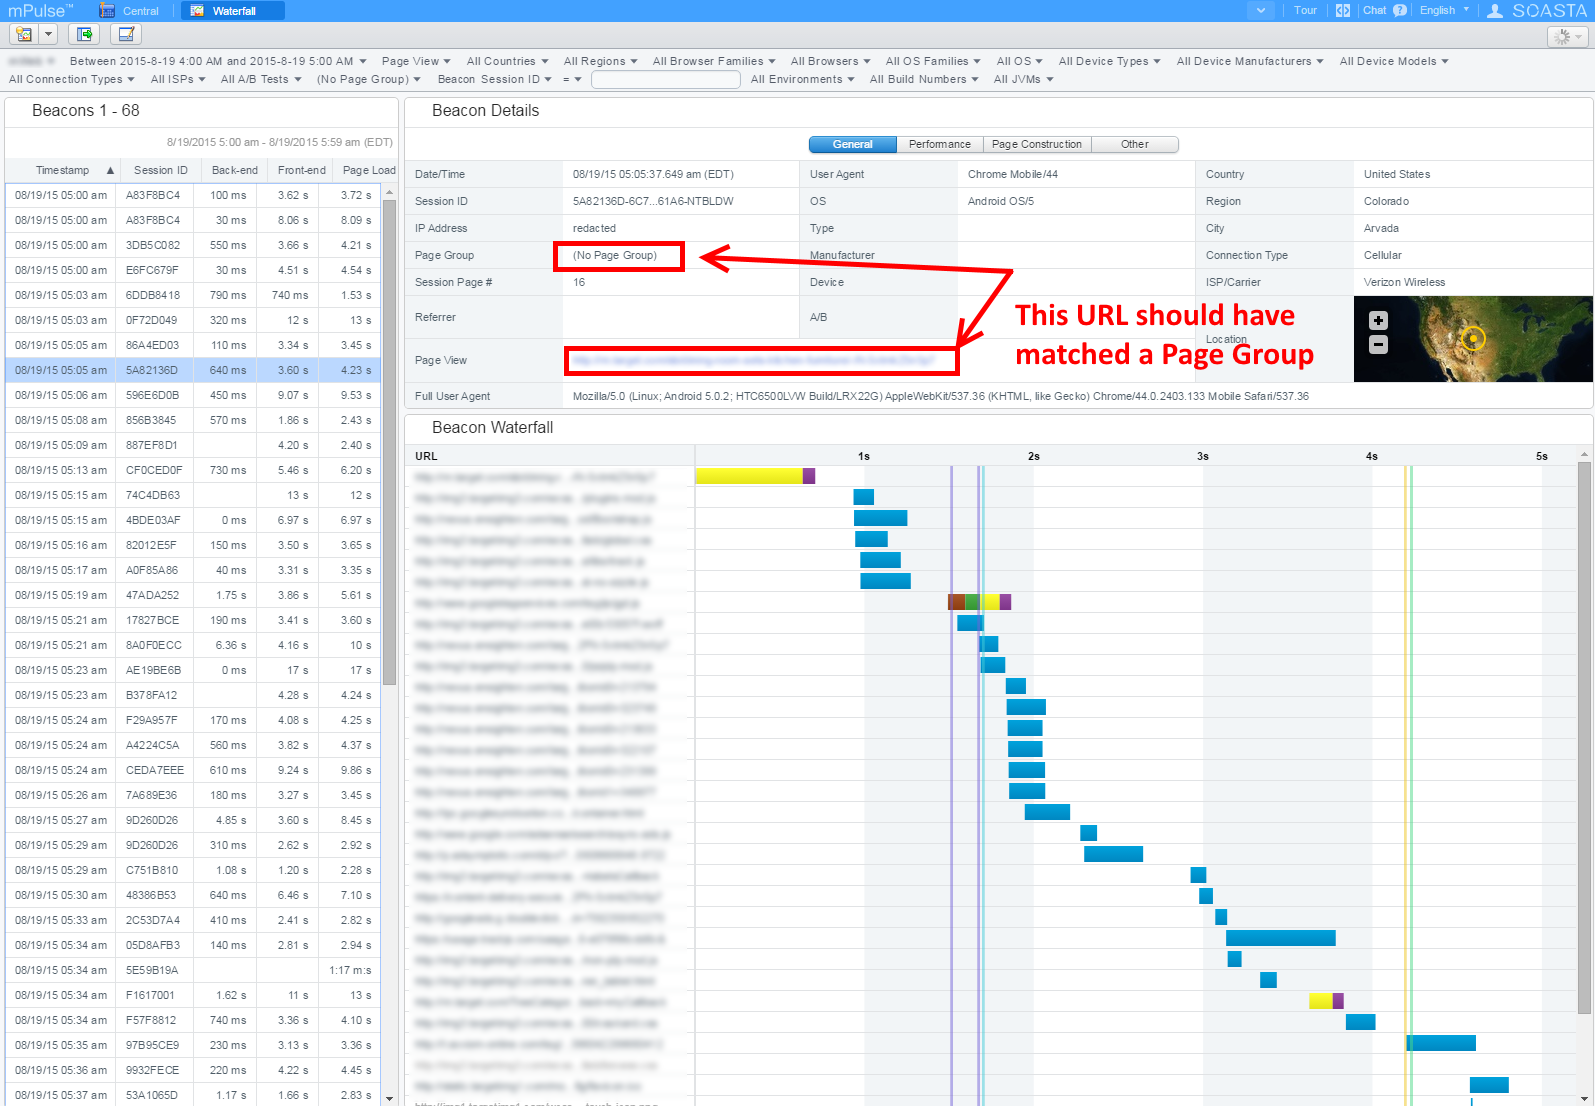
"I'm seeing pages that should match showing up in No Page Group again"
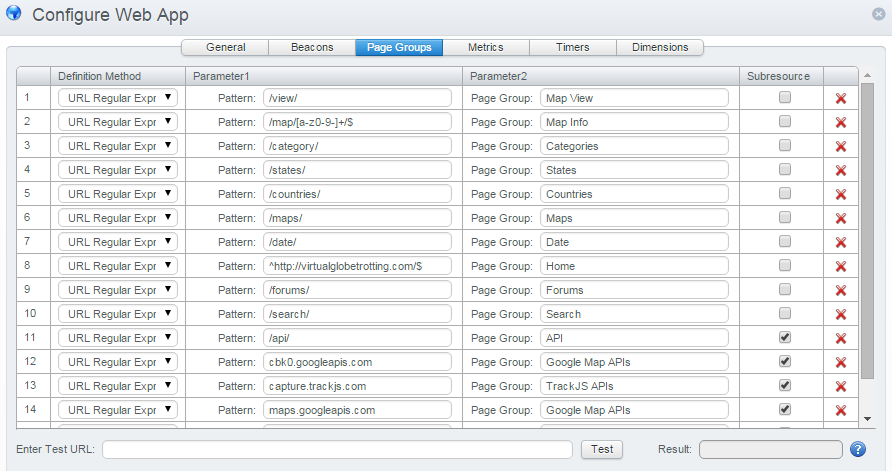
- You can define rules in mPulse for URLs to be matched to a Page Group dimension
- Customer was seeing a high number of hits to a
(No Page Group)category that should have matched a URL
Page Groups
Tool #9
RUM
- Real User Monitoring (RUM) tools
- Real world data
- Look at data in aggregate
Disclaimer
We obviously work for SOASTA, and mPulse is our RUM product
RUM
Aggregate Data
RUM lets you view your real-world customer data from an aggregate level
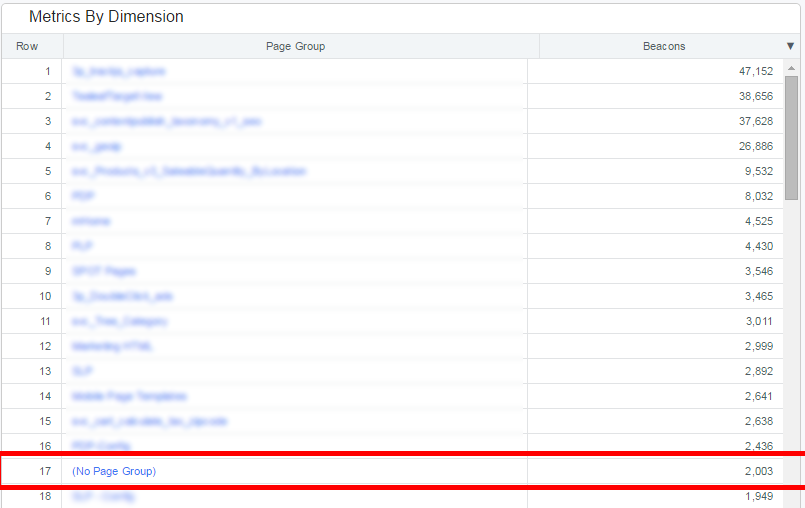
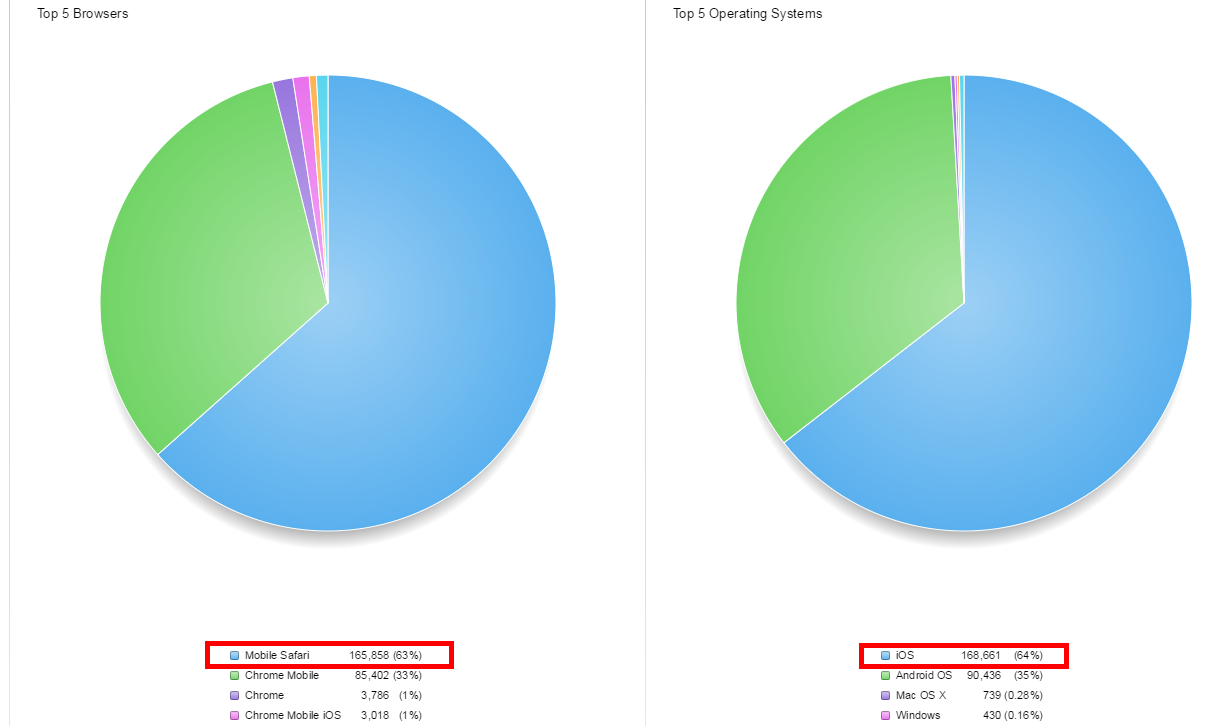
RUM
What are the most common causes of (No Page Group)?
iOS Mobile Safari sticks out:
RUM Waterfalls
RUM Waterfalls let you look at real-world individual page loads
Step #1
Reproduce the Issue
- From RUM data, the issue was most common on the home page from iOS devices.
- Time to reproduce the issue on an iPad!
Fiddler
One great use of Fiddler is to monitor external browser traffic without having Browser Dev Tools open (including mobile traffic!)
At this point, we sat with an iPad, reloading the home page hundreds of times to try to get a repro...
And tried...
And tried...
... an hour later, after trying many ways of loading the home page, we finally got a hit!
The Repro
- It just so happens I was typing
www.customer.comin the address bar, but got a phone call, so didn't hitGoyet - Saw a beacon go through without a Page Group attached, but clearly for the customer's home page
- Ran the same scenario again, same result. Repro!
- Mobile Safari was pre-rendering the page I was typing into the address bar
Step #2
Dive Deeper
Now that we had a repro, we were able to narrow down the issue to a bug in Boomerang that didn't deal with pre-render state transitions properly.
The fix was pretty straightforward, but we needed to test it.
Fix Validation
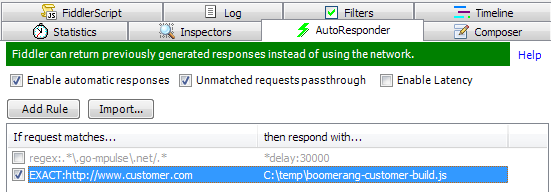
Fiddler allows you to inject your own content in place other live content on any host
We injected our fixed version into the customer' site, and validated that it worked
Scenario #2
Conclusion:
- We used RUM to narrow down the problem
- We used RUM waterfalls to validate the problem happens in real-world data
- We used tools like Fiddler help reproduce the issue
- We used tools like Fiddler to help validate the fix
Scenario #3
Stop messing with my readyState
Scenario #3
- We were loading
www.customer.comand found that Boomerang wasn't reliably sending a Page Load beacon - Boomerang should run on
window.onloadand fire a beacon, but this wasn't happening
Step #1
Reproduce the Issue
- After injecting a debug version of Boomerang (via Fiddler) onto the customer's site, we found some interesting logging statements
- For example,
document.readyState == "loading"even thoughwindow.onloadhad fired window.pageshowwas firing beforewindow.onload--window.onloadshould be first
Step #2
Dive Deeper
Our guess was that there was a script running on our customer's site that was messing with some of the document loading states, but had to prove it
One way is to fetch, unminify and analyze all of the site's JavaScript, but there are a couple easier ways if you want to use the Browser Dev Tools to work for you
Tool #9
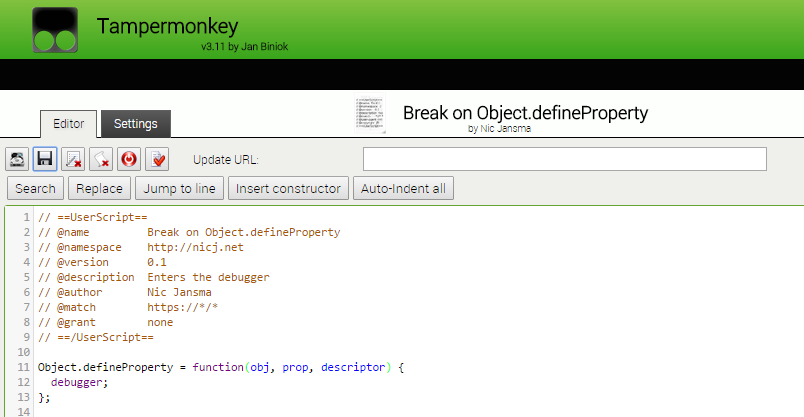
TamperMonkey
- "Userscript" manager for Chrome, Opera and Android
- Allows you to inject your own code in other sites without a proxy
We started out with a guess that something was changing window.onload or
document.readyState
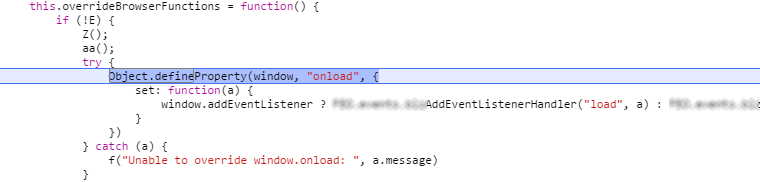
Easy way to see
One way of modifying pre-existing DOM properties is via Object.defineProperty
Inject this in the page to find anyone using it:
Object.defineProperty = function(obj, prop, descriptor) {
  debugger;
};
Hit!
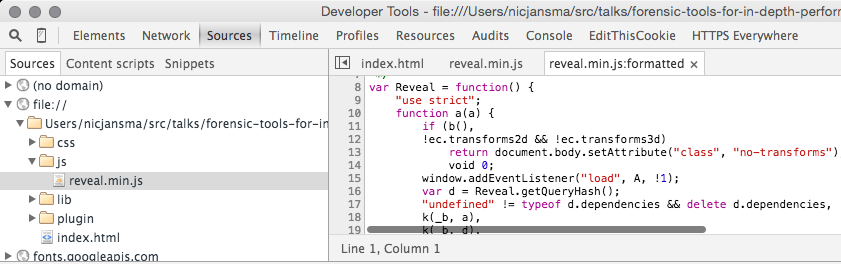
Chrome/IE/FF pretty-print (unminify) is the greatest thing
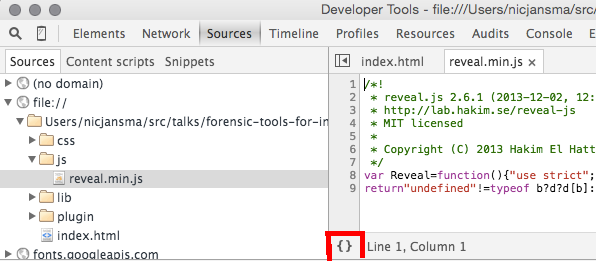
Chrome/IE/FF pretty-print (unminify) is the greatest thing
We also a similar change of document.readyState
Object.defineProperty(
  document,
  "readyState",
  {
    get:
      function()
      {
        return document.someOtherReadyState;
      }
  });
Scenario #3
Conclusion:
- Changes to
window.onloadanddocument.readyStatewere intentional by another third-party script for FEO optimization - We worked with that third-party to ensure our performance instrumentation wouldn't be affected
Scenario #4
Premature optimization is the root of all good intentions
Scenario #4
- Our mPulse beacons are protected against CSRF by a token and timestamp that gets sent with each beacon
- The CSRF token times out after 5 minutes
- A new token/timestamp is fetched from our servers every 5 minutes to ensure long-running apps can continue to send beacons
Scenario #4
- We were finding that there was an increasing occurence of the timestamp being "too old" -- that the CSRF timestamp on beacons were over 5 minutes old
- These beacons get dropped, but we needed to figure out why
Step #1
Reproduce the Issue
- Every beacon that gets sent to mPulse is permanently persisted (stripped of PII), so we can easily go back and investigate the raw data
- Every dropped beacon is logged along with why it was dropped
- These dropped beacons don't hit our reporting infrastructure, but we still want to be able to look for trends among the dropped beacons
Tool #10: NodeJS
- Great for writing throw-away analysis scripts
- JavaScript lets you quickly iterate
- Tons of NPM modules for command-line use
NodeJS
We use NodeJS for many things at SOASTA:
- boomerang.js build, deployment and testing (Grunt/Jenkins)
- Infrastructure tools
- Raw data analysis
NodeJS
Useful NodeJS NPM modules for command-line scripts:
jetty: ANSI control sequencesfast-stats: Statistical analysis of numeric datasetscli-table: Tables for the command-linecommander: Command-line argument parsingline-by-line: Reads large files without buffering into memory
Step #2
Dive Deeper
We fetched gigabytes of dropped-beacon log files, and started doing some statistical analysis on the causes
Dropped-beacon Breakdown
We can break down the dropped-beacons data by dimensions to help guide us towards finding a repro:
- By browser
- By OS
- By beacon type
- By URL
Dropped-beacon Breakdown
NodeJS cli-table output. By browser:
┌──────────────────────────────┬──────────┬──────────┐
│ URL                          │ Count    │ %        │
├──────────────────────────────┼──────────┼──────────┤
│ IE/7.0                       │ 1559     │ 66.65    │
├──────────────────────────────┼──────────┼──────────┤
│ IE/9.0                       │ 293      │ 12.53    │
├──────────────────────────────┼──────────┼──────────┤
│ Safari/5.1.9                 │ 283      │ 12.10    │
├──────────────────────────────┼──────────┼──────────┤
Dropped-beacon Breakdown
NodeJS cli-table output. By beacon type:
┌──────────────────────────────┬──────────┬──────────┐
│ URL                          │ Count    │ %        │
├──────────────────────────────┼──────────┼──────────┤
│ xhr                          │ 2222     │ 95.00    │
├──────────────────────────────┼──────────┼──────────┤
│ navigation                   │ 37       │ 1.58     │
├──────────────────────────────┼──────────┼──────────┤
│ ...                          │ 7        │ 0.30     │
├──────────────────────────────┼──────────┼──────────┤
│ Total                        │ 2339     │ 100      │
└──────────────────────────────┴──────────┴──────────┘
Dropped-beacon Breakdown
NodeJS cli-table output. By URL:
┌───────────────────────────────────────┬──────────┬──────────┐
│ URL                                   │ Count    │ %        │
├───────────────────────────────────────┼──────────┼──────────┤
│ http://www.customer.com/api/foo       │ 2187     │ 93.50    │
├───────────────────────────────────────┼──────────┼──────────┤
│ http://www.customer.com/anotherurl    │ 9        │ 0.38     │
├───────────────────────────────────────┼──────────┼──────────┤
The Repro
- From our raw data, the "too old" beacons were mostly caused by IE 7 and IE 9,
from XHRs to the customer's
/api/fooendpoint
Tool #11
Virtualization
- VirtualBox, VMWare, Parallels, etc
- All great ways to test older browsers
- modern.ie has VMs for IE 6, 7, 8, 9, 10, 11 and Edge
The Repro
We sat our VirtualBox IE 9 browser on www.customer.com for a while, watching XHRs
and beacons flow past
The Repro
Both IE 9 Developer Tools and Fiddler showed something interesting:
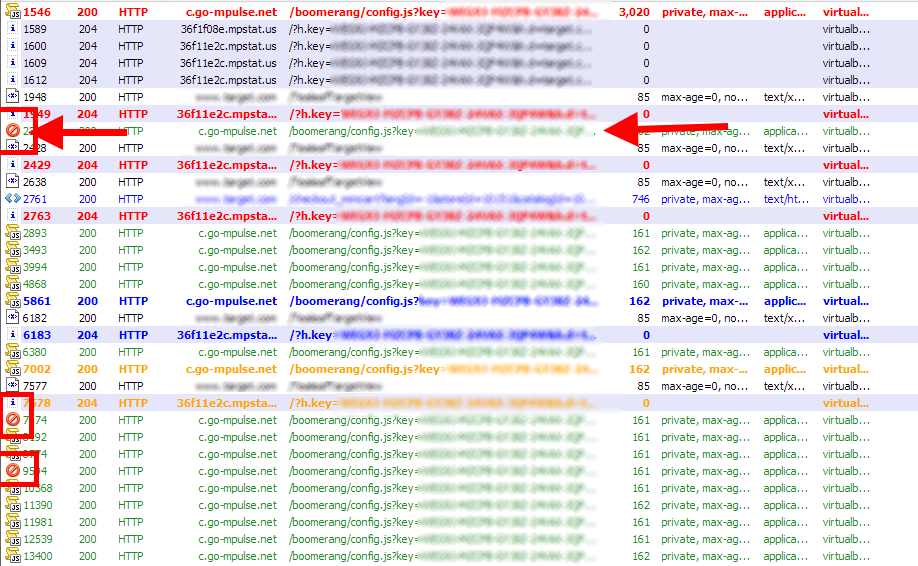
The Repro
IE 9 Developer Tools showing aborted requests to our injected <javascript>
that updates the token and timestamp:
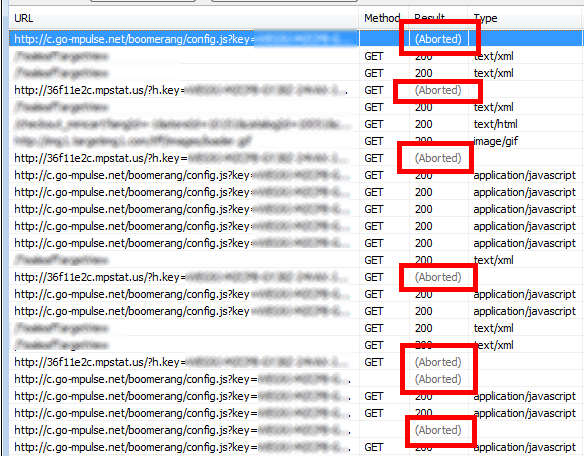
Scenario #4
Conclusion:
- We had recently made a change in boomerang.js to quickly remove the
<javascript>node that was fetching the updated CSRF token and timestamp - In some older browsers, this causes the network request to abort
- We were able to validate the fix (keeping the
<javascript>node around for a bit) via the same tools
Scenario #5
The many ways to send a beacon
... and the many ways to not send a beacon
Scenario #5
We send the boomerang.js beacon to mPulse via several methods:
- If the payload is small, we create a hidden
IMGelement with aimg.srccontaining the payload in the query string - If the payload is large (greater than 2083 bytes), we create a hidden
FORMelement and callform.submit()on it
Scenario #5
Windows 10 and Edge had just been released, and a customer reported that their site was hanging in Edge on some pages, and that it no longer did when boomerang.js was removed from their site
We had tested Windows 10 Techincal Preview (the previous Edge build) thoroughly, but something in the final release was causing problems
Step #1
Reproduce the Issue
Sure enough, loading customer.com would hang Edge for up to
30 seconds.
Since the browser was hung, it was hard to use the Edge debugger
Step #2
Dive Deeper
Time to dive into system-level tracing!
Tool #12
Event Tracing for Windows
- Event Tracing for Windows (ETW) is built into all versions of Windows from XP onward
- Enables the OS and applications to efficiently generate runtime tracing events
- xperf and the newer Windows Performance Analyzer (WPA) are tools used to generate ETW traces and then analyze them
ETW
Available tracing:
- CPU usage
- Disk usage
- Hard faults
- DPCs/ISRs
- TCP
- Sampled Profiling
- Custom app events (IE7+, Chrome)
- With stacks!
ETW - Downloading
- Part of the Windows Performance Toolkit
- Included in the Windows Assessment and Deployment Kit
- Friendly interface via UIforETW: github.com/google/UIforETW
ETW - Usage
Simple trace of system evenst:
xperf.exe -on latency -stackwalk profile
// [run scenario]
xperf.exe -stop -d myscenario.etl
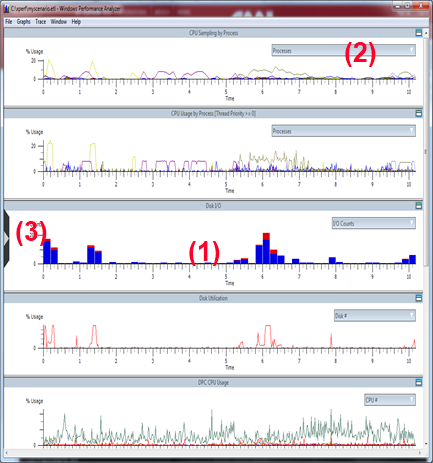
ETW - xperfview
- Timeline of events
- Filter processes
- Graph selection
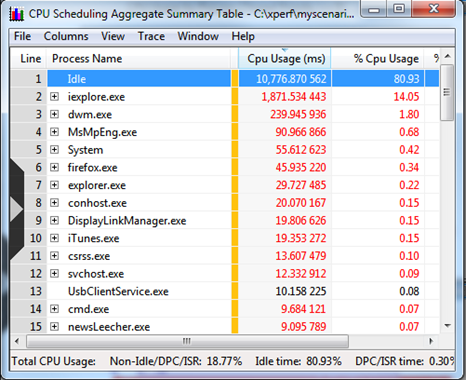
xperf - Summary Tables
- All of the graphs can be interacted with - zoom, popups, right-clicks
- Summary Tables show data in tabular form
ETW - Browser Events
Internet Explorer and Chrome both fire ETW events that you can overlay in the charts and see in the tables
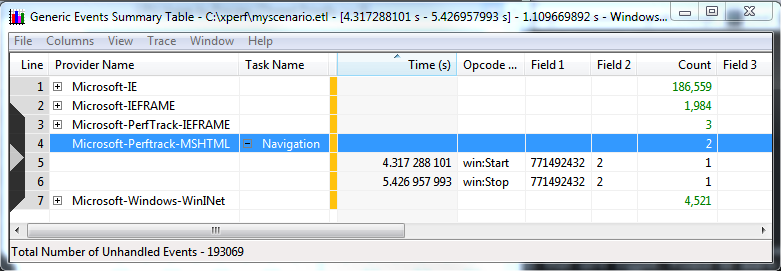
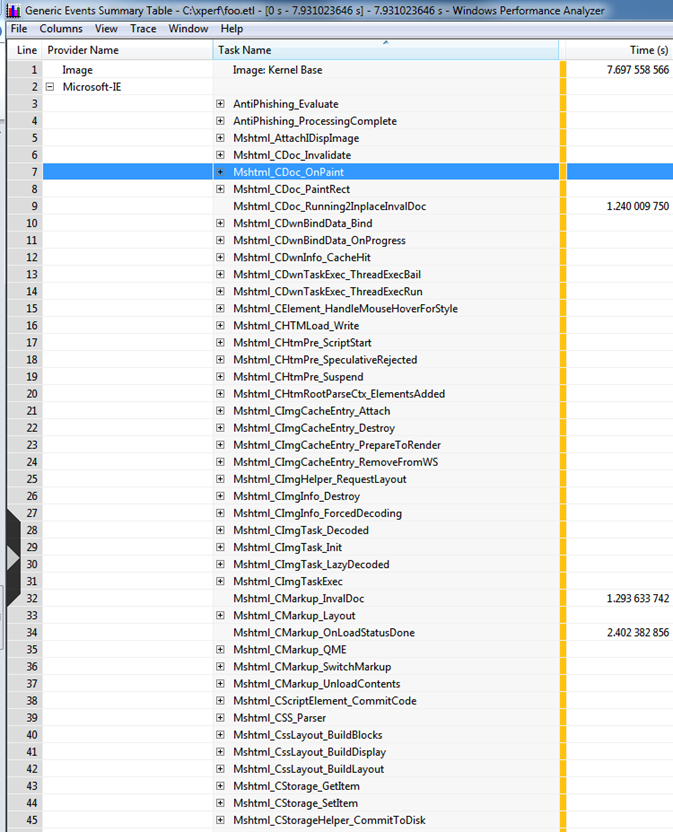
ETW - IE Events
Microsoft-IE events:
- CMarkup_OnLoadStatusDone: Page load is complete
- CDoc_OnPaint: Paints
- CDwnBindData_Bind: Downloads
- + 100s more
Microsoft-IEFRAME:
- Frame events for tabs, navigations, history, extensions
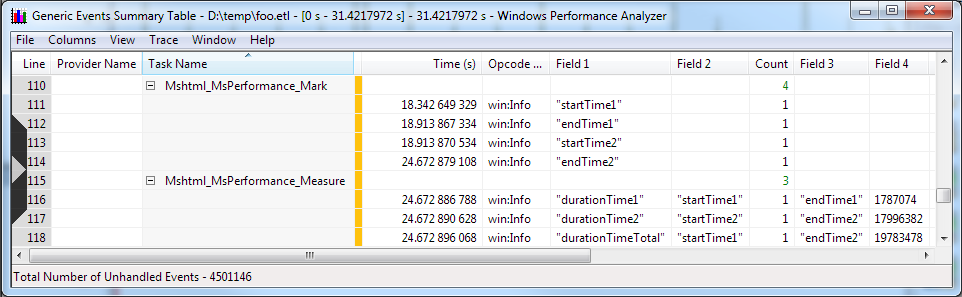
UserTiming in ETW
performance.mark("startTime1");
performance.mark("endTime1");
performance.mark("startTime2");
performance.mark("endTime2");
performance.measure("durationTime1", "startTime1", "endTime1");
performance.measure("durationTime2", "startTime2", "endTime2");
ETW - Stacks
By using -stackwalk on the command line, you can enable stacks on many events
Public symbol servers:
https://msdl.microsoft.com/download/symbols
http://symbols.mozilla.org/firefox
https://chromium-browser-symsrv.commondatastorage.googleapis.com/
ETW - More Help
More great tutorials on ETW, UIForETW, and xperf are available at: randomascii.wordpress.com
via Bruce Dawson @BruceDawson0xB
ETW - Uses
- Slow page load performance? Take a trace!
- See page load from a system-wide perspective
- Isolate page load from interference due to other CPU/disk/network activity
- Compare browser page load times and resource usage
- Examine browser CPU usage hot-spots from sampled profile stacks
- Automated page load regression testing of browsers via command-line tools
- Integrate page load time / cpu usage metrics into your build system
The Repro
- Using Windows 10 (in a VirtualBox VM?)
- Open Edge
xperf -on latency -stackwalk profile- Head to www.customer.com
- We immediately see the browser go to (Not Responding)
xperf -d repro.etl
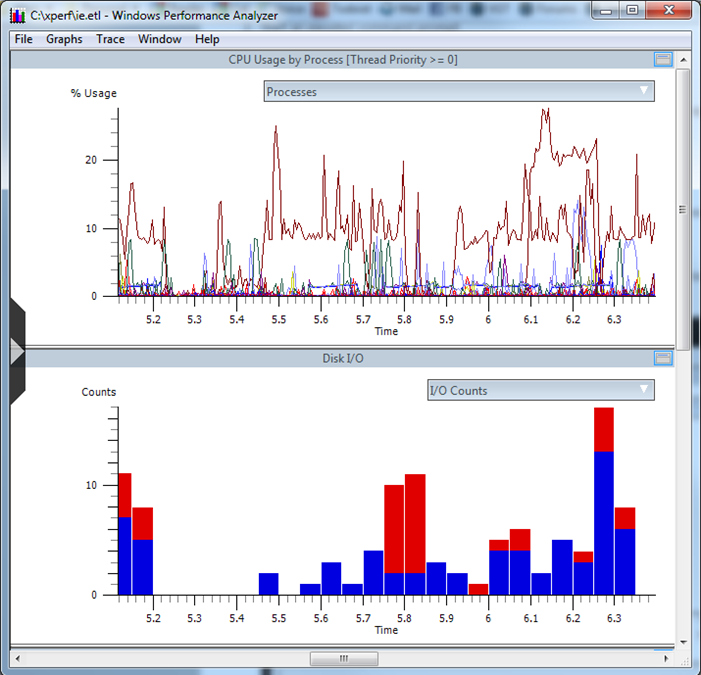
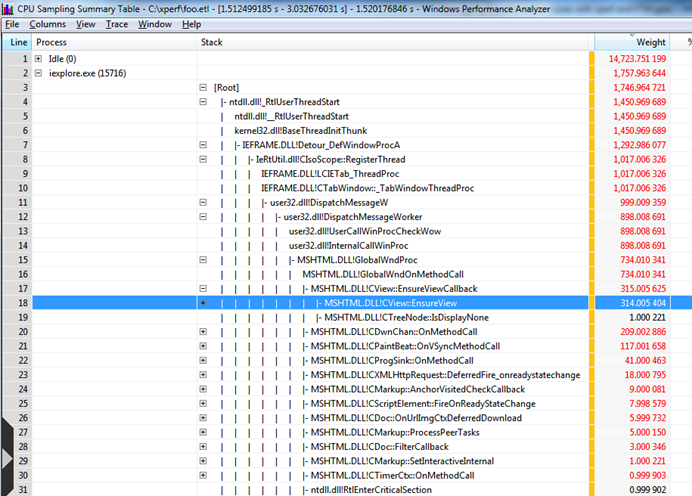
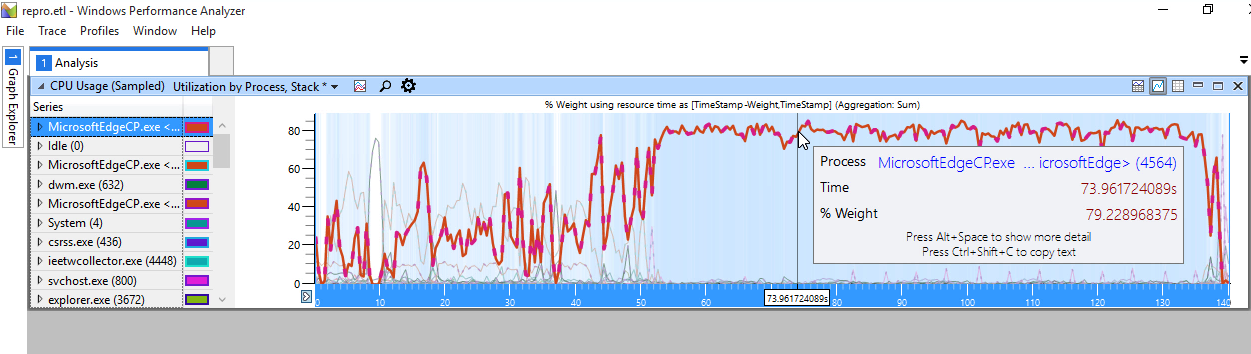
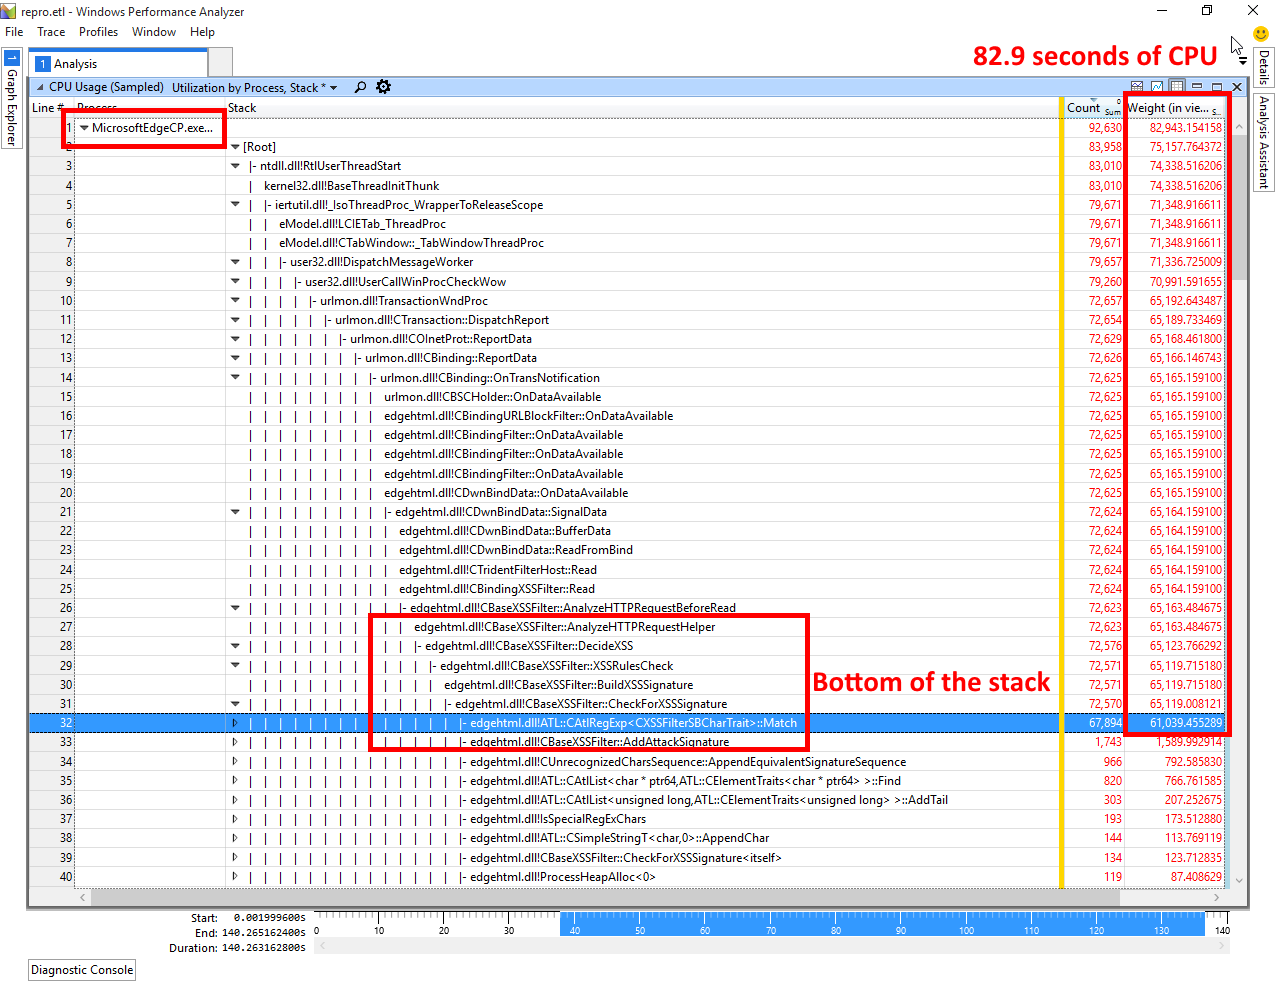
WPA - CPU sampling
The trace shows Edge spending nearly 100% CPU for over 70 seconds:
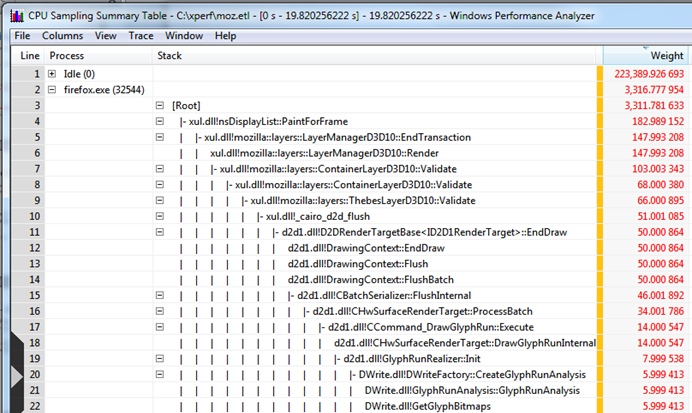
CPU sampling stacks
Dive Depeer
- With the repro, after a lot of digging around, we found that the way we were sending large beacons,
via a hidden
FORMsubmission, was triggering this Edge hang - But only if our server was returning either a:
200 OKresponse, or204 No Contentresponse that was missing aContent-Length: 0header.
Validation
We were able to test different fixes across our test matrix (IE 6 - Edge, Chrome, Firefox, Safari, Mobile Safari, Android, Lynx, etc) using Fiddler
Conclusion
- When you really need to look at a problem wholistically, system-level tracing is the only way to go
- ETW (or things like DTrace on Mac/Linux) can give you a different perspective, and show you CPU, disk, network, and other system activity occuring during your scenario
Links
- mPulse: mpulse.soasta.com
- WebPageTest: webpagetest.org
- tcpdump: tcpdump.org
- Wireshark: wireshark.org
- CloudShark: cloudshark.org
Links
- Chrome Trace: chromium.org/developers/how-tos/trace-event-profiling-tool
- Fiddler: telerik.com/fiddler
- Windows Performance Analyzer: go.microsoft.com/fwlink/p/?LinkID=293840
- VirtualBox: virtualbox.org
- TamperMonkey: tampermonkey.net
- NodeJS: nodejs.org
- UIForETW: github.com/google/UIforETW