Side Effects of Boomerang’s JavaScript Error Tracking
Table Of Contents
- Introduction
- What is Boomerang Doing
- Fixing Script Error
- Workarounds for Third Parties that Aren’t Sending ACAO
- Disabling Wrapping
- Side Effects of Wrapping
- Summary
Introduction
TL;DR: If you don’t have time to read this article, head down to the summary. If you’re specifically interested in how Boomerang may affect Chrome Lighthouse, Page Speed Insights or WebPagetest, check those sections.
Boomerang is an open-source JavaScript library that measures the page load time experienced by real users, commonly called RUM (Real User Measurement). Boomerang is easily integrated into personal projects, enterprise websites, and also powers Akamai’s mPulse RUM monitoring. Boomerang optionally includes a JavaScript Error Tracking plugin, which monitors the page for JavaScript errors and includes those error messages on the beacon.
When JavaScript Error Tracking is enabled for Boomerang, it can provide real-time telemetry (analytics) on the health of your application. However, due to the way Boomerang gathers important details about each error (e.g. the full message and stack), it might be incorrectly blamed for causing errors, or as the culprit for high CPU usage.
This unintentional side-effect can be apparent in tools like browser developer tools’ consoles, WebPagetest, Chrome Lighthouse and other benchmarks that report on JavaScript CPU usage. For example, Lighthouse may blame Boomerang under Reduce JavaScript Execution Time due to how Boomerang "wraps" functions to gather better error details. This unfortunately "blames" Boomerang for more work than it is actually causing.
Let’s explore why, and how you can ensure those tools report on the correct source of errors and JavaScript CPU usage.
This article is applicable to both the open-source Boomerang as well as the Boomerang used with Akamai mPulse. Where appropriate, differences will be mentioned.
What is Boomerang Doing?
Once enabled, the Boomerang Errors plugin configures itself to listen for errors on the page. It first hooks into the Browser’s onerror event, which the browser fires whenever there is a JavaScript error on the page.
Unfortunately, the onerror event has a major limitation: if an error originates in a cross-origin (third-party) library, the message reported by onerror will simply be "Script error.".
As an example, let’s say your site at mysite.com loads a JavaScript library from the CDN //othercdn.com/library.js as well as jQuery (from //code.jquery.com):
<html>
    <head>
        <script src="//othercdn.com/library.js"></script>
        <script src="//code.jquery.com/jquery-3.3.1.min.js"></script>
    </head>
    ...
Once library.js is loaded, it performs some initialization. Let’s pretend it does something like the following:
// library.js
function init() {
    setTimeout(function myCallback() {
        if (jQuery("abc")) {
            ...
        }
    }, 100);
}
In this scenario, let’s pretend jQuery has not yet loaded fast enough before the setTimeout() runs, so attempting to call jQuery() in this init() function would fail. An exception will be thrown, something similar to "jQuery is not defined".
You would see this message in your developer tools console:
ReferenceError: jQuery is not definedHere’s an example of what Chrome’s Developer Tools looks like:
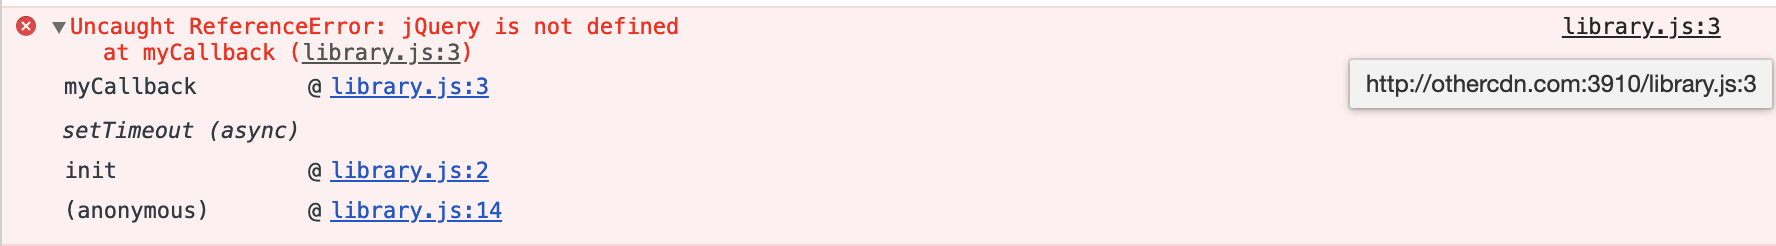
Unfortunately, because the library is cross-origin, anything listening for onerror (e.g. Boomerang) merely gets the message "Script error.":
// in Boomerang or the site itself
window.addEventListener("error", function(errEvent) {
    console.log("onerror called:", errEvent);
    var message = errEvent.message; // Script error.
    var stack = errEvent.error; // null, would normally contain error.stack
});
Here’s what the errEvent object looks like in Chrome’s Developer Tools in the above scenario:
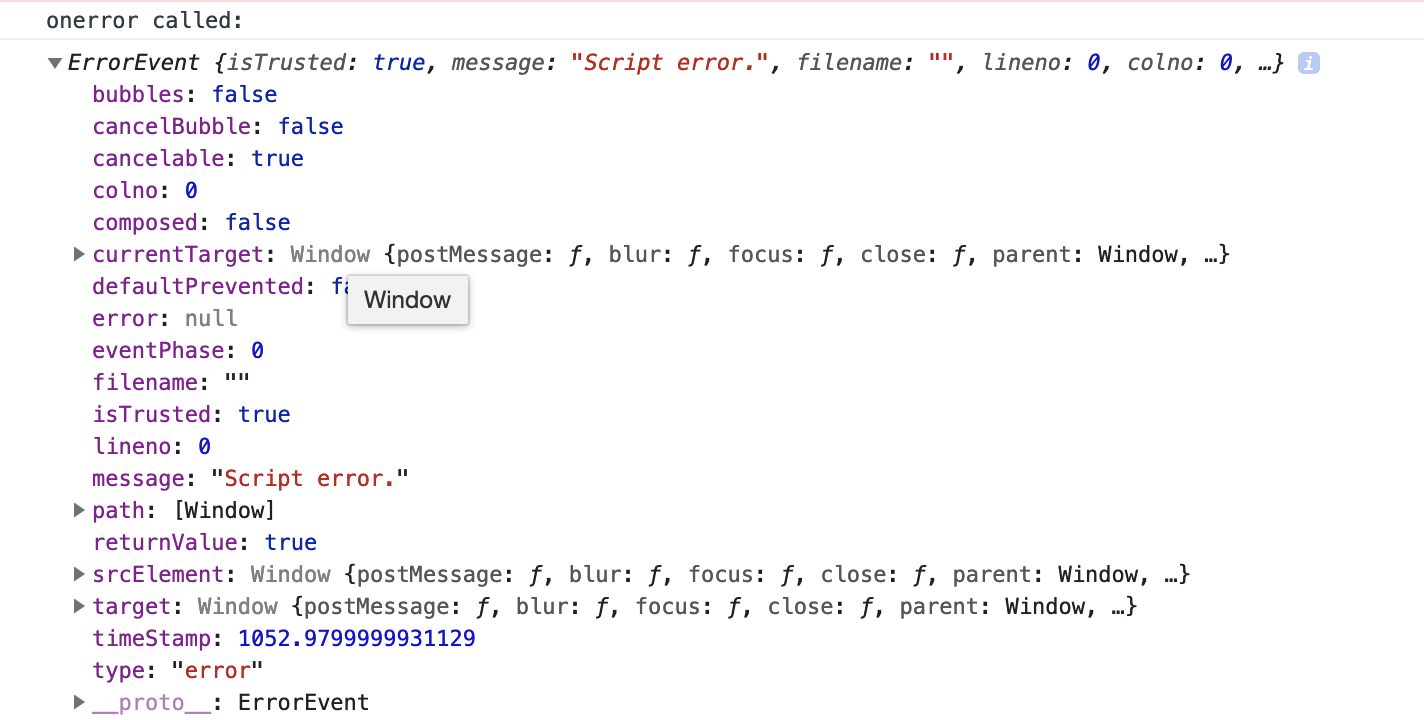
The message (message: "Script error.") and stack (error: null) have been obscured by the browser to protect against potentially sensitive information in the error message coming from the cross-origin JavaScript.
The "Script Error." string is given instead of the real error message and does not contain any useful information about what caused the error. In addition, there is no stack associated with the message, so it’s impossible to know where or why the error occurred.
Note that if you have Developer Tools open when an error occurs, you can see the full error message and stack in the Console. However, JavaScript libraries that have registered for onerror only get redacted information ("Script error."). This is because there aren’t any security or privacy concerns for a developer looking at their own machine’s information.
Fixing Script Error
As the owner of mysite.com, you can "give access" to the full error information (message and stack) by including the library.js with the Access-Control-Allow-Origin HTTP response header and a crossorigin="anonymous" HTML attribute. Unfortunately, it requires both mysite.com and othercdn.com to opt-in to sharing the full message and stack.
To ensure a cross-origin script shares full error details with onerror listeners, you’ll need to do two things:
Add
crossorigin="anonymous"to the<script>tag- The
crossorigin="anonymous"attribute tells the browser that the script should be fetched without sending any cookies or HTTP authentication
- The
Add the
Access-Control-Allow-Origin(ACAO) header to the JavaScript file’s response.- The
Access-Control-Allow-Originheader is part of the Cross Origin Resource Sharing (CORS) standard. - The ACAO header must be set in the JavaScript’s HTTP response headers.
- An example header that sets ACAO for all calling origins would be:
Access-Control-Allow-Origin: *
- The
If both conditions are true, cross-origin JavaScript files will report errors to onerror listeners with the correct error message and full stack.
The biggest challenge to getting this working in practice is that (1) is within the site’s control while (2) can only be configured by the owner of the JavaScript. If you’re loading JavaScript from a third-party, you will need to encourage them to add the ACAO header if it’s not already set. The good news is that many CDNs and third-parties set the ACAO header already.
Unfortunately, not all third-party libraries (or the site itself) will be able, or willing, to opt-into this full error information. If not, the error message is stuck at just "Script error.".
Unless…
Workarounds for Third Parties that Aren’t Sending ACAO
However, there is a workaround for third-party domains that don’t set Access-Control-Allow-Origin.
If the page’s JavaScript (or a library like Boomerang) opts to, it can "wrap" all calls to the third-party script in a try/catch block. If an exception is thrown, the catch (e) { ... } still gets access to the full error message and stack, even from cross-origin scripts.
For example:
try {
    // calls a cross-origin script that doesn't have ACAO
    initLibrary();
} catch (e) {
    // report on error with e.message and e.stack
}
It may not be practical to wrap every invocation of cross-origin functions. Boomerang includes some helper functions making wrapping easier.
In addition, Boomerang will also provide some assistance for wrapping events and callbacks initiated by third-party scripts, so the site doesn’t have to do this on its own. Boomerang "wraps" top-level JavaScript functions, forwarding all original calls and callbacks to its own wrapping function instead. This is done on setTimeout(), setInterval(), addEventListener(), and similar functions so any callbacks from those functions "originate" in the page and are wrapped.
This sounds complicated, but let’s see how Boomerang can do this, and how it can benefit error reporting.
First, Boomerang will wrap top-level functions that register callbacks, like setTimeout(), setInterval(), addEventListener():
var origSetTimeout = window.setTimeout;
window.setTimeout = function wrappedFunction() {
    try {
        origSetTimeout.apply(this, arguments);
    } catch (e) {
        // An exception happened!
        // Boomerang gets the full message and stack
    }
}
(Note the actual wrapping is a bit more complicated, see the Boomerang Errors.js plugin for more details).
Why does this help? If any exception happens within the callback, the wrapped function’s try/catch is at the top of the stack, so it gets the full error message! This include the original error message (instead of "Script error."), and the full stack.
Putting this wrapping in place can help reduce occurrences of "Script error." from third-party scripts within a page, if those scripts can’t otherwise be opted-in via ACAO and the crossorigin="anonymous" attribute.
Disabling Wrapping
Wrapping is currently enabled by default when enabling JavaScript Error Tracking in Boomerang. You can have Errors.js opt-out of wrapping by setting the following configuration options to false (for open-source Boomerang):
BOOMR.init({
    Errors: {
        monitorTimeout: false, // disable setTimeout and setInterval wrapping
        monitorEvents: false   // disable addEventListener and removeEventListener wrapping
    }
})
For users of Akamai mPulse, wrapping can be disabled by including the following JavaScript snippet on the page prior to Boomerang being loaded:
window.BOOMR_config = window.BOOMR_config || {};
window.BOOMR_config.Errors = window.BOOMR_config.Errors || {};
window.BOOMR_config.Errors.monitorTimeout = false; // disable setTimeout and setInterval wrapping
window.BOOMR_config.Errors.monitorEvents = false; // disable addEventListener and removeEventListener wrapping
Or via the following Configuration Override in Luna:
{
    "Errors": {
        "monitorTimeout": false,
        "monitorEvents": false
    }
}
You may also enable or disable JavaScript Error Tracking entirely within the Akamai mPulse app configuration.
Side Effects of Wrapping
While doing this wrapping to get additional error details for cross-origin scripts sounds ideal, there are some notable downsides to be aware of, as Boomerang being at the "bottom" of the stack may now confuse several well-intentioned tools.
Here are some of the side-effects:
Overhead
Since Boomerang has replaced top-level function such as setTimeout() with its own wrapper function, there will be non-zero overhead when those functions are called and Boomerang’s code forwards the arguments to the native functions.
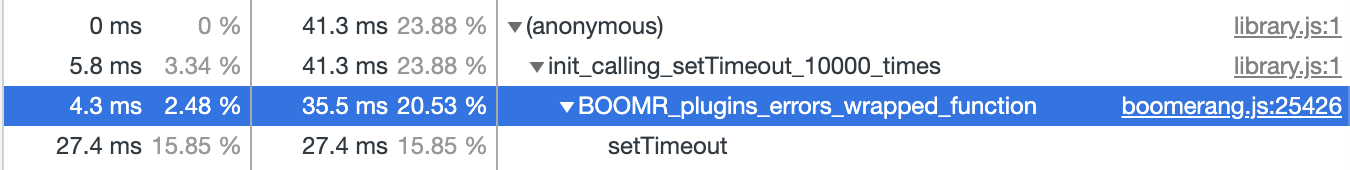
The good news is the wrapped function is minimal and efficient, and generally won’t appear in profiling traces. In a experiment of calling setTimeout() (after being wrapped) 10,000 times, a modern (2017 Macbook Pro) laptop’s JavaScript profile shows only 4.3ms of sampled profile hits in the wrapped function (BOOMR_plugins_errors_wrapped_function), so 0.43 micro-seconds of overhead:
Console Logs
Once Boomerang’s JavaScript Error Tracking with wrapping is enabled, errors that are triggered by other libraries that have been wrapped will now look like they come from Boomerang instead, as Boomerang is now on the bottom of the call stack.
For example, the above error where jQuery() was undefined may look like this before Boomerang has wrapped setTimeout():
Uncaught ReferenceError: jQuery is not defined at myCallback @ library.js
setTimeout (async)
init @ library.js
Browser Developer Tools report the "cause" of JavaScript errors as the last non-async callback. In this case, it will report library.js in the right side of Chrome Developer Tools’ Console:
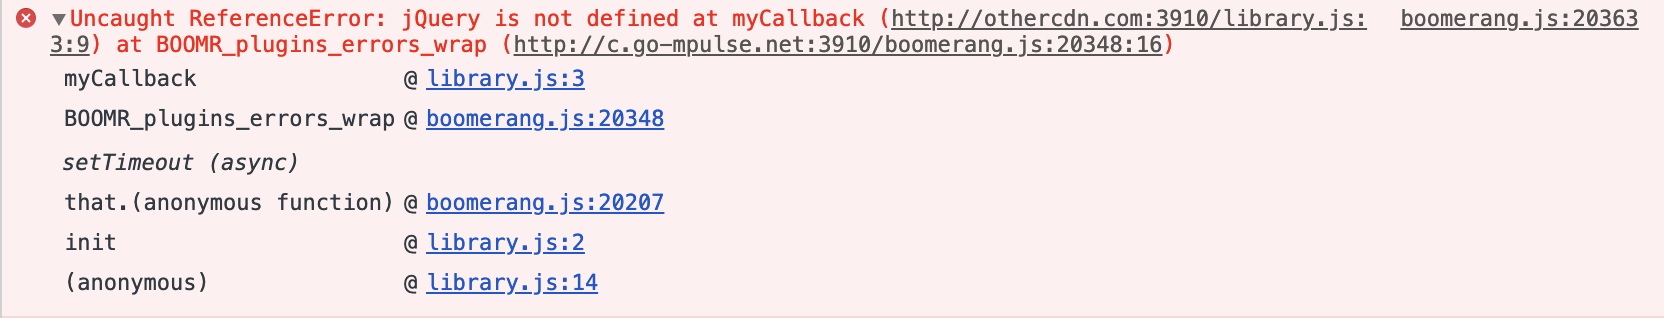
After Boomerang wraps setTimeout(), the error’s message says the same, but the stack has an additional function from Boomerang at the bottom:
Uncaught ReferenceError: jQuery is not defined at myCallback @ library.js
BOOMR_plugins_errors_wrap @ boomerang.js
setTimeout (async)
init @ library.js
Because BOOMR_plugins_errors_wrap is now the last non-async function, Chrome Developer Tools’ Console now lists boomerang.js as the cause (the file on the right side):
Boomerang’s Errors.js JavaScript Error Tracking plugin automatically looks for its own functions on the stack of error messages and will try to exclude its own wrapped functions when it reports on errors. Tools that visualize error messages, such as Akamai’s mPulse, may also be able to "de-prioritize" Boomerang on the stack, so the true culprit is correctly reported:
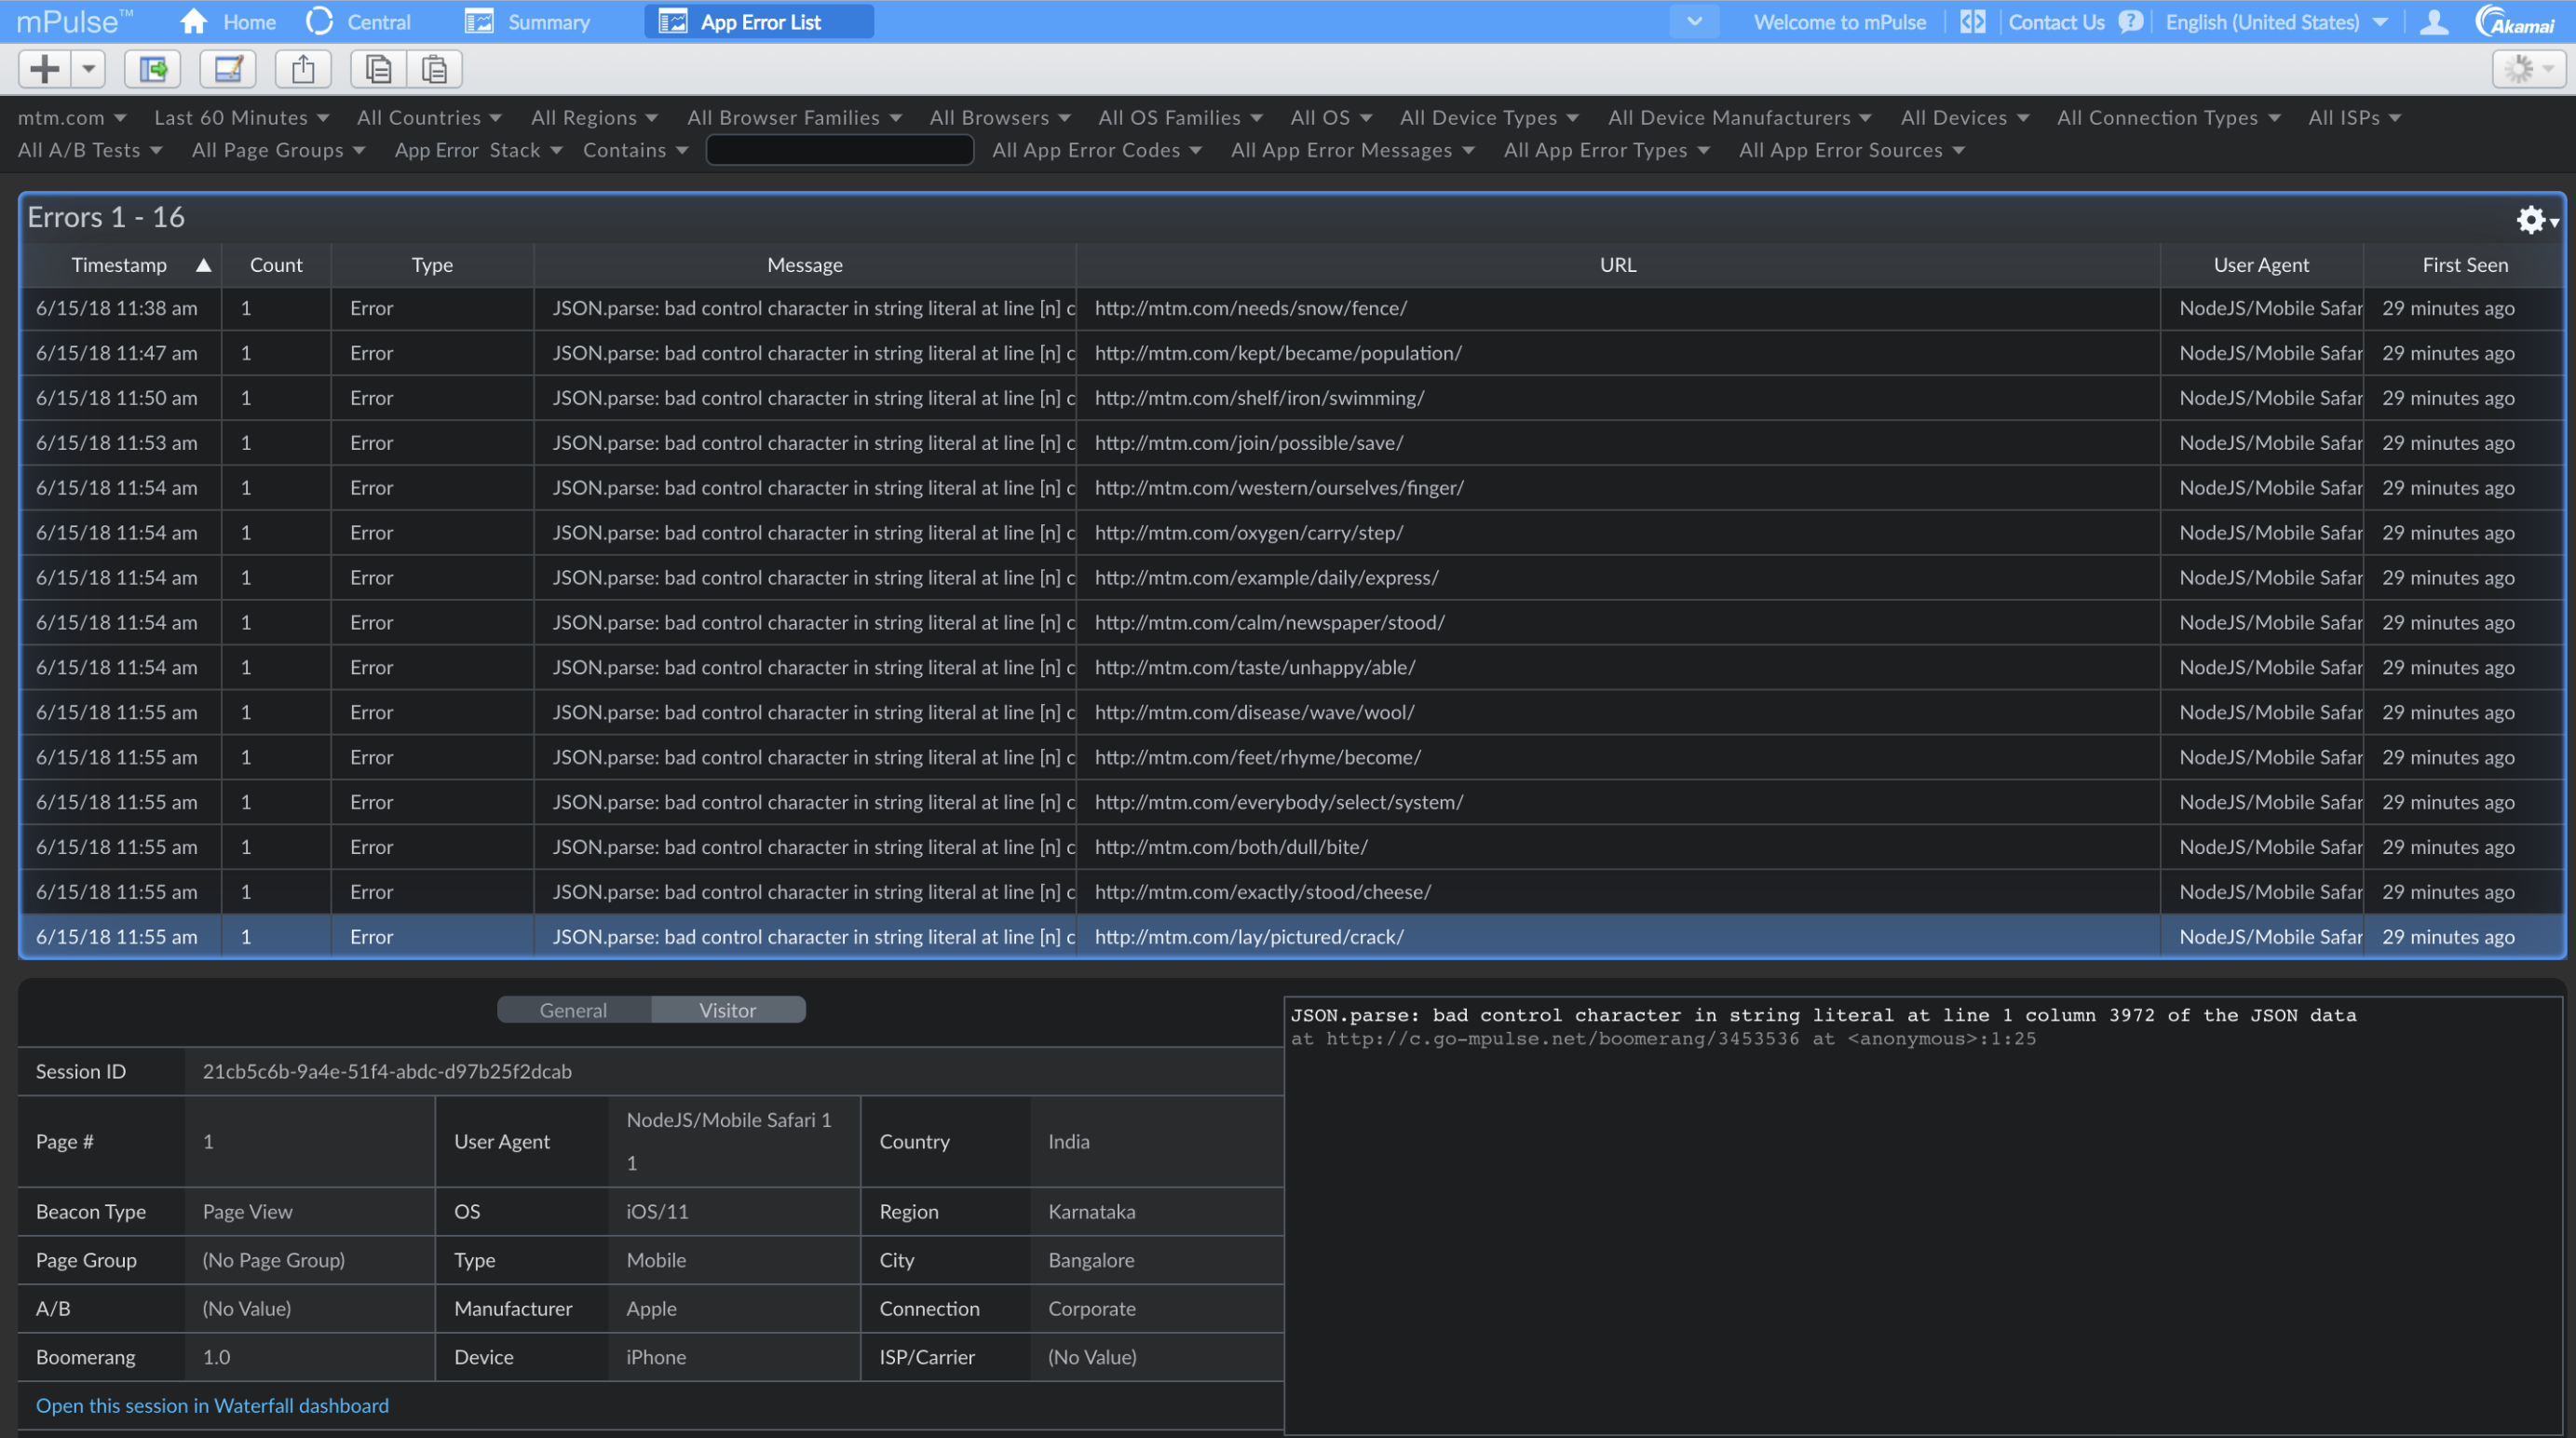
To be clear: Boomerang is not causing these errors, developer tools are just confused because of the wrapping.
You can confirm that Boomerang is not the cause of the errors by disabling wrapping.
Browser CPU Profiling
Once Boomerang’s JavaScript Error Tracking with wrapping is enabled, browser developer tools such as Chrome’s Performance and Profiler tabs may be confused about JavaScript CPU attribution. In other words, they may think Boomerang is the cause of more work than it is.
In addition, because Boomerang’s wrapped functions are now at the bottom of the stack, reports such as By Domain might get attributed to Boomerang’s domain (or the root site), instead of third-party libraries.
Let’s look at a slightly different example of a third-party library doing work. In this case, let’s busy-loop for 5 seconds to show exaggerated work from a library:
// library.js
function init() {
    setTimeout(function myCallback() {
        var startTime = Date.now();
        while (Date.now() - startTime < 5000) {
            // NOP
        }
    }, 100);
}
Without wrapping, Chrome’s JavaScript Profiler shows the myCallback() function doing ~5 seconds of busy work:
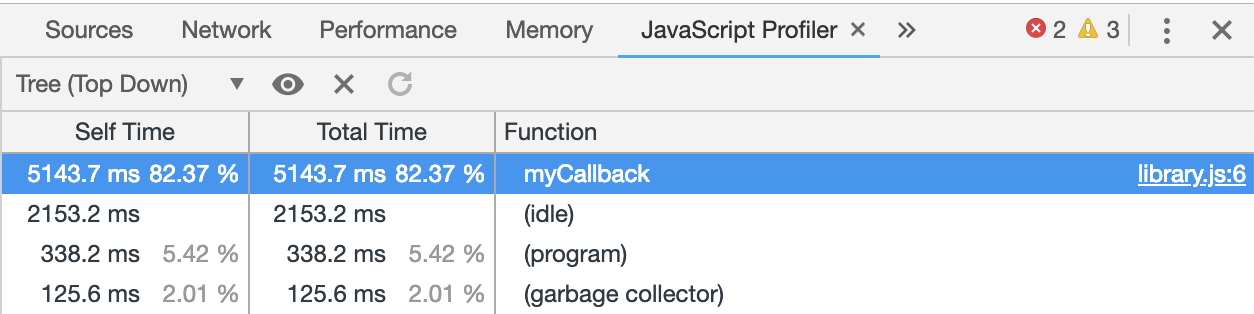
The myCallback() function above is also at the "bottom of the stack".
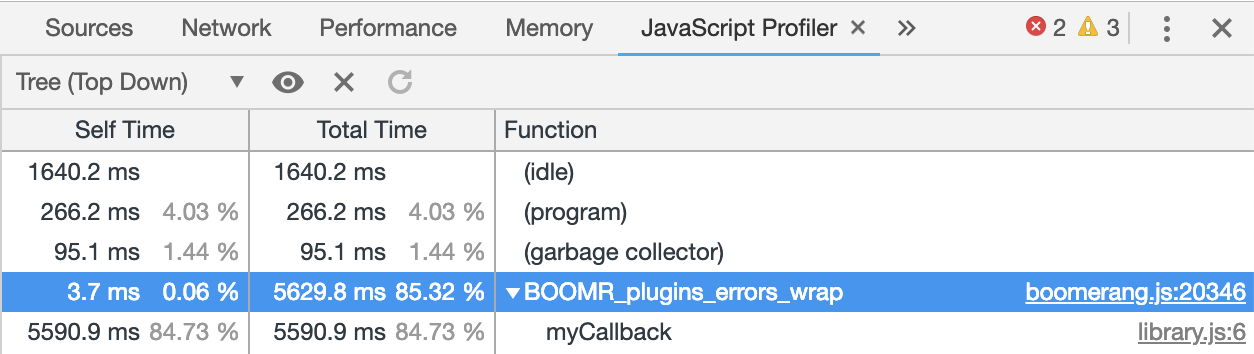
When Boomerang wraps the top-level setTimeout() and its callbacks, we see the function BOOMR_plugins_errors_wrap show up as the top cause of CPU usage:
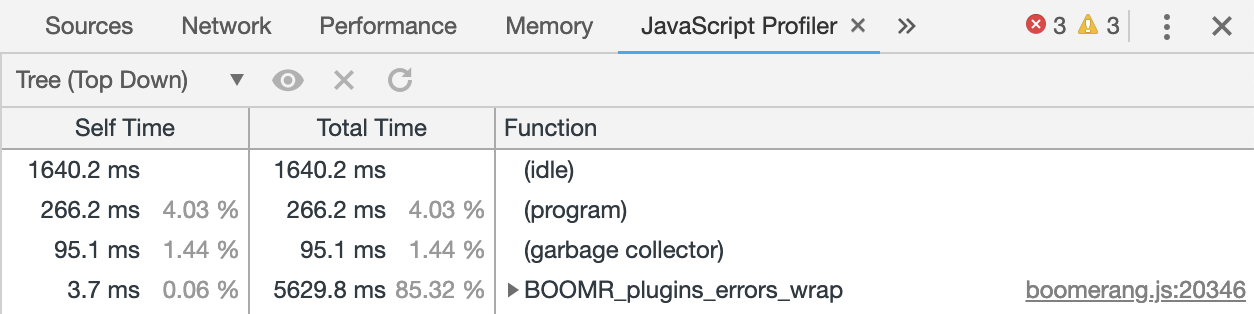
However, once expanded, we see the real cause of CPU usage (as evidence by Self Time) as the original myCallback() function:
This is also apparent in Chrome’s Performance tab. Here we see the un-wrapped function show at the top of the charts:
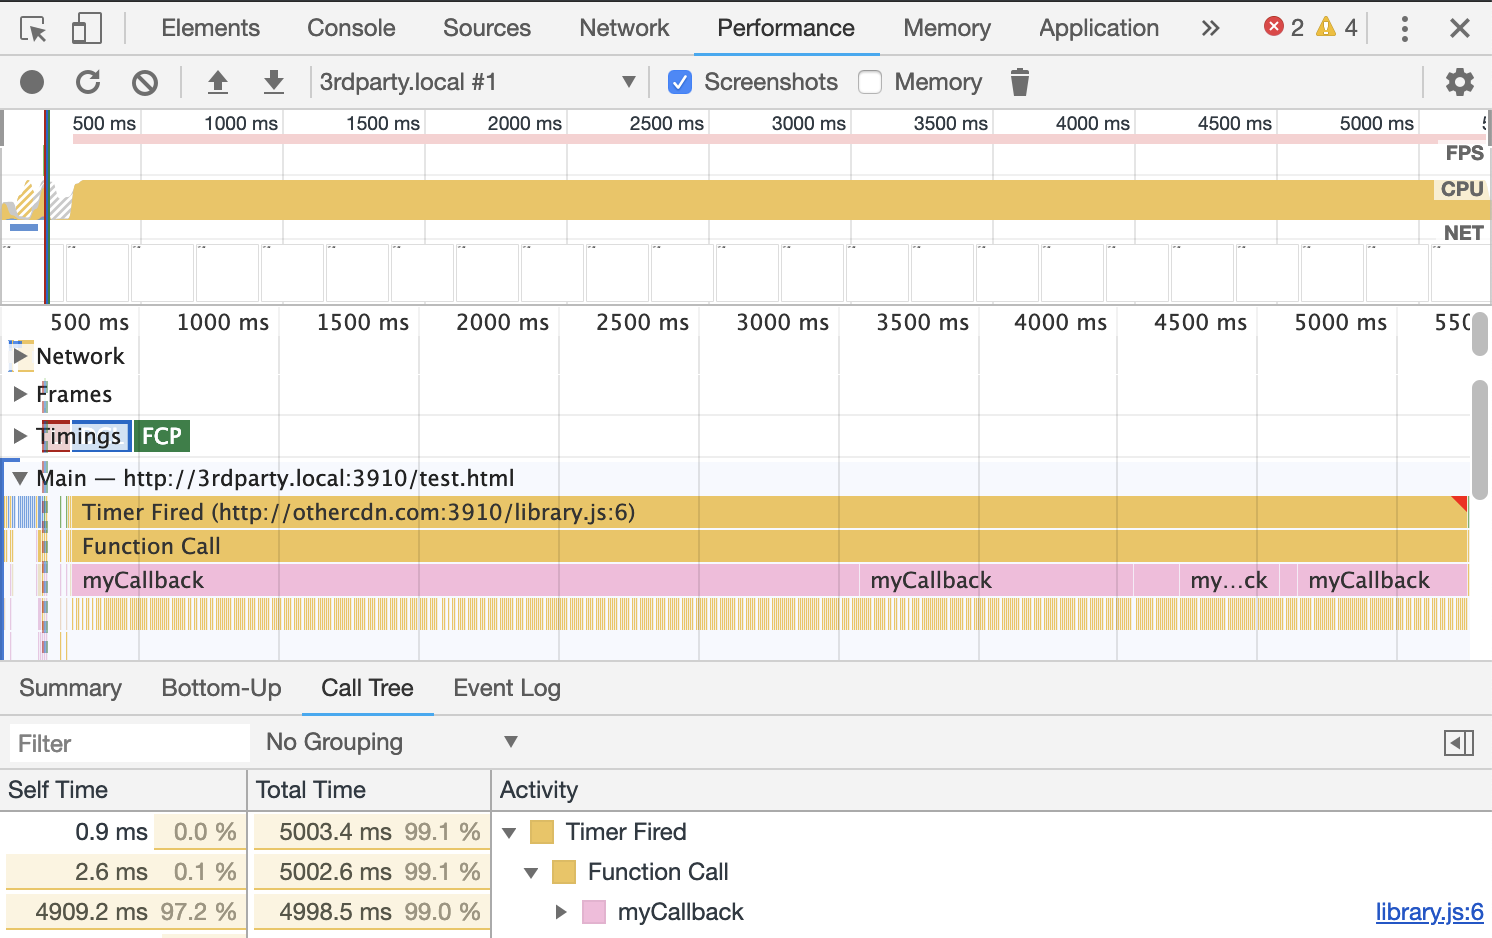
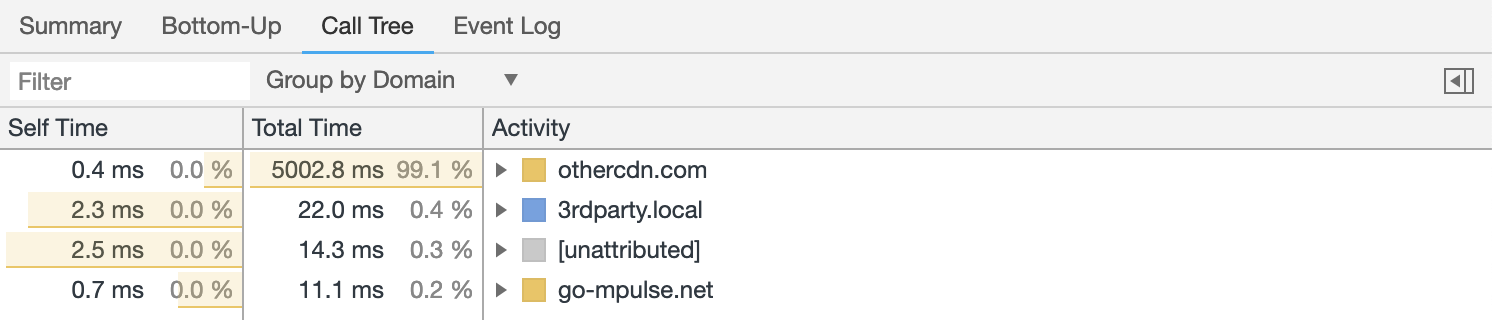
And when Grouped By Domain, the library (//othercdn.com) shows up at the top as well:
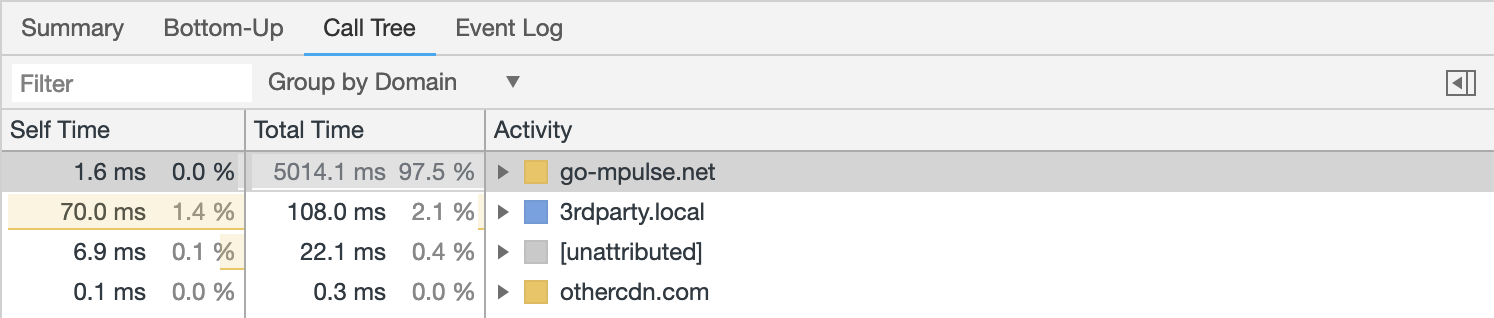
However, once Boomerang wrapping has happened, we see Boomerang getting attributed to all of the work in both views:
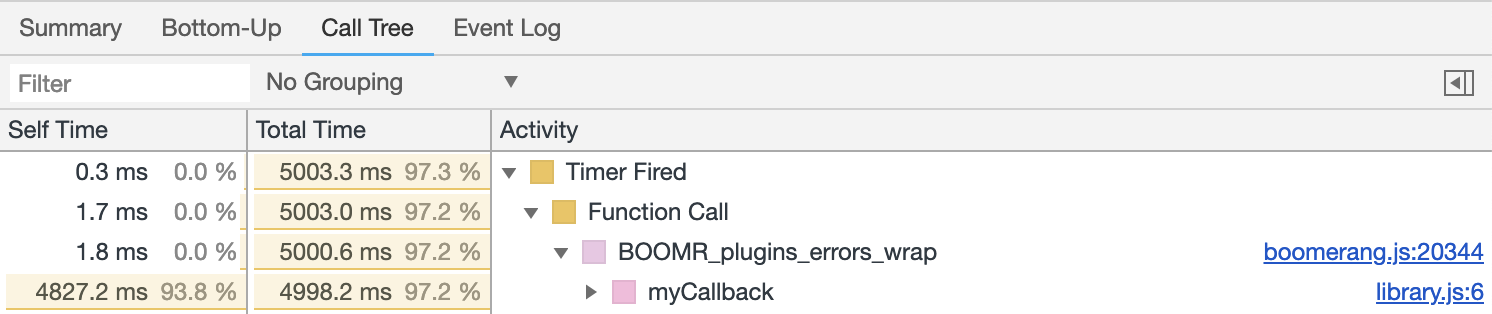
Once you dive into the stack, you can see the original function is causing nearly all of the Self Time:
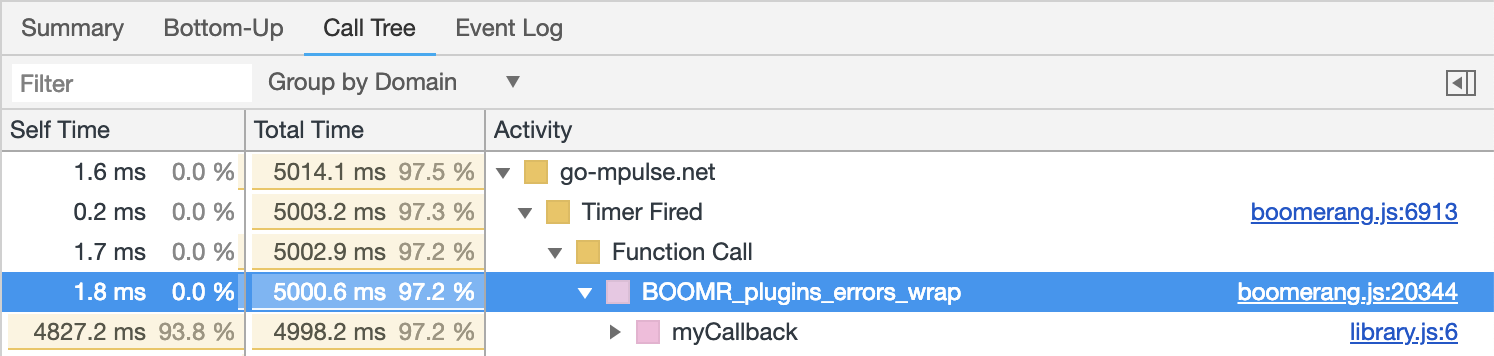
Due to wrapping, Boomerang’s error wrapping functions are being included in the Total Time.
You can confirm that Boomerang is not the cause of the work by disabling wrapping temporarily.
Chrome Lighthouse and Page Speed Insights
Once Boomerang’s JavaScript Error Tracking with wrapping is enabled, Chrome Lighthouse may be confused about JavaScript CPU attribution, due to the same reasons as above.
Lighthouse comes in multiple flavors, but the two most commonly used are as a Chrome browser extension and as part of Page Speed Insights. Both use Chrome under the hood to analyze the performance impact of various components of the page, including JavaScript libraries.
When Boomerang’s wrapping is enabled, the wrapping functions often get incorrectly blamed for work being done in other libraries or the root page itself.
Using the same exaggerated expensive function:
// library.js
function init() {
setTimeout(function myCallback() {
var startTime = Date.now();
while (Date.now() - startTime < 5000) {
// NOP
}
}, 100);
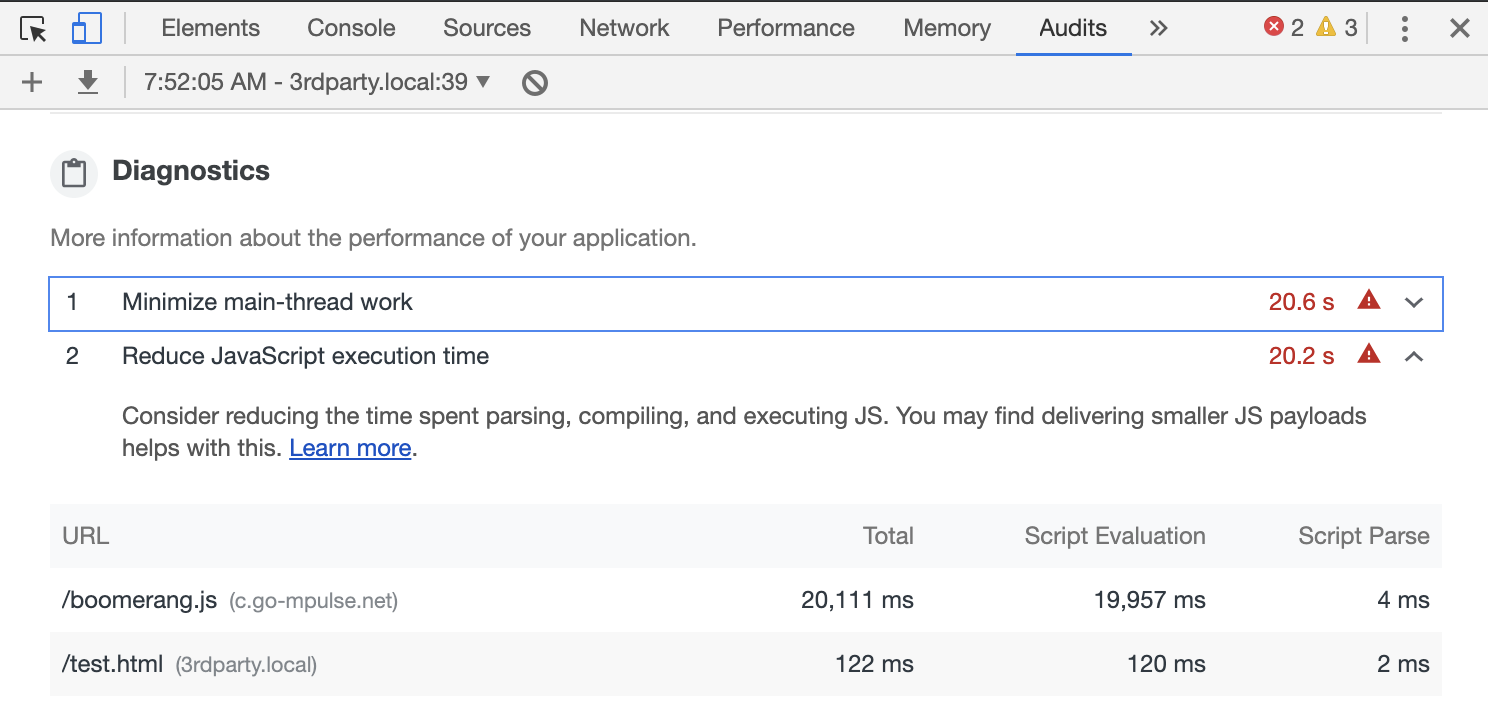
}With Boomerang Error wrapping enabled, when run through Lighthouse’s Chrome extension, we see Lighthouse reporting Boomerang taking 20,111ms (simulated 4x CPUs slowdown):
Once Boomerang’s wrapping was turned off, the attribution was corrected to show the library.js as the real cause of work (20,011 ms) with Boomerang’s CPU usage only at 116ms (simulated 4x CPU slowdown):
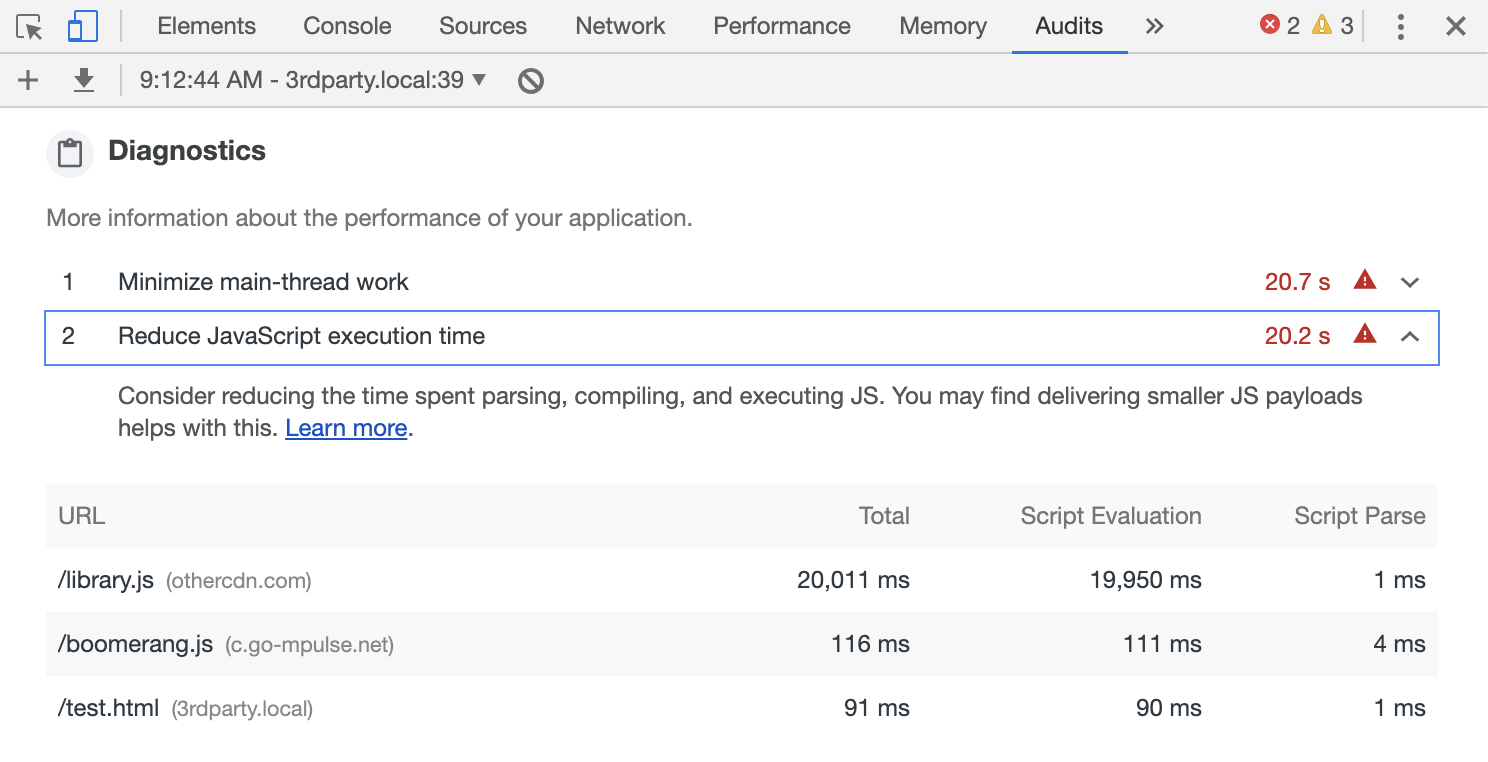
We have opened an issue with Lighthouse to see if the attribution can be better explained.
You can disable wrapping on your local development machine to verify the changes. When using Lighthouse through Page Speed Insights, you may need to disable Boomerang JavaScript Error Tracking entirely via your BOOMR.init() call (open-source Boomerang) or application configuration (Akamai mPulse).
WebPagetest
Once Boomerang’s JavaScript Error Tracking with wrapping is enabled, WebPagetest may be confused about JavaScript CPU attribution, due to the same reasons as above.
When Boomerang’s wrapping is enabled, the wrapping functions often get incorrectly blamed for work being done in other libraries or the root page itself.
Using the same exaggerated expensive function:
// library-5s.js
function init() {
setTimeout(function myCallback() {
var startTime = Date.now();
while (Date.now() - startTime < 5000) {
// NOP
}
}, 100);
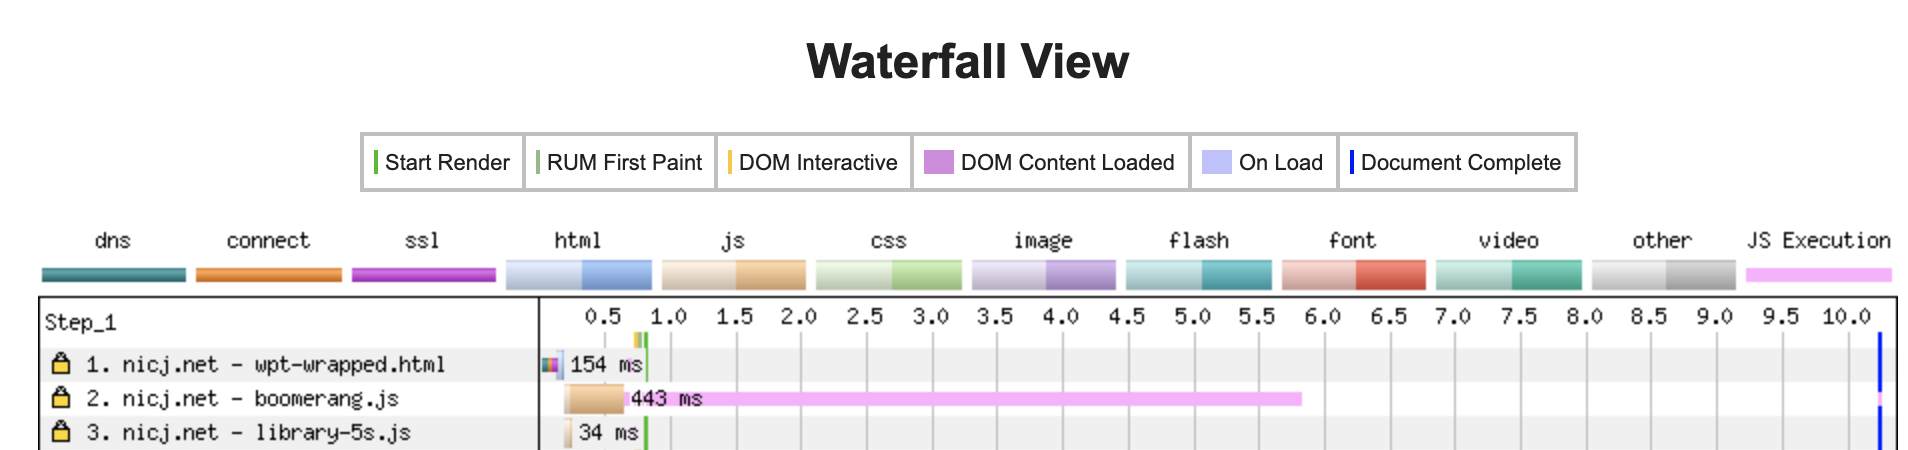
}When run through WebPagetest, we see library-5s.js heavy on the execution for around 5 seconds (according to the pink JS Execution line in the waterfall).
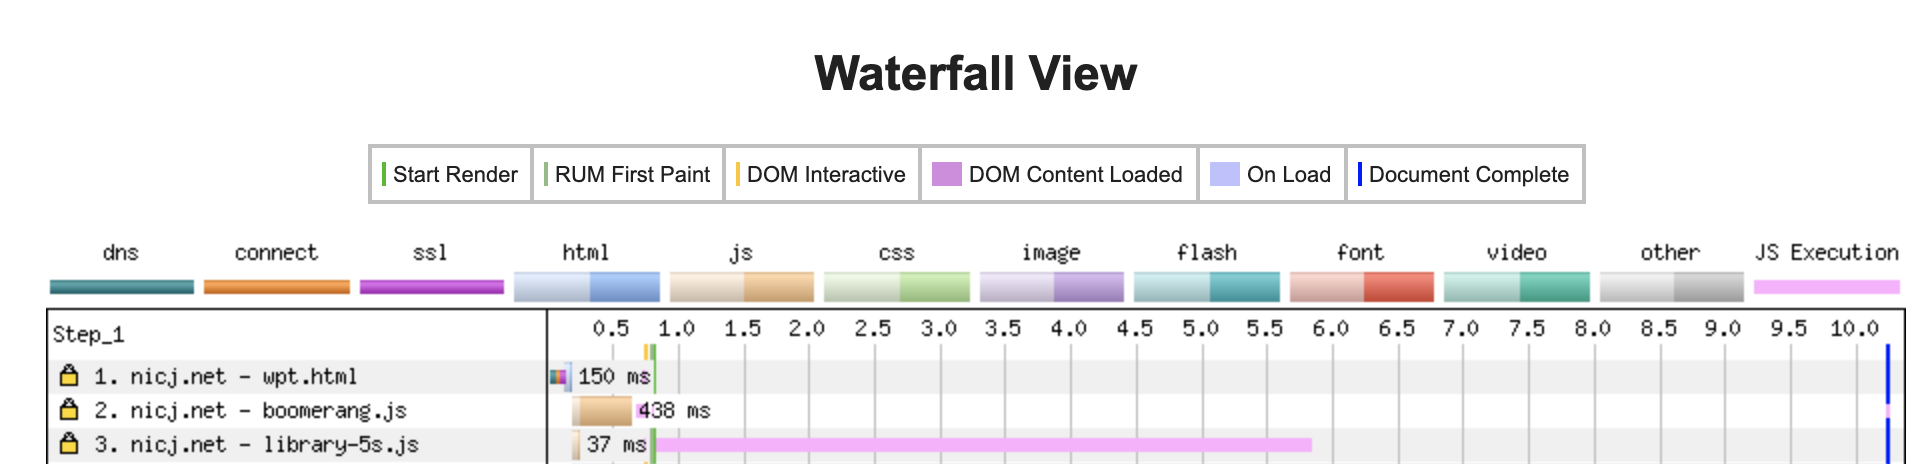
When Boomerang Error wrapping is turned on, we see WebPagetest now blames all of that work on boomerang.js instead of library-5s.js, even though the later is doing the majority of the work:
You can disable wrapping on your local development machine to verify the changes. When using WebPagetest, you may need to disable Boomerang JavaScript Error Tracking entirely via your BOOMR.init() call (open-source Boomerang) or application configuration (Akamai mPulse), or using WebPagetest’s options to disable monitorEvents.
Summary
Boomerang’s Error Tracking plugin is a great way to get telemetry on application health. In order to gather better error messages, Boomerang may wrap top-level functions such as setTimeout(), setInterval() and addEventListener().
Once this happens, developer tools and performance audits such as Chrome Lighthouse, Page Speed Insights or WebPagetest may get confused about the "cause" of JavaScript activity. As a result, it may look like Boomerang is causing errors when the true reason for the error is another library or the page itself. In addition, performance audits may assign more "work" to Boomerang than is accurate, as the work is really happening inside a library or the page itself (that Boomerang had wrapped).
If the wrapping is causing confusion or concern, you can disable wrapping entirely through the Errors plugin.
Is there any way to stop the loading of the Boomerang code even if you do not have access to it? I have the script running in Shopify and it is creating an extra Body tag that is causing issues and I cant find the file or a way to turn it off.
Hi Jason!
Within your Shopify site, you will see a minified version of something like this:
https://akamai.github.io/boomerang/oss/tutorial-loader-snippet.html
To stop the snippet from loading shopify-boomerang-1.0.0.min.js, you may be able to set a flag via JavaScript that will trick the loader snippet to not load the main JavaScript.
For example:
window.BOOMR = { snippetExecuted: true };
However I’m also interested in understanding the issue you’re seeing with the body tag, I’ll reach out offine.