NavigationTiming in Practice
Last updated: May 2021
Table Of Contents
- Introduction
- How was it done before?
2.1. What’s Wrong With This? - Interlude: DOMHighResTimestamp
3.1. Why Not the Date Object? - Accessing NavigationTiming Data
4.1. NavigationTiming Timeline
4.2. Example Data
4.3. How to Use
4.4. NavigationTiming2
4.5. Service Workers - Using NavigationTiming Data
5.1 DIY
5.2 Open-Source
5.3 Commercial Solutions - Availability
- Tips
- Browser Bugs
- Conclusion
- Updates
Introduction
NavigationTiming is a specification developed by the W3C Web Performance working group, with the goal of exposing accurate performance metrics that describe your visitor’s page load experience (via JavaScript).
NavigationTiming (Level 1) is currently a Recommendation, which means that browser vendors are encouraged to implement it, and it has been shipped in all major browsers.
NavigationTiming (Level 2) is a Working Draft and adds additional features like content sizes and other new data. It is still a work-in-progress, but many browsers already support it.
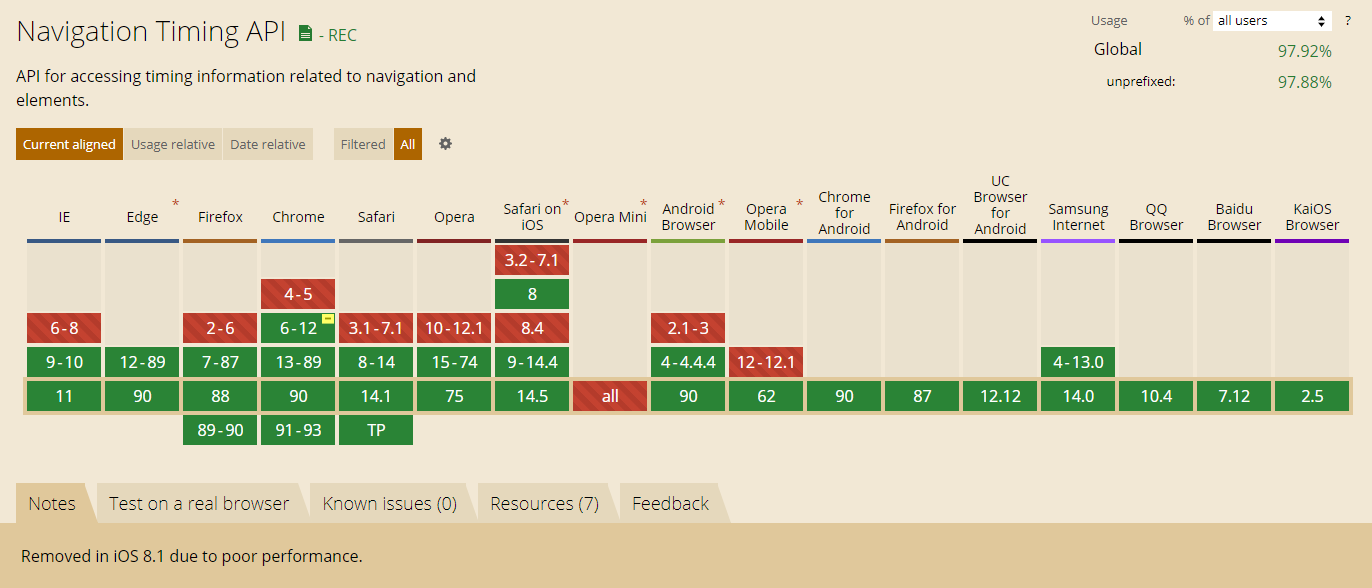
As of May 2021, 97.9% of the world-wide browser market-share supports NavigationTiming (Level 1).
Let’s take a deep-dive into NavigationTiming!
How it was done before?
NavigationTiming exposes performance metrics to JavaScript that were never available in older browsers, such as your page’s network timings and breakdown. Prior to NavigationTiming, you could not measure your page’s DNS, TCP, request or response times because all of those phases occurred before your application (JavaScript) started up, and the browser did not expose them.
Before NavigationTiming was available, you could still estimate some performance metrics, such as how long it took for your page’s static resources to download. To do this, you can hook into the browser’s onload event, which is fired once all of the static resources on your page (such as JavaScript, CSS, IMGs and IFRAMES) have been downloaded.
Here’s sample (though not very accurate) code:
<html><head><script>
var start = new Date().getTime();

function onLoad {
  var pageLoadTime = (new Date().getTime()) - start;
}

body.addEventListener('load', onLoad, false);
</script></head></html>
What’s wrong with this?
First, it only measures the time from when the JavaScript runs to when the last static resource is downloaded.
If that’s all you’re interested in measuring, that’s fine, but there’s a large part of the user’s experience that you’ll be blind to.
Let’s review the main phases that the browser goes through when fetching your HTML:
- DNS resolve: Look up the domain name to find what IP address to connect to
- TCP connect: Connect to your server on port 80 (HTTP) or 443 (HTTPS) via TCP
- Request: Send a HTTP request, with headers and cookies
- Response: Wait for the server to start sending the content (back-end time)
It’s only after Phase 4 (Response) is complete that your HTML is parsed and your JavaScript can run.
Phase 1-4 timings will vary depending on the network. One visitor might fetch your content in 100 ms while it might take another user, on a slower connection, 5,000 ms before they see your content. That delay translates into a painful user-experience.
Thus if you’re only monitoring your application from JavaScript in the <HEAD> to the onload (as in the snippet above), you are blind to a large part of the overall experience.
So the primitive approach above has several downsides:
- It only measures the time from when the JavaScript runs to when the last static resource is downloaded
- It misses the initial DNS lookup, TCP connection and HTTP request phases
Date().getTime()is not reliable
Interlude – DOMHighResTimeStamp
What about #3? Why is Date.getTime() (or Date.now() or +(new Date)) not reliable?
Let’s talk about another modern browser feature, DOMHighResTimeStamp, aka performance.now().
DOMHighResTimeStamp is a new data type for performance interfaces. In JavaScript, it’s typed as a regular number primitive, but anything that exposes a DOMHighResTimeStamp is following several conventions.
Notably, DOMHighResTimeStamp is a monotonically non-decreasing timestamp with an epoch of performance.timeOrigin and sub-millisecond resolution. It is used by several W3C webperf performance specs, and can always be queried via window.performance.now();
Why not just use the Date object?
DOMHighResTimeStamp helps solve three shortcomings of Date. Let’s break its definition down:
- monotonically non-decreasing means that every time you fetch a
DOMHighResTimeStamp, its’ value will always be at least the same as when you accessed it last. It will never decrease. - timestamp with an epoch of
performance.timeOriginmeans it’s value is a timestamp, whose basis (start) iswindow.performance.timeOrigin. Thus aDOMHighResTimeStampof10means it’s 10 milliseconds after time time given byperformance.timeOrigin - sub-millisecond resolution means the value has the resolution of at least a millisecond. In practice,
DOMHighResTimeStamps will be anumberwith the milliseconds as whole-numbers and fractions of a millisecond represented after the decimal. For example,1.5means 1500 microseconds, while100.123means 100 milliseconds and 123 microseconds.
Each of these points addresses a shortcoming of the Date object. First and foremost, monotonically non-decreasing fixes a subtle issue with the Date object that you may not know exists. The problem is that Date simply exposes the value of your end-user’s clock, according to the operating system. While the majority of the time this is OK, the system clock can be influenced by outside events, even in the middle of when your app is running.
For example, when the user changes their clock, or an atomic clock service adjusts it, or daylight-savings kicks in, the system clock may jump forward, or even go backwards!
So imagine you’re performance-profiling your application by keeping track of the start and end timestamps of some event via the Date object. You track the start time… and then your end-users atomic clock kicks in and adjusts the time forward an hour… and now, from JavaScript Date‘s point of view, it seems like your application just took an hour to do a simple task.
This can even lead to problems when doing statistical analysis of your performance data. Imagine if your monitoring tool is taking the mean value of operational times and one of your users’ clocks jumped forward 10 years. That outlier, while "true" from the point of view of Date, will skew the rest of your data significantly.
DOMHighResTimeStamp addresses this issue by guaranteeing it is monotonically non-decreasing. Every time you access performance.now(), you are guaranteed it will be at least equal to, if not greater than, the last time you accessed it.
You should’t mix Date timestamps (which are Unix epoch based, so you get sample times like 1430700428519) with DOMHighResTimeStamps. If the user’s clock changes, and you mix both Date and DOMHighResTimeStamps, the former could be wildly different from the later.
To help enforce this, DOMHighResTimeStamp is not Unix epoch based. Instead, its epoch is window.performance.timeOrigin (more details of which are below). Since it has sub-millisecond resolution, this means that the values that you get from it are the number of milliseconds since the page load started. As a benefit, this makes them easier to read than Date timestamps, since they’re relatively small and you don’t need to do (now - startTime) math to know when something started running.
DOMHighResTimeStamp is available in most modern browsers, including Internet Explorer 10+, Edge, Firefox 15+, Chrome 20+, Safari 8+ and Android 4.4+. If you want to be able to always get timestamps via window.performance.now(), you can use a polyfill. Note these polyfills will be millisecond-resolution timestamps with a epoch of "something" in unsupported browsers, since monotonically non-decreasing can’t be guaranteed and sub-millisecond isn’t available unless the browser supports it.
As a summary:
| Date | DOMHighResTimeStamp | |
|---|---|---|
| Accessed via | Date().getTime() | performance.now() |
| Resolution | millisecond | sub-millisecond |
| Start | Unix epoch | performance.timeOrigin |
| Monotonically Non-decreasing | No | Yes |
| Affected by user’s clock | Yes | No |
| Example | 1420147524606 | 3392.275999998674 |
Accessing NavigationTiming Data
So, how do you access NavigationTiming data?
The simplest (and now deprecated) method is that all of the performance metrics from NavigationTiming are available underneath the window.performance DOM object. See the NavigationTiming2 section for a more modern way of accessing this data.
NavigationTiming’s metrics are primarily available underneath window.performance.navigation and window.performance.timing. The former provides performance characteristics (such as the type of navigation, or the number of redirects taken to get to the current page) while the latter exposes performance metrics (timestamps).
Here’s the WebIDL (definition) of the Level 1 interfaces (see the NavigationTiming2 section below for details on accessing the new data)
window.performance.navigation:
interface PerformanceNavigation {
  const unsigned short TYPE_NAVIGATE = 0;
  const unsigned short TYPE_RELOAD = 1;
  const unsigned short TYPE_BACK_FORWARD = 2;
  const unsigned short TYPE_RESERVED = 255;
  readonly attribute unsigned short type;
  readonly attribute unsigned short redirectCount;
};interface PerformanceTiming {
readonly attribute unsigned long long navigationStart;
readonly attribute unsigned long long unloadEventStart;
readonly attribute unsigned long long unloadEventEnd;
readonly attribute unsigned long long redirectStart;
readonly attribute unsigned long long redirectEnd;
readonly attribute unsigned long long fetchStart;
readonly attribute unsigned long long domainLookupStart;
readonly attribute unsigned long long domainLookupEnd;
readonly attribute unsigned long long connectStart;
readonly attribute unsigned long long connectEnd;
readonly attribute unsigned long long secureConnectionStart;
readonly attribute unsigned long long requestStart;
readonly attribute unsigned long long responseStart;
readonly attribute unsigned long long responseEnd;
readonly attribute unsigned long long domLoading;
readonly attribute unsigned long long domInteractive;
readonly attribute unsigned long long domContentLoadedEventStart;
readonly attribute unsigned long long domContentLoadedEventEnd;
readonly attribute unsigned long long domComplete;
readonly attribute unsigned long long loadEventStart;
readonly attribute unsigned long long loadEventEnd;
};The NavigationTiming Timeline
Each of the timestamps above corresponds with events in the timeline below:

Note that each of the timestamps are Unix epoch-based, instead of being performance.timeOrigin-based like DOMHighResTimeStamps. This has been addressed in NavigationTiming2.
The entire process starts at timing.navigationStart (which should be the same as performance.timeOrigin). This is when your end-user started the navigation. They might have clicked on a link, or hit reload in your browser. The navigation.type property tells you what type of page-load it was: a regular navigation (link- or bookmark- click) (TYPE_NAVIGATE = 0), a reload (TYPE_RELOAD = 1), or a back-forward navigation (TYPE_BACK_FORWARD = 2). Each of these types of navigations will have different performance characteristics.
Around this time, the browser will also start to unload the previous page. If the previous page is the same origin (domain) as the current page, the timestamps of that document’s onunload event (start and end) will be filled in as timing.unloadEventStart and timing.unloadEventEnd. If the previous page was on another origin (or there was no previous page), these timestamps will be 0.
Next, in some cases, your site may go through one or more HTTP redirects before it reaches the final destination. navigation.redirectCount gives you an important insight into how many hops it took for your visitor to reach your page. 301 and 302 redirects each take time, so for performance reasons you should reduce the number of redirects to reach your content to 0 or 1. Unfortunately, due to security concerns, you do not have access to the actual URLs that redirected to this page, and it is entirely possibly that a third-party site (not under your control) initiated the redirect. The difference between timing.redirectStart and timing.redirectEnd encompasses all of the redirects. If these values are 0, it means that either there were no redirects, or at least one of the redirects was from a different origin.
fetchStart is the next timestamp, and indicates the timestamp for the start of the fetch of the current page. If there were no redirects when loading the current page, this value should equal navigationStart. Otherwise, it should equal redirectEnd.
Next, the browser goes through the networking phases required to fetch HTML over HTTP. First the domain is resolved (domainLookupStart and domainLookupEnd), then a TCP connection is initiated (connectStart and connectEnd). Once connected, a HTTP request (with headers and cookies) is sent (requestStart). Once data starts coming back from the server, responseStart is filled, and is ended when the last byte from the server is read at responseEnd.
Note that the only phase without an end timestamp is requestEnd, as the browser does not have insight into when the server received the response.
Any of the above phases (DNS, TCP, request or response) might not take any time, such as when DNS was already resolved, a TCP connection is re-used or when content is served from disk. In this case, the timestamps should not be 0, but should reflect the timestamp that the phase started and ended, even if the duration is 0. For example, if fetchStart is at 1000 and a TCP connection is reused, domainLookupStart, domainLookupEnd, connectStart and connectEnd should all be 1000 as well.
secureConnectionStart is an optional timestamp that is only filled in if it the page was loaded over a secure connection. In that case, it represents the time that the SSL/TLS handshake started.
After responseStart, there are several timestamps that represent phases of the DOM’s lifecycle. These are domLoading, domInteractive, domContentLoadedEventStart, domContentLoadedEventEnd and domComplete.
domLoading, domInteractive and domComplete correspond to when the Document’s readyState are set to the corresponding loading, interactive and complete states.
domContentLoadedEventStart and domContentLoadedEventEnd correspond to when the DOMContentLoaded event fires on the document and when it has completed running.
Finally, once the body’s onload event fires, loadEventStart is filled in. Once all of the onload handlers are complete, loadEventEnd is filled in. Note this means if you’re querying window.performance.timing from within the onload event, loadEventEnd will be 0. You could work around this by querying the timestamps from a setTimeout(..., 10) fired from within the onload event, as in the code example below.
Note: There is a bug in some browsers where they are reporting 0 for some timestamps. This is a bug, as all same-origin timestamps should be filled in, but if you’re consuming this data, you may have to adjust for this.
Browser vendors are also free to ad their own additional timestamps to window.performance.timing. Here is the only currently known vendor-prefixed timestamp available:
msFirstPaint– Internet Explorer 9+ only, this event corresponds to when the first paint occurred within the document. It makes no guarantee about what content was painted — in fact, the paint could be just the "white out" prior to other content being displayed. Do not rely on this event to determine when the user started seeing actual content.
Example data
Here’s sample data from a page load:
// window.performance.navigation
redirectCount: 0
type: 0

// window.performance.timing
navigationStart: 1432762408327,
unloadEventEnd: 0,
unloadEventStart: 0,
redirectStart: 0,
redirectEnd: 0,
fetchStart: 1432762408648,
connectEnd: 1432762408886,
secureConnectionStart: 1432762408777,
connectStart: 1432762408688,
domainLookupStart: 1432762408660,
domainLookupEnd: 1432762408688,
requestStart: 1432762408886,
responseStart: 1432762409141,
responseEnd: 1432762409229,
domComplete: 1432762411136,
domLoading: 1432762409147,
domInteractive: 1432762410129,
domInteractive: 1432762410129,
domContentLoadedEventStart: 1432762410164,
domContentLoadedEventEnd: 1432762410263,
loadEventEnd: 1432762411140,
loadEventStart: 1432762411136
How to Use
All of the metrics exposed on the window.performance interface are available to your application via JavaScript. Here’s example code for gathering durations of the different phases of the main page load experience:
function onLoad() {
  if ('performance' in window && 'timing' in window.performance) {
    // gather after all other onload handlers have fired
    setTimeout(function() {
      var t = window.performance.timing;
      var ntData = {
        redirect: t.redirectEnd - t.redirectStart,
        dns: t.domainLookupEnd - t.domainLookupStart,
        connect: t.connectEnd - t.connectStart,
        ssl: t.secureConnectionStart ? (t.connectEnd - secureConnectionStart) : 0,
        request: t.responseStart - t.requestStart,
        response: t.responseEnd - t.responseStart,
        dom: t.loadEventStart - t.responseEnd,
        total: t.loadEventEnd - t.navigationStart
      };
    }, 0);
  }
}
NavigationTiming2
Currently a Working Draft, NavigationTiming (Level 2) builds on top of NavigationTiming:
- Now based on Resource Timing Level 2
- Support for the Performance Timeline and via a
PerformanceObserver - Support for High Resolution Time
- Adds the next hop protocol
- Adds transfer and content sizes
- Adds ServerTiming
- Add ServiceWorker information
The Level 1 interface, window.performance.timing, will not been changed for Level 2. Level 2 features are not being added to that interface, primarily because the timestamps under window.performance.timing are not DOMHighResTimeStamp timestamps (such as 100.123), but Unix-epoch timestamps (e.g. 1420147524606).
Instead, there’s a new navigation type available from the PerformanceTimeline that contains all of the Level 2 data.
Here’s an example of how to get the new NavigationTiming data:
if ('performance' in window &&
    window.performance &&
    typeof window.performance.getEntriesByType === 'function') {
    var ntData = window.performance.getEntriesByType("navigation")[0];
}
Example data:
 {
    "name": "https://website.com/",
    "entryType": "navigation",
    "startTime": 0,
    "duration": 1568.5999999986961,
    "initiatorType": "navigation",
    "nextHopProtocol": "h2",
    "workerStart": 0,
    "redirectStart": 0,
    "redirectEnd": 0,
    "fetchStart": 3.600000054575503,
    "domainLookupStart": 3.600000054575503,
    "domainLookupEnd": 3.600000054575503,
    "connectStart": 3.600000054575503,
    "connectEnd": 3.600000054575503,
    "secureConnectionStart": 0,
    "requestStart": 9.700000053271651,
    "responseStart": 188.50000004749745,
    "responseEnd": 194.2999999737367,
    "transferSize": 7534,
    "encodedBodySize": 7287,
    "decodedBodySize": 32989,
    "serverTiming": [],
    "unloadEventStart": 194.90000000223517,
    "unloadEventEnd": 195.10000001173466,
    "domInteractive": 423.9999999990687,
    "domContentLoadedEventStart": 423.9999999990687,
    "domContentLoadedEventEnd": 520.9000000031665,
    "domComplete": 1562.900000018999,
    "loadEventStart": 1562.900000018999,
    "loadEventEnd": 1568.5999999986961,
    "type": "navigate",
    "redirectCount": 0
}
As you can see, all of the fields from NavigationTiming Level 1 are there (except domLoading which was removed), but they’re all DOMHighResTimeStamp timestamps now.
In addition, there are new Level 2 fields:
nextHopProtocol: ALPN Protocol ID such ashttp/0.9http/1.0http/1.1h2hqspdy/3(ResourceTiming Level 2)workerStartis the time immediately before the active Service Worker received thefetchevent, if a ServiceWorker is installedtransferSize: Bytes transferred for the HTTP response header and content bodydecodedBodySize: Size of the body after removing any applied content-codingsencodedBodySize: Size of the body after prior to removing any applied content-codingsserverTiming: ServerTiming data
Service Workers
While NavigationTiming2 added a timestamp for workerStart, if you have a Service Worker active for your domain, there are some caveats to be aware of:
workerStartis not yet part of the timeline diagram above, and it’s exact meaning is still under discussion- The size attributes (
transferSizedecodedBodySizeencodedBodySize) are under-specified, and may be0if the root HTML was delivered by the Service Worker - The
workerStarttimestamp may not be reliable if there were any redirects during the navigation
Using NavigationTiming Data
With access to all of this performance data, you are free to do with it whatever you want. You could analyze it on the client, notifying you when there are problems. You could send 100% of the data to your back-end analytics server for later analysis. Or, you could hook the data into a DIY or commercial RUM solution that does this for you automatically.
Let’s explore all of these options:
DIY
There are many DIY / Open Source solutions out there that gather and analyze data exposed by NavigationTiming.
Here are some DIY ideas for what you can do with NavigationTiming:
- Gather the
performance.timingmetrics on your own and alert you if they are over a certain threshold (warning: this could be noisy) - Gather the
performance.timingmetrics on your own and XHR every page-load’s metrics to your backend for analysis - Watch for any pages that resulted in one or more redirects via
performance.navigation.redirectCount - Determine what percent of users go back-and-forth on your site via
performance.navigation.type - Accurately monitor your app’s bootstrap time that runs in the body’s
onloadevent via(loadEventEnd - loadEventStart) - Monitor the performance of your DNS servers
- Measure DOM event timestamps without adding event listeners
Open-Source
There are some great projects out there that consume NavigationTiming information.
Boomerang, an open-source library developed by Philip Tellis, had a method for tracking performance metrics before NavigationTiming was supported in modern browsers. Today, it incorporates NavigationTiming data if available. It does all of the hard work of gathering various performance metrics, and lets you beacon (send) the data to a server of your choosing. (I am a contributor to the project).
To compliment Boomerang, there are a couple open-source servers that receive Boomerang data, such as Boomcatch and BoomerangExpress. In both cases, you’ll still be left to analyze the data on your own:
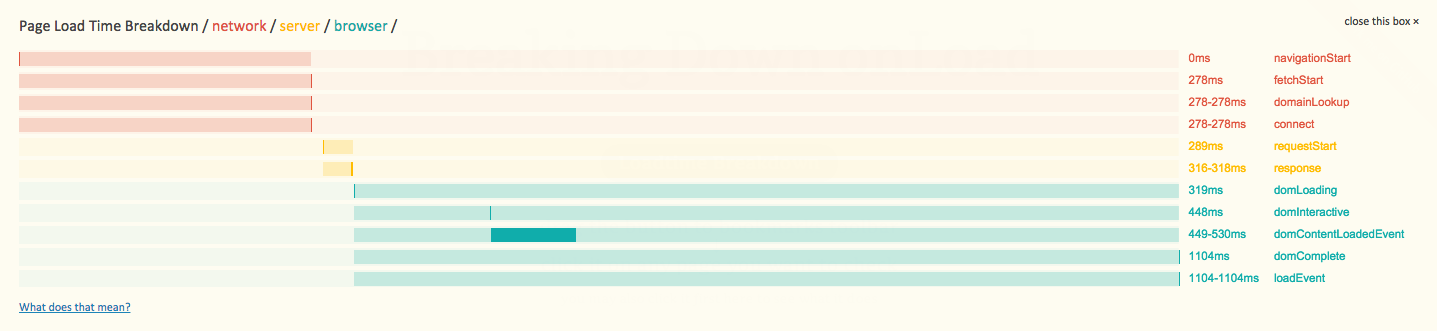
To view NavigationTiming data for any site you visit, you can use this kaaes bookmarklet:
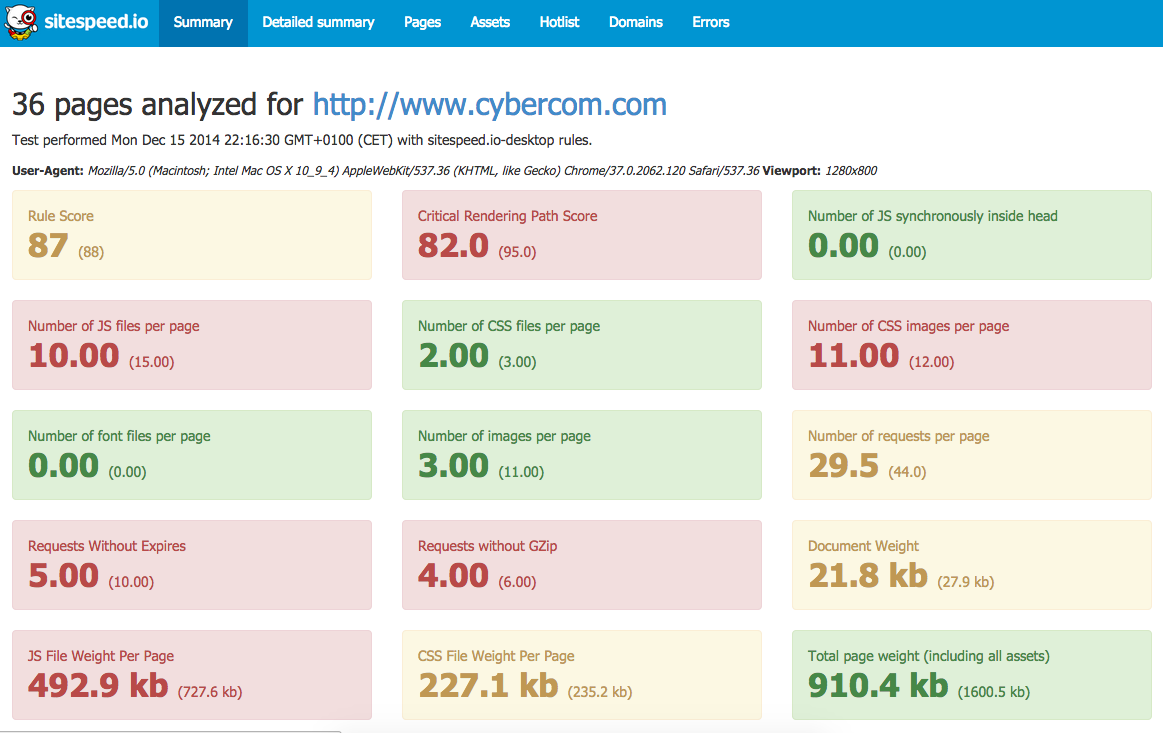
SiteSpeed.io helps you track your site’s performance metrics and scores (such as PageSpeed and YSlow):
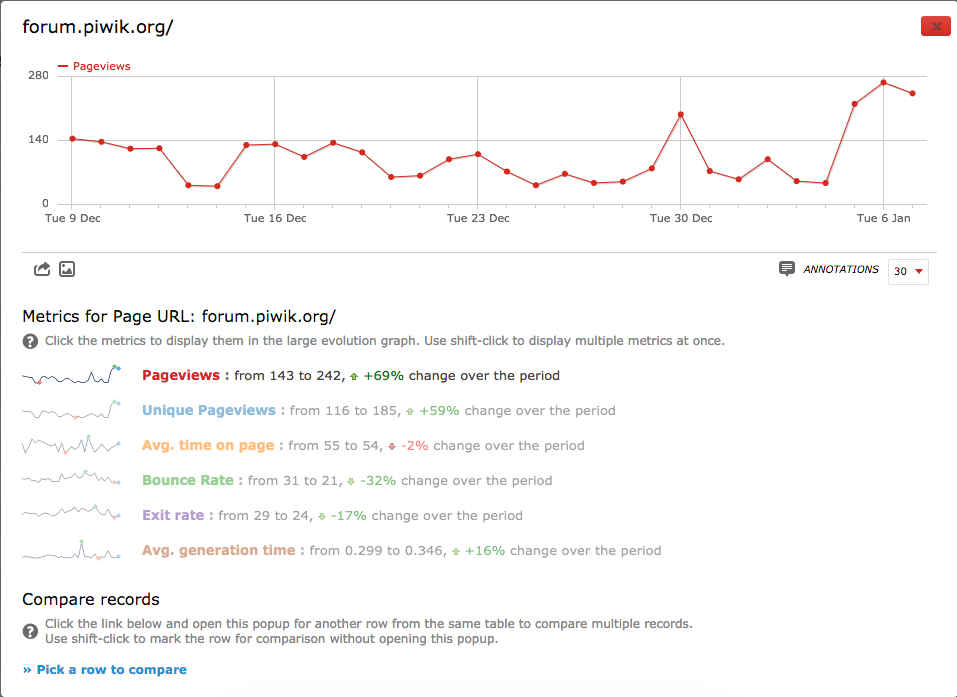
Finally, if you’re already using Piwik, there’s a plugin that gathers NavigationTiming data from your visitors:
"generation time" = responseEnd - requestStart
Commercial Solutions
If you don’t want to build or manage a DIY / Open-Source solution to gather RUM metrics, there are many great commercial services available.
Disclaimer: I work at Akamai, on mPulse and Boomerang
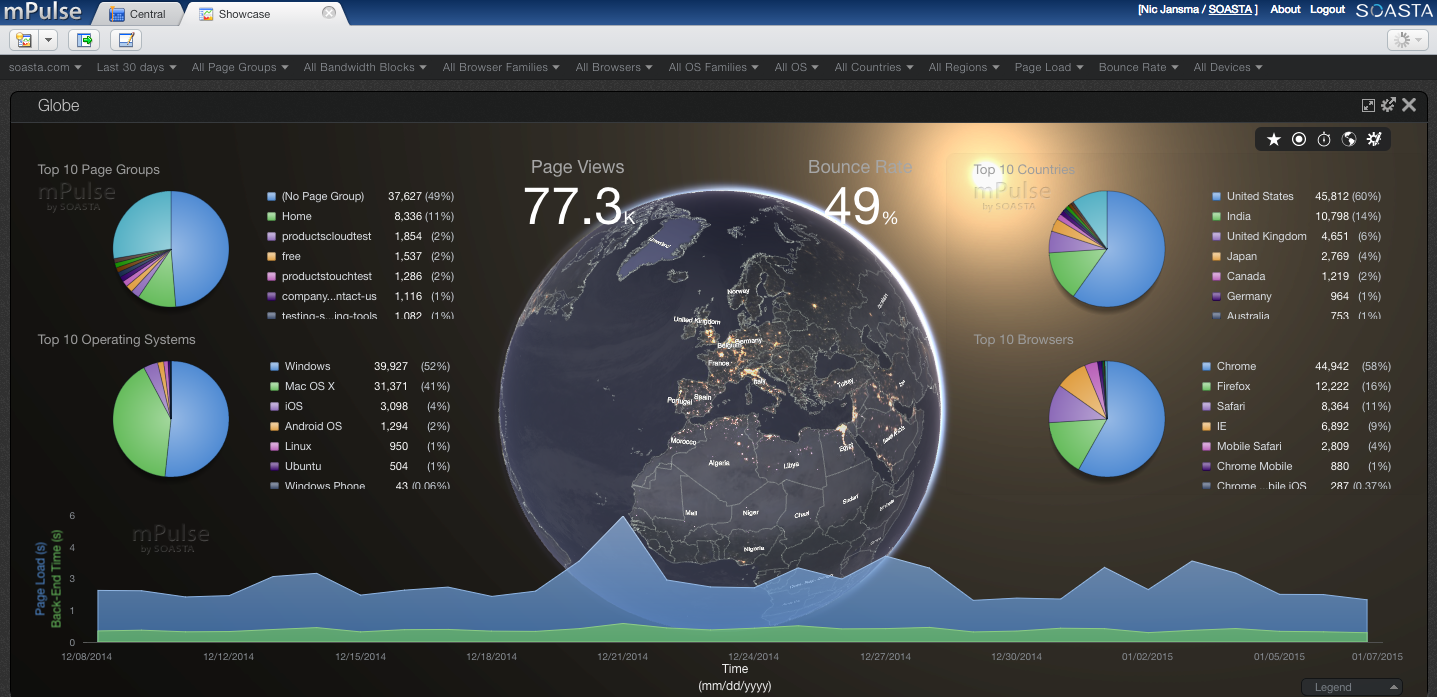
Akamai mPulse, which gathers 100% of your visitor’s performance data:
There may be others as well — please leave a comment if you have experience using another service.
Availability
NavigationTiming is available in all modern browsers. According to caniuse.com 97.9% of world-wide browser market share supports NavigationTiming, as of May 2021. This includes Internet Explore 9+, Edge, Firefox 7+, Chrome 6+, Opera 15+, Android Browser 4+, Mac Safari 8+ and iOS Safari 9+.
Tips
Some final tips to re-iterate if you want to use NavigationTiming data:
- Use
fetchStartinstead ofnavigationStart, unless you’re interested in redirects, browser tab initialization time, etc. loadEventEndwill be0until after the body’sonloadevent has finished (so you can’t measure it in theloadevent itself).- We don’t have an accurate way to measure the "request time", as
requestEndis invisible to us (the server sees it). secureConnectionStartisn’t available in Internet Explorer, and will be0in other browsers unless on a HTTPS link.- If your site is the home-page for a user, you may see some
0timestamps. Timestamps up through theresponseEndevent may be0duration because some browsers speculatively pre-fetch home pages (and don’t report the correct timings). - If you’re going to be beaconing data to your back-end for analysis, if possible, send the data immediately after the body’s
onloadevent versus waiting foronbeforeunload.onbeforeunloadisn’t 100% reliable, and may not fire in some browsers (such as iOS Safari). - Single-Page Apps: You’ll need a different solution for "soft" or "in-page" navigations (Boomerang has SPA support).
Browser Bugs
NavigationTiming data may not be perfect, and in some cases, incorrect due to browser bugs. Make sure to validate your data before you use it.
We’ve seen the following problems in the wild:
- Safari 8/9:
requestStartandresponseStartmight be less thannavigationStartandfetchStart - Safari 8/9 and Chrome (as recent as 56):
requestStartandresponseStartmight be less thanfetchStart,connect*anddomainLookup* - Chrome (as recent as 56):
requestStartis equal tonavigationStartbut less thanfetchStart,connect*anddomainLookup* - Firefox: Reporting
0for timestamps that should always be filled in, such asdomainLookup*,connect*andrequestStart. - Chrome: Some timestamps are double what they should be (e.g. if "now" is
1524102861420, we see timestamps around3048205722840, year 2066) - Chrome: When the page has redirects, the
responseStartis less thanredirectEndandfetchStart - Firefox: The NavigationTiming of the iframe (window.frames[0].performance.timing) does not include redirect counts or redirect times, and many other timestamps are
0
If you’re analyzing NavigationTiming data, you should ensure that all timestamps increment according to the timeline. If not, you should probably question all of the timestamps and discard.
Some known bug reports:
- Chrome: performance.timing.requestStart before performance.timing.navigationStart
- Safari: requestStart, responseStart before navigationStart
- Safari: navigationStart and DOM timings in Unix epoch, other timings 0-based for Back-Forward navigations
Conclusion
NavigationTiming exposes valuable and accurate performance metrics in modern browsers. If you’re interested in measuring and monitoring the performance of your web app, NavigationTiming data is the first place you should look.
Next up: Interested in capturing the same network timings for all of the sub-resources on your page, such as images, JavaScript, and CSS? ResourceTiming is what you want.
Other articles in this series:
More resources:
- NavigationTiming W3C specification
- NavigationTiming2 W3C specification
DOMHighResTimeStampW3C specification
Updates
- 2018-04:
- Updated caniuse.com market share
- Updated NavigationTiming2 information, usage, fields
- Added more browser bugs that we’ve found
- 2021-05:
- Updated caniuse.com market share
- Added a Service Workers section
- Replaced usage of
performance.timing.navigationStartas a time origin withperformance.timeOrigin - Minor grammar updates
- Added a Table of Contents