Search Results

Keyword: ‘tail’

Beaconing In Practice: fetchLater()

July 25th, 2024

Table of Contents

  1. Introduction
  2. fetchLater API
  3. Why Deferred Fetches
  4. Evolution from Pending Beacon
  5. What I Got Wrong Last Time
  6. fetchLater Experiments
    1. Methodology
    2. Reliability of XMLHttpRequest vs. sendBeacon() vs. fetchLater Beacon in Event Handlers
      1. onload
      2. pagehide or visibilitychange
      3. onload or pagehide or visibilitychange
      4. Conclusion
    3. Reliability of fetchLater() using activateAfter
  7. Follow-Ups
  8. How We’re Going to Use it
  9. TL;DR

Introduction

This is a follow-up to the post Beaconing in Practice: An Update on Reliability and the Pending Beacon API, which itself is a follow-up to an article titled Beaconing In Practice. These articles cover all aspects of sending telemetry from your web app to a back-end server for analysis (aka "beaconing").

In the past year, the Pending Beacon API has evolved like a Pokémon and is now called the fetchLater() API. I think the new API shape is more ergonomic, more reliable, and a good step forward.

In this article, I will review the updated API and see how it stacks up to its predecessor, the Pending Beacon API, as well as the standard way of beaconing on the web via XMLHttpRequest (XHR) and sendBeacon(). Some of the content of this article will look similar to the last one, with some additional content for how the API has evolved, and newer findings from experimentation.

A summary of where we left off last time:

  • The Pending Beacon API was showing great promise, giving developers better ergonomics for sending data, and a more reliable way to send beacons at the end of the page lifetime
  • There were a few scenarios that Pending Beacon seemed less reliable than using sendBeacon():
    • During onload Pending Beacon (with timeout:0) was about 1.2% less reliable than sendBeacon()
    • During pagehide and visibilitychange Pending Beacon (with timeout:0), on Mobile, was about 17.9% less reliable than sendBeacon()
    • After reviewing my methodology with Chrome engineers, they pointed out I had forgotten to use .sendNow() in scenarios that it should be used; details on that suggestion below.
  • Pending Beacon requests were hard to debug due to the beacons not showing up in Chrome Developer Tools.
    • Since the API is now fetch()-based, this has been resolved and they now show up. Great!

fetchLater() API

The fetchLater() API is an evolution of the Pending Beacon API (based on feedback from the community and the other browser vendors), and it aims to allow developers to send a "deferred" fetch().

Why would you want to defer your fetches? A primary use-case is for beaconing data from a web app for analysis/analytics purposes. Deferred fetches can be useful when exfiltrating telemetry, i.e. when that beacon contains a payload that is not required for building the webpage or presenting anything to the visitor.

The goal of fetchLater() is to provide an API to developers where they can "queue" data to be sent at a later date — either after a timeout, or, at the point the page is about to be unloaded.

This helps developers avoid having to explicitly send beacons themselves in events like pagehide or visibilitychange (which don’t always fire reliably).

The API looks similar to a regular fetch(), which developers should be familiar with.

Here’s an example of using the fetchLater() API to send a beacon when the page is being unloaded (or a maximum of 60 seconds after "now"):

// queue a beacon for the unloading or +60s
fetchLater(beaconUrl, {
  activateAfter: 60000
});

The API is still being discussed, and is actively evolving based on community and browser vendor feedback.

If you want to experiment with fetchLater() in Chrome today, you can register for an Origin Trial for Chrome 121-126.

Why Deferred Fetches?

One of the challenges highlighted in the Beaconing In Practice article is how to reliably send data once it’s been gathered in a web app.

Developers frequently use events such as beforeunload/unload or pagehide/visibilitychange as a trigger for beaconing their data, but these events are not reliably fired on all platforms. If the events don’t fire, the beacons don’t get sent.

For example, if you want to gather all of your data and only send it once as the page is unloading, registering for all 4 of those events will only give you ~82.9% reliability in ensuring the data arrives at your server, even when using the sendBeacon() API.

So, wouldn’t it be lovely if developers had a more reliable way of "queuing" data to be sent, and have the browser automagically send it once the page starts to unload? That’s where fetchLater() comes in.

The fetchLater() API gives developers a way to build a "deferred" beacon. That deferred beacon will then be sent at the timeout, or, as the page is unloading. It can also be aborted before then, if desired. As a result, developers no longer need to listen to the beforeunload/unload/pagehide/visibilitychange events to send data.

Ideally, fetchLater() will be a mechanism that can replace usage of sendBeacon() in browsers that support it, giving more reliable delivery of beacon data and better developer ergonomics (by not having to listen for, and send data during, unload-ish events).

Evolution from Pending Beacon

fetchLater() evolved from the Pending Beacon API, based on feedback from other browser vendors and the web performance community.

Pending Beacon was a brand new API that allowed you to configure a few timeouts, send/update the payload, and force the beacon out immediately:

var pb = new window.PendingGetBeacon(beaconUrl, {
    timeout: 0,
    backgroundTimeout: -1
});
pb.setData(1);
pb.sendNow();
// or
pb.deactivate();

Rather than creating an entirely new PendingGetBeacon() interface, fetchLater() is merely a mirror of fetch() with one additional optional parameter (activateAfter). The deferred fetch can still be aborted (via an AbortController) like a normal fetch().

fetchLater(beaconUrl, {
    activateAfter: 0
});

// can't be updated, but you can use an AbortController to create a new one
// no need for .sendNow()
// can be deactivated with an AbortController

One other difference with PendingBeacon was that it had a backgroundTimeout option, which would send a beacon after the specified number of milliseconds when the page entered the next hidden visibility state (or was abandoned):

var pb = new window.PendingGetBeacon(beaconUrl, {
    backgroundTimeout: 1000
});

This behavior is not available in fetchLater(), though you could replicate it manually:

fetchLater(beaconUrl);

document.addEventListener("visibilitychange", () => {
  if (document.hidden) {
    setTimeout(function() {
      if (document.hidden) {
        fetchLater(beaconUrl);
      }
    }, 1000);
  }
});

This feels more straightforward to use, and avoids one of the traps I fell into when experimenting with Pending Beacon last time (see next section).

What I Got Wrong Last Time

When I was experimenting with Pending Beacon last year, there were two big issues I found with regards to reliability:

  • During onload Pending Beacon (with timeout:0) was about 1.2% less reliable than sendBeacon()
  • During pagehide and visibilitychange Pending Beacon (with timeout:0), on Mobile, was about 17.9% less reliable than sendBeacon()

Both of these scenarios utilized Pending Beacon with a { timeout: 0 } option, meaning I was asking the browser to send the beacon right away.

Here’s example code for what it looked like:

new window.PendingGetBeacon(beaconUrl, {
    timeout: 0,
    backgroundTimeout: -1
});

What I missed, however, was that the Pending Beacon interface had a method .sendNow() that would tell the browser to actually send it immediately.

Here’s what I should have done:

let b = new window.PendingGetBeacon(beaconUrl, {
    timeout: 0,
    backgroundTimeout: -1
});
b.sendNow(); // <-- forgot to do this last time

In talking with the Chrome engineers, we think that excluding the .sendNow() may have caused the drop in reliability — timeout: 0 alone wasn’t enough to force the beacon to send right away.

This was especially important in the page-is-unloading scenario (in pagehide and visibilitychange listeners) as not forcing with .sendNow() meant the browser didn’t prioritize sending the payload prior to exiting the page/app.

fetchLater() Experiments

Given those goals, I was curious to see how reliable fetchLater() would be compared to existing APIs like XMLHttpRequest (XHRs) or the sendBeacon() API. I performed several experiments comparing how reliably data arrived after using one of those APIs in different scenarios.

Let’s explore these questions:

  1. Can we swap fetchLater() in for usage of XHR and/or sendBeacon() in unload event handlers?
  2. How reliable is using only fetchLater()‘s activateAfter, rather than listening to event handlers?

Where possible, I will also mention how fetchLater() compares with the previous API shape (Pending Beacon).

Methodology

Over the course of 3 months, on a site that I control (with approx 2.5 million samples), I ran an experiment gathering data from browsers using the following three APIs:

An A/B/C experiment was run distributing the test across those APIs, which all sent a small GET request (~100 bytes) back to the same domain / origin.

For all of the data below, I am only looking at Chrome and Chrome Mobile v121-126 (per the User-Agent string) with support for window.fetchLater(), to ensure a level playing field. The data in Beaconing In Practice looks at reliability across all User-Agents, but the experiments below will focus solely on browsers supporting the fetchLater() API.

(It appears Edge, Opera and Samsung Internet Browser participate in Origin Trials and are sending data as well. I excluded those UAs to keep the results consistent)

Reliability of XMLHttpRequest vs. sendBeacon() vs. fetchLater() in Event Handlers

The first question I wanted to know was: Can fetchLater() be easily swapped into existing analytics libraries (like boomerang.js) to replace sendBeacon() and XMLHttpRequest (XHR) usage, and retain the same (or better) reliability (beacon received rate)?

In boomerang for example, we listen to beforeunload and pagehide to send our final "unload" beacon. Can we just use fetchLater() with { activateAfter: 0 } in those events instead?

For this experiment, I segmented visitors into 3 equally-distributed A/B/C groups (given fetchLater() support):

  • A: Force fetchLater() (with { activateAfter: 0 } so it was sent immediately)
  • B: Force navigator.sendBeacon()
  • C: Force XMLHttpRequest

Each group then attempted to send 6 beacons per page load:

  1. Immediately in the <head> of the HTML
  2. In the page onload event
  3. In the page beforeunload event
  4. In the page unload event
  5. In the page pagehide event
  6. In the page visibilitychange event (for hidden)

By seeing how often each of those beacons arrived, we can consider the reliability of each API, during different page lifecycle events. I’m only including results for page loads where the first step (sending data immediately in the <head>) occurred.

Let’s break the experimental data down by event first:

onload

The onload event is probably the most common event for an analytics library to fire a beacon. Marketing and performance analytics tools will often send their main payload at that point in time.

Here’s example code you could use to send data at onload:

function sendTheBeacon() {
    // XHR
    var xhr = new XMLHttpRequest();
    xhr.open('GET', beaconUrl, true);
    xhr.send();

    // sendBeacon
    navigator.sendBeacon(beaconUrl);

    // fetchLater
    fetchLater(beaconUrl, { activateAfter: 0 }); 
}

window.addEventListener("load", sendTheBeacon, false);

Based on our experimentation, when firing a beacon just at the onload event, fetchLater() appears to be slightly more reliable than sendBeacon() and XHR:

reliability at onload

The numbers are very close though, with approximately a half-million samples in each bucket, there is less than a 1% difference between the three APIs.

This result is different than the Pending Beacon experimentation last year, which showed Pending Beacons coming in less reliably than sendBeacon() — likely due to not using .sendNow() in that experiment.

Broken down by Desktop and Mobile:

reliability at onload - desktop

reliability at onload - mobile

The results are ordered the same across desktop and mobile — all within less than 1 percent reliability difference of each other.

Note: that the above results are for only measuring a beacon sent immediately during the page’s onload event, without accounting for any abandons that happen prior to onload. That is why these numbers are so low — if a user abandoned the page prior to the onload event, they would not be counted in the above chart. See the additional breakdowns below for how these numbers change if you use the suggested abandonment strategy of listening to onload, pagehide and visibilitychange.

Great news that fetchLater() seems to be just as reliable (if not more) than sendBeacon() and XHRs during the onload event!

pagehide or visibilitychange

If the intent is to measure events that occur in the page beyond the onload event, i.e. additional performance or reliability metrics (such as Core Web Vitals or JavaScript errors), tools can send a beacon during one of the page’s unload events, such as beforeunload, unload, pagehide or visibilitychange.

Our recommended strategy is to listen to just pagehide and visibilitychange (for hidden), and not listen to the beforeunload or unload events (which are less reliable and can break BFCache navigations).

Example code:

window.addEventListener("pagehide", sendTheBeacon, false);
window.addEventListener("visibilitychange", function() {
    if (document.visibilityState === 'hidden') {
        sendTheBeacon();
    }
}, false);

So let’s look at the result of sending a beacon immediately during a pagehide or visibilitychange event (if a beacon was received for either event):

reliability at pagehide or visibilitychange

Here we see that sendBeacon() has a slight edge over fetchLater() — about 0.5% more reliable.

XHR trails much farther behind at only 83.% reliable. This is because XHRs can be aborted as the page is abandoned, or the user navigates away.

Let’s break it down by platform:

reliability at pagehide or visibilitychange - desktop

fetchLater() is nearly identical to sendBeacon() reliability on Desktop, with XHR trailing behind.

On Mobile:

reliability at pagehide or visibilitychange - mobile

fetchLater() trails a bit further behind sendBeacon() (1.1% less reliable).

I was hoping these pagehide and visibilitychange[hidden] numbers would mirror what we saw for onload, where fetchLater() would be slightly better than sendBeacon even. However, sendBeacon() appears to have a slight edge in reliability, most notably on mobile platforms when the page is unloading.

I will follow-up with the Chrome team to determine if there’s anything that could be contributing to this.

onload or pagehide or visibilitychange

Finally, let’s combine the above three events per the suggested abandonment strategy, and see how reliable each API is if we’re listening for all 3 events (and sending data once in any of them).

Of course, this increases the reliability of receiving beacons to the maximum possible, with sendBeacon() and fetchLater() able to get a beacon to the server over 98% of the time:

reliability at onload or pagehide or visibilitychange

Broken down by Desktop vs. Mobile, we see that Desktop is has an extremely high rate of receiving beacons, 99% ore more:

reliability at onload or pagehide or visibilitychange - desktop

While Mobile shows a bit less reliably results, but still over 97% for sendBeacon() and fetchLater():

reliability at onload or pagehide or visibilitychange - mobile

Conclusion

From experimenting with using fetchLater() in event handlers, it seems to me that fetchLater() is nearly identical to sendBeacon() in reliability (and both are improvements over XHR).

If sending data during onload, fetchLater() is slightly more reliable than sendBeacon().

If sending data during pagehide or visibilitychange[hidden], sendBeacon() is slightly more reliable than fetchLater() (more pronounced on mobile). It’s probably worthwhile to look into this a bit further why.

NOTE: I measured the reliability of sending beacons during beforeunload and unload as well, but since those events are deprecated / not-recommended / unreliable / break BFCache events, I’ll skip those results in this post.

Reliability of fetchLater() using activateAfter

Here’s an interesting experiment: Let’s say you want to send a beacon to your analytics service, but you don’t have a strong opinion on when that data should be sent.

You don’t necessarily want to send it at startup, as that network request could conflict with the page’s important assets.

As long as it’s sent by the time the page is unloading, that’s good enough!

One naive way you could do this is just use a setTimeout(, n) and call sendBeacon() much later, after the page has fully loaded:

window.addEventListener("load", function() {
    setTimeout(function() {
        navigator.sendBeacon(beaconUrl);
    }, 1000);
}, false);

If you didn’t take into account an abandonment strategy, and you tried different values of N milliseconds, your reliability rate might look like this:

sendBeacon() after setTimeout of N seconds

i.e. waiting 1 second after Page Load you’d only see 96.6% of beacons, while waiting for 60 seconds (and hoping they stick around on your page for 60 seconds) results in only 24.1% of beacons arriving (on this example site).

Of course, you wouldn’t do this in real-life: you’d listen for pagehide and visibilitychange, but this shows a worst-case example.

Here’s where fetchLater() comes in: you can actually use it blindly like this, and have much more positive results! Just specify a { activateAfter: n } value for your preferred delay:

fetchLater(beaconUrl, { activateAfter: 1000 });

The fetchLater() results in doing this are pretty impressive:

fetchLater() after activateAfter of N seconds

Using a value of 1 second only results in 0.2% of beacons being lost, while a value of 600 seconds still gives you 93.7% of all beacons.

Setting activateAfter to a nearly-unlimited value (say 999999999999999), i.e. you’re asking fetchLater() to do all the heavy-lifting to send a beacon whenever the page is abandoned, we still see those beacons arrive 92.3% of the time.

While that isn’t 100% of the time, it’s a lot better and more ergonomic than having to listen to onload, pagehide, visibilitychange, etc.

Our previous experimentation showed that if you want to "hold" your data for unload, listening to all 4 unload-ish events (beforeunload, unload, pagehide, visibilitychange), sending a beacon in those events only resulted in ~82.9% reliability! So fetchLater() is 9.4% (in real terms) more reliable here.

And in the meantime, the draft fetchLater() could be aborted and replaced with additional data up until the page unloads (at which point you could let the "last" values go out, or even replace it again with any at-unload data you want to update).

This reliability varies by platform. If we zoom into using { activateAfter: 60000 } (60s), we can see that Desktop (99.0%) is a lot more reliable than Mobile (90.4%):

fetchLater() 60s

Regardless, fetchLater() offers some unique benefits for sending data.

Follow-Ups

As last time, I want to be open in saying that:

  • Some of my methodology may be flawed.
    • Last time I wasn’t using .sendNow() with Pending Beacon, and that affected the reliability in page-unloading scenarios.
    • Luckily, fetchLater() reduces the complexity a bit, and we now see reliability as-good-as or even better-than sendBeacon() most of the time
  • These results were captured in a A/B/C test on one of my personal websites.
    • Your results will vary!
    • I also have noticed that over time the numbers for all results shift slightly. My A/B/C experimentation was happening simultaneously though, so shouldn’t be affected by changes in time.
  • I’m open to review and criticism or feedback on other things to check.

Given that, there is one follow-up for fetchLater() that I would like to review:

  • Why is fetchLater() in pagehide and visibilitychange[hidden] slightly less reliable than sendBeacon()?
    • I only saw ~0.2% less beacons, but I was hoping it would be equal or better!

How We’re Going to Use it

Given the cool possibilities of fetchLater(), how do I envision taking advantage of it?

For boomerang.js (our RUM measurment tool we use at Akamai mPulse), we have a few different types of beacons we send:

  • Our load beacon at the onload event. This contains all of the performance information from the page.
  • An unload beacon at pagehide and beforeunload. This lets us know how long the user was reading the page.
  • Some websites have enabled an early beacon that gets sent immediately at page initialization, so we avoid any data loss from page abandonment (the user leaves before onload and when event handlers aren’t reliable). If the main beacon doesn’t come in, the early beacon data is used.
  • error beacons contain information about any JavaScript errors that occur during user interactions after the main beacon was sent.
  • spa beacons for Single Page App Soft Navigations.
  • (… and a few more obscure ones)

fetchLater() can help us get data more reliably in a few of these scenarios!

  • early beacons may no longer be necessary: we can queue up a fetchLater() with the same data, and abort it if we reach onload and send our regular data. This will reduce the amount of beacons we send (and that we have to keep in memory in our infrastructure).
  • error beacons could be sent less often: right now our customers often choose to send batches of error beacons every 1 to 5 seconds, to ensure they arrive reliably. We could batch new errors into a fetchLater() beacon that only get sent after 60 seconds, trusting the browser to deliver it (and appending new errors if they occur in the meantime).
  • It would take a bit of engineering to make such a drastic change to our library, but fetchLater() could allow us to combine our load and unload beacons into a single beacon that just gets sent as the page is unloading. (the downside of this is that data may not be as "real time" into our dashboards as it is today, which shows beacons withing 5-10 seconds of the Page Load happening).

We’re hoping to experiment with some of these ideas soon!

TL;DR

  • Last time I experimented with Pending Beacon, I had concerns with ergonomics (lack of Developer Tools Support) and reliability (less beacons arriving than sendBeacon()). Both of these are resolved!
  • I’m really excited for the fetchLater() API. It’s giving developers better ergonomics for sending data, and a more reliable way to send beacons at the end of the page lifetime.
  • The new fetchLater() API is in active development and going through a feedback and Origin Trial cycle.
  • I would suggest analytics libraries seriously consider utilizing the API if available (after the Origin Trial concludes).

Thanks for reading and your support! Please contact me with any feedback, questions, etc.
JS Self-Profiling API In Practice

December 31st, 2021

Table of Contents

The JS Self-Profiling API

The JavaScript Self-Profiling API allows you to take performance profiles of your JavaScript web application in the real world from real customers on real devices. In other words, you’re no longer limited to only profiling your application on your personal machines (locally) from browser developer tools! Profiling your application is a great way to get insight into its performance. A profile will help you see what is running over time (its "stack"), and can identify "hot spots" in your code.

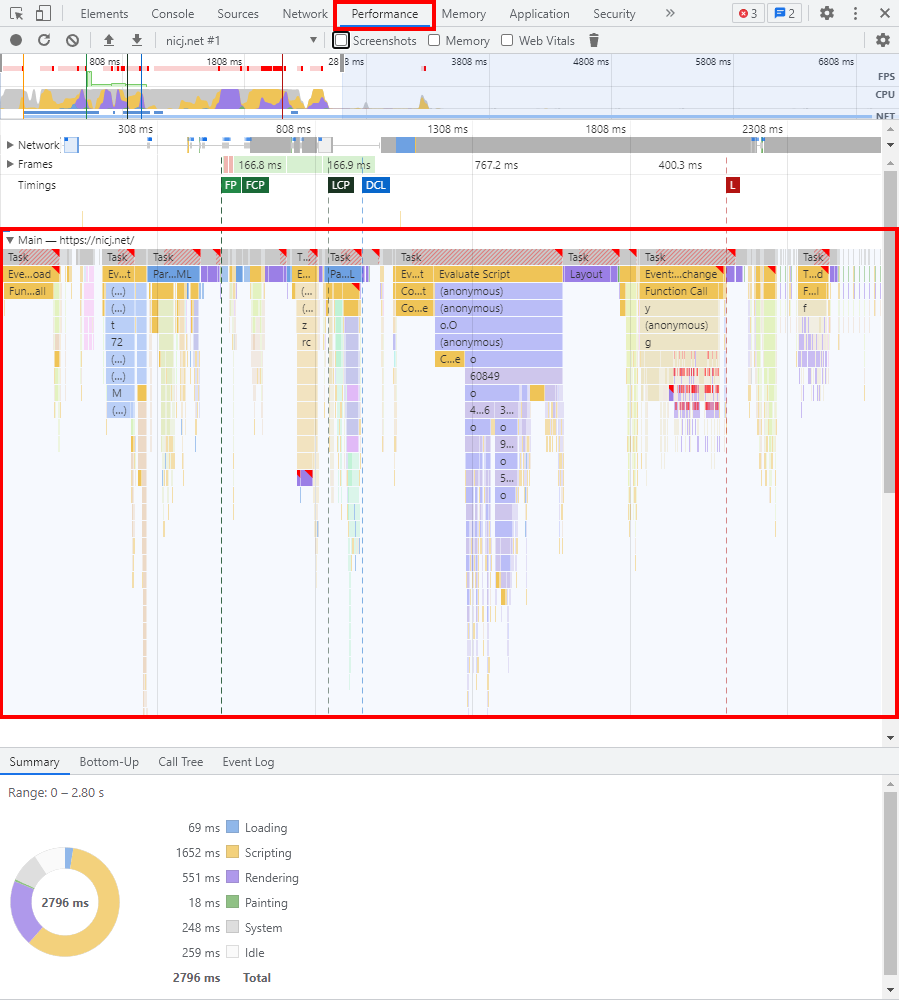
You may be familiar with profiling JavaScript if you’ve ever used a browser’s developer tools. For example, in Chrome’s Developer Tools in the Performance tab, you can record a profile. This profile provides (among other things) a view of what’s running in the application over time.

browser developer tools

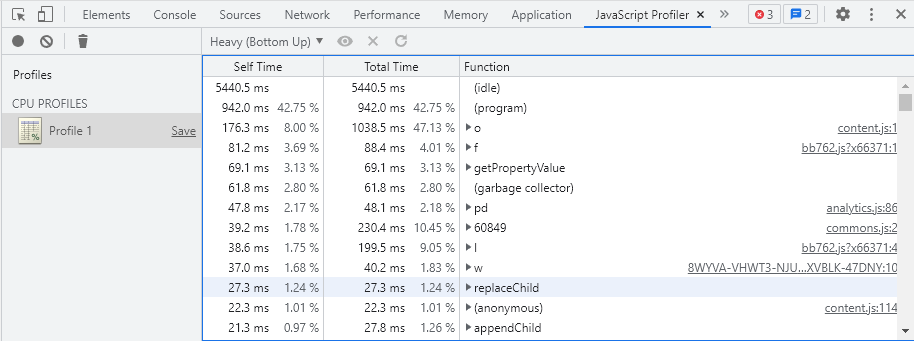
In fact, this API actually reminds me a bit more of the simplicity of the old JavaScript Profiler tab, which is still available in Chrome, but hidden in favor of the new Performance tab.

Chrome's Developer Tools' old JavaScript Profiler tab

The JS Self-Profiling API is a new API, currently only available in Chrome versions 94+ (on Desktop and Android). It provides a sampling profiler that you can enable, from JavaScript, for any of your visitors.

The API is a currently a WICG draft, and is being evaluated by browsers before possibly being adopted by a W3C Working Group such as the Web Performance WG.

What is Sampled Profiling?

There are two common types of performance profilers in use today:

  1. Instrumented (or "structured" or "tracing") Profilers, in which an application is invasively instrumented (modified) to add hooks at every function entry and exit, so the exact time spent in each function is known
  2. Sampled Profilers, which temporarily pause execution of the application at a fixed frequency to note ("sample") what is running on the call stack at that time

The JS Self-Profiling API starts a sampled profiler in the browser. This is the same profiler that records traces in browser developer tools.

The "sampling" part of the profiler means that the browser is basically taking a snapshot at regular intervals, checking what’s currently running on the stack. This is a lightweight way of tracing an application’s performance, as long as the sampling interval isn’t too frequent. Each regularly-spaced sampling interrupt quickly inspects the running stack and notes it for later. Over time, these sampled stacks can give you a indication of what was commonly running during the trace, though sometimes samples can also mislead (see Downsides below).

Consider a diagram of the function stacks running in an application over time. A sampling profiler will attempt to inspect the currently-running stack at regular intervals (the vertical red lines), and report on what it sees:

sampled profiler stacks

The other common method of profiling an application, often called a instrumented or tracing or structured profiler, relies on invasively modifying the application so that the profiler knows exactly when every function is called, begins and ends. This invasive measurement has a lot of overhead, and can slow down the application being measured. However, it provides an exact measurement of the relative time being spent in every function, as well as exact function call-counts. Due to the overhead that comes from invasively hooking every function entry and exit, the app will be slowed down (spending time in instrumentation).

Instrumented profiling has a time and place, but it’s generally not performed in the "real world" on your visitors — as it will slow down their experience. This is why sampled profiling is more popular on the web, as it has a smaller performance impact on the application being sampled.

With this API, you can choose the sampling frequency. In my testing, Chrome currently doesn’t let you sample any more frequently than once every 16ms (Windows) or 10ms (Mac / Android).

If you want to learn more about the different types of profiling, I highly recommend viewing Ilya Grigorik’s Structural and Sampling JavaScript Profiling
in Google Chrome
slides from 2012. It goes into further details about when to use the two types of profilers and how they complement each other.

Note: further in this document I may use the term "traces" to describe the data from a Sampled Profiler, not from a Tracing Profiler.

Downsides to Sampled Profiling

Unlike Instrumented Profilers that trace each function’s entry and exit (which increases the measurement overhead significantly), Sampled Profilers simply poll the stack at regular intervals to determine what’s running.

This type of lightweight profiling is great for reducing overhead, but it can lead to some situations where the data it captures is misleading at best, or wrong at worst.

Let’s look at the previous call stack and the 8 samples it took, pretending the samples were 10ms apart:

sampled profiler stacks

Since the Sampled Profiler doesn’t know any better, it guesses that any hit during its regular sampling interval was running for that entire interval, i.e. 10ms.

If a Sampled Profiler was examining that stack at those regular intervals (the vertical red lines), it would report the overall time spent in these stacks as:

  • A->B->C: 1 hit (10ms)
  • A->B: 2 hits (20ms)
  • A: 1 hit (10ms)
  • D: 2 hits (20ms)
  • idle: 2 (20ms)

While this is a decent representation of what was running over those 80ms, it’s not entirely accurate:

  • A->B->C is over-reported by 6ms
  • A->B is over-reported by 12ms
  • A is under-reported by 8ms
  • D is over-reported by 8ms
  • D->D->D is missing and under-reported by 4ms
  • idle is under-reported by 15ms

This mis-reporting can get worse in a few canonical cases. Most application stacks won’t be this simple, so it’s unlikely you’ll see this happen exactly as-is in the real world, but it’s useful to understand.

First, consider a case where your sampled profiler is taking samples every 10ms, and your application has a task that executes for 2ms approximately every 16ms. Will the Sampled Profiler even notice it was running?

sampled profiler stacks - bad case

Maybe, or maybe not — depends on when the sampling happens, and the frequency/runtime of the function. In this case, the function is executing for 12.5% of the runtime, but may get un-reported.

Taken to the extreme, this same function may have the exact same interval frequency as the profiler, but only execute for that 1ms that was being sampled:

sampled profiler stacks - bad case

In this case, the function may be only running for 12.5% of the runtime, but may get reported as running 100% of the time.

To the other extreme, you could have a function which runs at 10ms intervals but only for 8ms:

sampled profiler stacks - bad case

Depending on when the Sampling Profiler hits, it may not get reported at all, even though it’s executing for 80% of the time.

All of these are "canonically bad" examples, but you could see how some types of program behavior may get mis-represented by a Sampled Profiler. Something to keep in mind as you’re looking at traces!

API

Document Policy

In order to allow the JavaScript Self-Profiling API to be called, there needs to be a Document Policy on the HTML page, called js-profiling. This is usually configured via a HTTP response header called Document-Policy, or via a <iframe policy=""> attribute.

A simple example of enabling the API would be this HTTP response header (for the HTML page):

Document-Policy: js-profiling

Once enabled, any JavaScript on the page can start profiling, including third-party scripts!

API Shape

The JS Self-Profiling API exposes a new Profiler object (in browsers that support it).

Creating the object starts the Sampled Profiler, and you can later call .stop() on the object to stop profiling and get the trace back (via a Promise).

if (typeof window.Profiler === "function") {
  var profiler = new Profiler({ sampleInterval: 10, maxBufferSize: 10000 });

  // do work
  profiler.stop().then(function(trace) {
    sendProfile(trace);
  });
}

Or if you’re into whole await thing:

if (typeof window.Profiler === "function") {
  const profiler = new Profiler({ sampleInterval: 10, maxBufferSize: 10000 });

  // do work
  var trace = await profiler.stop();
  sendProfile(trace);
}

The two main options you can set when starting a profile are:

  • sampleInterval is the application’s desired sample interval (in milliseconds)
    • Once started, the true sampling rate is accessible via profiler.sampleInterval
  • maxBufferSize is the desired sample buffer size limit, measured in number of samples

There is usually a measurable delay to starting a new Profiler(), as the browser needs to prepare its profiler infrastructure.

In my testing, I’ve found that new profiles usually take 1-2ms to start (e.g. before new Profiler() returns) on both desktop and mobile.

Sample Interval

The sampleInterval you specify (in milliseconds) determines how frequently the browser wakes up to take samples of the JavaScript call stack.

Ideally, you would want to choose a small enough interval that gives you data as accurately as possible without there being measurement overhead.

The draft spec suggests you need to simply specify a value greater than or equal to zero (though I’m not sure what zero would mean), though the User Agent may choose the rate that it ultimately samples at.

In practice, in Chrome 96+, I’ve found the following minimum sampling rates supported:

  • Windows Desktop: 16ms
  • Mac/Linux Desktop, Android: 10ms

Meaning, if you specify sampleInterval: 1, you will only get a sampling rate of 16ms on Windows.

You can verify the sampling rate that was chosen by the User Agent by inspecting the .sampleInterval of any started trace:

const profiler = new Profiler({ sampleInterval: 1, maxBufferSize: 10000 });
console.log(profiler.sampleInterval);

In addition, it appears in Chrome that the chosen actual sample interval is rounded up to the next multiple of the minimum, so 16ms (Windows) or 10ms (Mac/Android).

For example, if you choose a sampleInterval of between 91-99ms on Android, you’ll get 100ms instead.

Buffer

The other knob you control when starting a trace is the maxBufferSize. This is the maximum number of samples the Profiler will take before stopping on its own.

For example, if you specify a sampleInterval: 100 and a maxBufferSize: 10, you will get 10 samples of 100ms each, so 1s of data.

If the buffer fills, the samplebufferfull event fires and no more samples are taken.

if (typeof window.Profiler === "function")
{
  const profiler = new Profiler({ sampleInterval: 10, maxBufferSize: 10000 });

  function collectAndSendProfile() {
    if (profiler.stopped) return;

    sendProfile(await profiler.stop());
  }

  profiler.addEventListener('samplebufferfull', collectAndSendProfile);

  // do work, or listen for some other event, then:
  // collectAndSendProfile();
}

Who to Profile

Should you enable a Sampled Profiler for all of your visitors? Probably not. While the observed overhead appears to be small, it’s best not to burden all visitors with sampling and collecting this data.

Ideally, you would probably sample your Sampled Profiler activations as well.

You could consider turning it on for 10% or 1% or 0.1% of your visitors, for example.

The main reasons you wouldn’t want to enable this for all visitors are:

  • While minimal, enabling sampling has some associated cost, so you probably don’t want to slow down all visitors
  • The amount of data produced by a sampled profiler trace is significant, and your probably don’t want your servers to have to deal with this data from every visitor
  • As of 2021-12, the only browser that supports this API is Chrome, so your profiles will be biased towards that browser, as well as the above downsides

Enabling the profiler for a sample of specific page loads, or a sample of specific visitors seems ideal.

When to Profile

Now that you’ve determined that this current page or visitor should be profiled, when should you turn it on?

There are a lot ways you can utilize profiling during a session: specific events, user interactions, the entire page load itself, and more.

Specific Operations

Your app probably has a few complex operations that it regularly executes for visitors.

Instrumenting these operations (on a sampled basis) may be useful in the cases where you don’t know how the code is flowing and performing in the real world. It could also be useful if you’re calling into third-party scripts where you don’t fully understand their cost.

You could simply start the Profiler at the beginning of the operation and stop it once complete.

The trace data you capture won’t necessarily be limited to just the code you’re profiling, but that can also help you understand if your operations are competing with any other code.

function loadExpensiveThirdParty() {
  const profiler = new Profiler({ sampleInterval: 10, maxBufferSize: 1000 });

  loadThirdParty(async function onThirdPartyComplete() {
      var trace = await profiler.stop();
      sendProfile(trace);
  });
}

User Interactions

User interactions are great to profile from time to time, especially if metrics like First Input Delay are important to you.

There are a couple approaches you could take regarding when to start the profiler when measuring user interactions:

  • Have one always running. When a user interacts, trim the profile to a short amount of time before and after the events
    • If you’re using EventTiming and have an active Profiler, you could measure from the event’s startTime to processingEnd to understand what was running before, during and as a result of the event
  • Turn on a Profiler once the mouse starts moving, or moving towards a known click-able target
  • Turn on a Profiler once there’s an event like mousedown where you expect the user to follow through with their interaction

If you wish to wait for a user interaction to start a profiler, note that creating a new Profiler() has a measurable cost (1-2ms) in many cases.

Here’s an example of having a long-running Profiler available for when there are user interactions, via EventTiming:

// start a profiler to be monitoring all times
let profiler = new Profiler({ sampleInterval: interval, maxBufferSize: 10000 });

// when there are impactful EventTiming events like 'click', filter to those samples and start a new Profiler
const observer = new PerformanceObserver(function(list) {
    const perfEntries = list.getEntries().forEach(entry => {
        if (profiler && !profiler.stopped && entry.name === 'click') {
            profiler.stop().then(function(trace) {
                const filteredSamples = trace.samples.filter(function(sample) {
                    return sample.timestamp >= entry.startTime && sample.timestamp <= entry.processingEnd;
                });

                // do something with the filteredSamples and the event

                // start a new profiler
                profiler = new Profiler({ sampleInterval: interval, maxBufferSize: 10000 });
            });
        }
    });
})
.observe({type: 'event', buffered: true});

Page Load

If you want to profile the entire Page Load process, it’s best to start the Profiler via an inline <script> tag before any other Scripts in the <head> of your document.

You could then wait for the page’s onload event, plus a delay, before processing/sending the trace.

You may also want to listen to the pagehide or visibilitychange events to determine if the visitor abandons the page before it fully loads, and send the profile then. Note there are challenges when sending from unload events.

If you’re measuring other important aspects, metrics and events of the Page Load process, like Long Tasks or EventTiming events, having a Sampled Profiler trace to understand what was running during those events can be very enlightening.

Overhead

Any time you enable a profiler, the browser will be doing extra work to capture the performance data. Luckily a Sampled Profiler is a bit cheaper to do than an Instrumented Profiler, but what is its cost in the real-world?

Facebook, one of the primary drivers of this API, has reported that initial data suggests enabling profiling slows load time by <1% (p=0.05).

In my own experimentation on one of my websites, there was no noticeable difference in Page Load times between sessions with profiling enabled and those without.

This is great news, though I would love to see more experimentation and evaluation of the performance impacts of this API. If you’ve used the JS Self-Profiling API, please share your experimentation results!

Anatomy of a Profile

The profile trace object returned from the Profiler.stop() Promise callback is described in the spec’s appendix, and contains four main sections:

  • frames contains an array of frames, i.e. individual functions that could be part of a stack
    • You may see DOM functions (such as set innerHTML) or even Profiler (for work the Sampled Profiler is doing) here
    • If a frame is missing a name it’s likely JavaScript executing in the root of a <script> tag or external JavaScript file, see this note for a workaround
  • resources contains an array of all of the resources that contained functions that have a frame in the trace
    • The page itself is often (always?) the first in the array, with any other external JavaScript files or pages following
  • samples are the actual profiler samples, with a corresponding timestamp for when the sample occurred and a stackId pointing at the stack executing at that time
    • If there is no stackId, nothing was executing at that time
  • stacks contains an array of frames that were running on the top of the stack
    • Each stack may have an optional parentId, which maps into the next node of the tree for the function that called it (and so forth)

This format is unique to the JS Self-Profiling API, and cannot be used directly in any other tool (at the moment).

Here’s a full example:

{
  "frames": [
    { "name": "Profiler" }, // the Profiler itself
    { "column": 0, "line": 100, "name": "", "resourceId": 0 }, // un-named function in root HTML page
    { "name": "set innerHTML" }, // DOM function
    { "column": 10, "line": 10, "name": "A", "resourceId": 1 } // A() in app.js
    { "column": 20, "line": 20, "name": "B", "resourceId": 1 } // B() in app.js
  ],
  "resources": [
    "https://example.com/page",
    "https://example.com/app.js",
  ],
  "samples": [
      { "stackId": 0, "timestamp": 161.99500000476837 }, // Profiler
      { "stackId": 2, "timestamp": 182.43499994277954 }, // app.js:A()
      { "timestamp": 197.43499994277954 }, // nothing running
      { "timestamp": 213.32999992370605 }, // nothing running
      { "stackId": 3, "timestamp": 228.59999990463257 }, // app.js:A()->B()
  ],
  "stacks": [
    { "frameId": 0 }, // Profiler
    { "frameId": 2 }, // set innerHTML
    { "frameId": 3 }, // A()
    { "frameId": 4, "parentId": 2 } // A()->B()
  ]
}

To figure out what was running over time, you look at the samples array, each entry containing a timestamp of when the sample occurred.

For example:

"samples": [
  ...
  { "stackId": 3, "timestamp": 228.59999990463257 }, // app.js:A()->B()
  ...
]

If that sample does not contain a stackId, nothing was executing.

If that sample contains a stackId, you look it up in the stacks: [] array by the index (3 in the above):

"stacks": [
  ...
  2: { "frameId": 3 }, // A()
  3: { "frameId": 4, "parentId": 2 } // A()->B()
]

We see that stackId: 3 is frameId: 4 with a parentId: 2.

If you follow the parentId chain recursively, you can see the full stack. In this case, there are only two frames in this stack:

frameId:4
frameId:3

From those frameIds, look into the frames: [] array to map them to functions:

"frames": [
...
  3: { "column": 10, "line": 10, "name": "A", "resourceId": 1 } // A() in app.js
  4: { "column": 20, "line": 20, "name": "B", "resourceId": 1 } // B() in app.js
],

So the stack for the sample at 228.59999990463257 above is:

B()
A()

Meaning, A() called B().

Beaconing

Once a Sampled Profile trace is stopped, what should you do with the data? You probably want to exfiltrate the data somehow.

Depending on the size of the trace, you could either process it locally first (in the browser), or just send it raw to your back-end servers for further analysis.

If you will be sending the trace elsewhere for processing, you will probably want to gather supporting evidence with it to make the trace more actionable.

For example, you could gather alongside the trace:

  • Performance metrics, such as Page Load Time or any of the Core Web Vitals
    • These can help you understand if the Sampled Profile trace is measuring a user experience that was "good" vs. "bad"
  • Supporting performance events, such as Long Tasks or EventTiming events
    • These can help you understand what was happening during "bad" events by correlating samples with events such as Long Tasks
  • User Experience characteristics, such as User Agent / Device information, page dimensions, etc
    • These can help you slice-and-dice your data, and help narrow down your search if you come across patterns of "bad" experiences

Sampled Profiles are most helpful when you can understand the circumstances under which they were taken, so make sure you have enough information to know whether the trace is a "good" user experience or a "bad" one.

Size

Depending on the frequency (sampleInterval) and duration (or maxBufferSize) of your profiles, the resulting trace data can be 10s or 100s of KB! Simply taking the JSON.stringify() representation of the data may not be the best choice if you intend on uploading the raw trace to your server.

In a sample of ~50,000 profiles captured from my website, where I was profiling from the start of the page through 5 seconds after Page Load, the traces averaged about 25 KB in size. The median page load time on this site is about 2 seconds, so these traces captured about 7 seconds of data. These traces are essentially the JSON.stringify() output of the trace data.

The good news is 25 KB is reasonable where you could just take the simplest approach and upload it directly to a server for processing.

Compression

You also have a few other options for reducing the size of this data before you upload, if you’re willing to trade some CPU time.

One option is the Compression Stream API, which gives you the ability to get a gzip-compressed stream of data from your string input. It should be available (in Chrome) whenever the JS Self-Profiling API is available. One downside is that it is (currently) async-only, so you will need to wait for a callback with the compressed bytes, before you can upload your compressed profile data.

If you expect to send this data via the application/x-www-form-urlencoded encoding, be aware that URL-encoding JSON.stringify() strings results in a much larger string. For example, a 25 KB JSON object from JSON.stringify() grows to about 36 KB if application/x-www-form-urlencoded encoded.

To avoid this bloat, you could alternatively consider something like JSURL. JSURL is an interesting library that looks similar to JSON, but encodes a bit smaller for URL-encoded data (like application/x-www-form-urlencoded data).

Besides these generic compression methods that can be applied to any string data, someone smart could probably come up with a domain-specific compression scheme for this data if they desired! Please!

Analyzing Profiles

Once you’ve started capturing these profiles from your visitors and have been beaconing them to your servers, now what?

Assuming you’re sending the full trace data (and not doing profile analysis in the browser before beaconing), you have a lot of data to work with.

Let’s split the discussion between looking at individual profiles (for debugging) and in bulk (aggregate analysis).

Individual Profiles

As far as I’m aware, there aren’t any openly-available ways of visualizing this trace data in any of the common browser developer tools.

While the JS Self-Profiling API Readme mentions that Mozilla's perf.html visualization tool for Firefox profiles or Chrome's trace-viewer (chrome://tracing) UI could be trivially adapted to visualize the data produced by this profiling API., I do not believe this had been done yet.

Ideally, someone could either update one of the existing visualization tools, or write a converter to change the JS Self-Profiling API format into one of the existing formats. I have seen a comment from a developer that the Specto visualization tool may be able to display this data soon, which would be great!

Until then, I don’t think it’s very feasible to review individual traces "by hand".

With the knowledge of the trace format and just a little bit of code, you could easily post-process these traces to pick out interesting aspects of the traces. Which brings us to…

Bulk Profile Analysis

Given a large number of sampled profiles, what insights could you gain from them?

This is an inherently challenging problem. Given a sample of visitors with tracing enabled, and each trace containing KB or MB of trace data, knowing how to effectively use that data to narrow down performance problems is no easy feat.

The infrastructure required to do this type of bulk analysis is not insignificant, though it really boils down to post-processing the traces and aggregating those insights in ways that make sense.

As a starting point, there are at least a few ways of distilling sampled profile traces down into smaller data points. By aggregating this type of information for each trace, you may be able to spot patterns, such as which hot functions are more often seen in slower scenarios.

For example, given a single sampled profile trace, you may be able to extract its:

  • Top N function(s) (by exclusive time)
  • Top N function(s) (by inclusive time)
  • Top N file(s)

If you captured other supporting information alongside the profile, such as Long Tasks or EventTiming events, you could provide more context to why those events were slow as well!

Aggregating this information into a traditional analytics engine, and you may be able to gain insight into which code to focus on.

Gotchas

Of course, no API is perfect, and there are a few ways this API can be confusing, misleading, or hard to use.

Here are a few gotchas I’ve encountered.

Minified JavaScript

If your application contains minified JavaScript, the Sampled Profiles will report the minified function names.

If you will be processing profiles on your server, you may want to un-minify them via the Source Map artifacts from the build.

Named Functions

One issue that I came across while testing this API on personal websites was that I was finding a lot of work triggered by "un-named" functions:

{
  "frames": [
    ...
    { "column": 0, "line": 10, "name": "", "resourceId": 0 }, // un-named function in root HTML page
    { "column": 0, "line": 52, "name": "", "resourceId": 0 }, // another un-named function in root HTML page
    ...
  ],

These frames were coming from the page itself (resourceId: 0), i.e. inline <script> tags.

They’re hard to map back to the original function in the HTML, since the page’s HTML may differ by URL or by visitor.

One thing that helped me group these frames better was to change the inline <script>‘s JavaScript so that they run from named anonymous functions.

e.g. instead of:

<script>
// start some work
</script>

Simply wrap it in a named IIFE (Immediately Invoked Function Expression):

<script>
(function initializeThirdPartyInHTML() {
  // start some work
})();
</script>

Then the frames array provides better context:

{
  "frames": [
    ...
    { "column": 0, "line": 10, "name": "initializeThirdPartyInHtml", "resourceId": 0 }, // now with 100% more name!
    { "column": 0, "line": 52, "name": "doOtherWorkInHtml", "resourceId": 0 },
    ...
  ],

Cross-Origin Scripts

When the API was first being developed and experimented with, it came with a requirement that the page being profiled have cross-origin isolation (COI) via COOP and COEP. If any third-party script did not enable COOP/COEP, then the API could not be used.

This requirement unfortunately made the API nearly useless for any site that includes third-party content, as forcing those third-parties into COOP/COEP compliance is tricky at best.

Thankfully, after some discussion, the implementation in Chrome was updated, and the COI requirement was dropped.

However, there are still major challenges when you utilize third-party scripts. In order to not leak private information from third-party scripts, they are treated as opaque unless they opt-in to CORS. This is primarily to ensure their call stacks aren’t unintentionally leaked, which may include private information. Any cross-origin JavaScript that is in a call-stack will have its entire frame removed unless it has a CORS header.

This is analogous to the protections that cross-origin scripts have in JavaScript error events, where detailed information (line/column number) is only available if the script is same-origin or CORS-enabled.

When applied to Sampled Profiles, this has some strange side-effects.

For any cross-origin script (that is not opt-in to CORS) that has a frame in a sample, its entire frame will be removed, without any indication that this has been done. As a result, this means that some of the stacks may be misleading or confusing.

Consider a case where your same-origin JavaScript calls into one or more cross-origin function:

sampled profiler with cross-origin content

Guess what the profiler will report?

  • sameOriginFunction() 20ms

Even though the two functions crossOriginFunctionA() and crossOriginFunctionB() accounted for a most of the runtime, the JS Self-Profiling API will remove those frames entirely from the report, and limit its reporting to sameOriginFunction().

It’s even stranger if those cross-origin functions call back into same-origin functions. Consider a third-party utility library like jQuery that might do this?

sampled profiler with cross-origin content

The profiler will report:

  • sameOriginFunction() 10ms
  • sameOriginFunction() -> sameOriginCallback() 10ms

In other words, it pretends the cross-origin functions don’t even exist. This could make debugging these types of stacks very confusing!

To ensure your third-party scripts are CORS-enabled, you need to do two things:

  1. The origin serving the third-party JavaScript needs to have the Access-Control-Allow-Origin HTTP response header set
  2. The embedding HTML page needs to set <script src="..." crossorigin="anonymous"></script>

Once these have been set, the third-party JavaScript will be treated the same as any same-origin content and its frame/function/line/column numbers available.

Sending from Unload Events

One challenge with using the JS Self-Profiling API is that to get the trace data, you need to rely on a Promise (callback) from .stop().

As a result, you really can’t use this function in page unload handlers like beforeunload or unload, where promises and callbacks may not get the chance to fire before the DOM is destroyed.

So if you want to use the JS Self-Profiling API, you won’t be able to wait until the page is being unloaded to send your profiles. If you want to profile a session for a long time, you would need to consider breaking up the profiles into multiple pieces and beacon at a regular interval to ensure you received most (but probably not the final) trace.

This is unfortunate for one scenario, which is page loads that are delayed due to a third-party resource or other heavy site execution. I would expect many consumers of this API to trace from the beginning of the page to the load event. But if the visitor leaves the page before it fully loads (say due to a delayed third-party resource), the unload event will fire before the load event, and there will be no opportunity to get the callback from the Profiler.stop().

I’ve filed an issue to see if there are any better ways of addressing unload scenarios.

Non-JavaScript Browser Work

One of the issues with the current profiler is that non-JavaScript execution isn’t represented in profiles.

As a result, top-level User Agent work like HTML Parsing, CSS Style and Layout Calculation, and Painting will appear as "empty" samples.

Other activity like JavaScript garbage collection (GC) will also be "empty" in samples.

There is a proposal for the User Agent to add optional "markers" for specific samples, if it wants the profiler to know about non-JavaScript work:

enum ProfilerMarker { "script", "gc", "style", "layout", "paint", "other" };

...
"samples" : [
  { "timestamp" : 100, "stackId": 2, "marker": "script" },
  { "timestamp" : 110, "stackId": 2, "marker": "gc" },
  { "timestamp" : 120, "stackId": 3, "marker": "layout" },
  { "timestamp" : 130, "stackId": 2, "marker": "script" },
  { "timestamp" : 140, "stackId": 2, "marker": "script" },
}
...

This is still just a proposal, but if implemented it will provide a lot more context of what the browser is doing in profiles.

Conclusion

The JS Self-Profiling API is still under heavy development, experimentation and testing. There are open issues in the Github repository where work is being tracked, and I would encourage anyone utilizing the API to post feedback there.

We’ve heard feedback from Facebook and Microsoft and others that the API has been useful in identifying and fixing performance issues from customers.

Looking forward to hearing others giving the API a try and their results!

Beaconing In Practice

December 28th, 2020

Table of Contents

Introduction

Lighthouse modified via vecteezy.com

  • Step 1: Gather the data!
  • Step 2: ???
  • Step 3: Profit!

Let’s say you have a website, and you want to find out how long it takes your visitors to see the Largest Contentful Paint on your homepage.

Or, let’s say you want to track how frequently your visitors are clicking a button during the Checkout process.

Or, let’s say you want to use the new Measure Memory API to track JavaScript memory usage over time, because you’re concerned that your Single Page App might have a leak.

Or, let’s say your work on a performance analytics library that automatically captures performance metrics all throughout the Page Load and beyond.

For each of those scenarios, you may end up using one of the many exciting JavaScript APIs or libraries to capture, query, track or observe key metrics.

That’s the easy part!

The hard part is making sure your back-end actually receives that data in a reliable way. If your telemetry hasn’t been received, the experience never happened! What’s worse, you may not even know that you don’t know it happened!

So, I’d argue that Step 2 is just as important as Step 1:

  • Step 1: Gather the data!
  • Step 2: Beacon the data!
  • Step 3: Profit!

This article will look at several strategies for reliably exfiltrating telemetry — aka beaconing. We will cover when and how to send beacons, and gotchas you should watch out for.

This article was written by one of the authors of Boomerang, an open-source RUM performance monitoring library that sends a lot of beacons (1 billion+ a day!). We were taking a look at how and when we send beacons to make sure we’re sending them as optimally as possible, especially to make sure we’re not missing beacons due to listening to the wrong (or too many) events. See our findings in the TL;DR section!

Beacons

Each of the scenarios above cover different ways that websites can collect telemetry. What is telemetry? Wikipedia says:

Telemetry is the in situ collection of measurements or other data at remote points and their automatic transmission to receiving equipment (telecommunication) for monitoring

Any sort of measurement, whether it’s for performance, marketing or just curiosity, is telemetry data. We generally collect telemetry to improve our websites, our services and our visitor’s experiences.

Your website may have its own internal telemetry that tracks application health, or you may rely on third-party marketing or performance analytics libraries to collect data for you automatically.

An essential part of collecting telemetry is making sure that it is reliably sent (exfiltrated) so you can actually use it (in bulk).

In analytics terms, we often call sending telemetry beaconing, and the HTTPS payload that carries the data the beacon.

Beaconing Stages

Every time you collect some data, you should have a strategy for when you’re going to get that data out of the browser.

This sounds simple, but depending on the type of data you’re tracking, when you send it matters just as much as collecting it.

Let’s look at some common scenarios:

Sending Data at Startup

Sometimes, you just want to log that a thing happened. For example, you can log when a Page Load occurred and maybe include a few extra bits of details, like the URL that was loaded or characteristics of the browser.

As long as you’re not waiting on anything else, in this case, it makes sense to beacon immediately after the analytics code has loaded.

Many marketing analytics scripts, such as Google or Adobe Analytics fall into this bucket. As soon as their JavaScript libraries are loaded, they may immediately send a beacon noting that "this Page Load happened" with supporting details about the Page Load’s dimensions.

// pseudo code
function onStartup() {
    // gather the data
    sendBeacon();
}

Good for:

  • Quick marketing-level analytics
  • Highly reliable

Bad for:

  • Collecting any Page Load performance data
  • Measuring anything that happens after the page has loaded (e.g. user interactions or post-Load content)

Gathering Data through the Page Load

Some websites use Real User Monitoring (RUM) to track the performance of each Page Load. Since you’re waiting for the Page Load to finish, you can’t immediately send a beacon when the JavaScript starts up. Generally, you’ll need to wait for at least the Page Load (onload) event, and possibly longer if you have a Single Page App.

To do so, you would normally register for an onload handler, then send your data immediately after the onload event has finished.

Performance analytics libraries such as boomerang.js or SpeedCurve’s LUX will wait until the Page Load (or SPA Page Load) events before beaconing their data.

// pseudo code
function onStartup() {
    window.addEventListener('load', function(event) {
        // you may want to capture more data now, such as the total Page Load time
        gatherMoreData();

        sendBeacon();
    });

    // you could collect some details now, such as the page URL
    gatherSomeData();
}

Note: You may want to delay your beacon until slightly after onload to ensure your analytics tool doesn’t cause a lot of work at the same time other onload handlers are executing:

// pseudo code
function onStartup() {
    window.addEventListener('load', function(event) {
        // wait a little bit until Page Load activity dies down
        setTimeout(function() {
            // you may want to capture more data now, such as the total Page Load time
            gatherMoreData();

            sendBeacon();
        }, 500);
    });

    // you could collect some details now, such as the page URL
    gatherSomeData();

    // ALSO!  Have an unload strategy
}

Good for:

  • Gathering performance analytics

Bad for:

  • Measuring anything that happens after the page has loaded (e.g. user interactions or post-Load content)
  • Waiting only for the Page Load event means you will miss data from any user that abandons the page prior to Page Load
  • Make sure you have an unload strategy to capture abandons.

Incrementally Gathering Telemetry throughout a Page’s Lifetime

After the page has loaded, there may be user interactions or other periodic changes to the page that you want to track.

For example, you may want to measure how many times a button is clicked, or how long it takes for that button click to result in a UI change.

This type of on-the-fly data collection can often be exfiltrated immediately, especially if you’re tracking events in real-time:

// pseudo code
myButton.addEventListener('click', function(event) {
    sendBeacon();
});

You could also consider batching these types of events and sending the data periodically. This may save a bit of CPU and network activity:

// pseudo code
var dataBuffer = [];
myButton.addEventListener('click', function(event) {
    dataBuffer.push(...);
});

// send every 10 seconds if there's new data
setInterval(function() {
    if (dataBuffer.length) {
        sendBeacon(dataBuffer);
        dataBuffer = [];
    }
}, 10000);

Good for:

  • Real time event tracking

Bad for:

  • If you’re batching data, you should have an unload strategy to ensure it goes out before the user leaves

Gathering Data up to the End of the Page

Some types of metrics are continuous, happening or updating throughout the page’s lifecycle. You don’t necessarily want to send a beacon for every update to those metrics — you just want to know the "final" result.

One simple example of this is when measuring Page View Duration, i.e. how long the user spent reading or viewing the page. Sure, you could send a beacon every minute ("they’ve been viewing for [n] minutes!"), but it’s a lot more efficient to just send the final value ("they were here for 5 minutes!") once, when the user is navigating away.

If you’re interested in Google’s Core Web Vitals metrics, you should probably track Cumulative Layout Shift (CLS) beyond just the Page Load event. If Layout Shifts happen post-page-load, those also affect the user experience. CLS is a score that incrementally updates with each Layout Shift, so you shouldn’t necessarily beacon on each Layout Shift — you just want the final CLS value, after the user leaves the page.

Another example would be for the Measure Memory API, which lets you track memory usage over time. If your Single Page App is alive for 3 hours (over many interactions), you may only want to send one final beacon with how the memory behaved over that lifetime.

For these cases, your best bet is to listen for a page lifecycle indicator like the pagehide event, and send data as the user is navigating away. The specific events you want to listen for are a little complex, so read up on unload strategies later.

// pseudo code
var clsScore = 0;

// don't listen for just pagehide!  see unload strategies section
window.addEventListener('pagehide', function(event) {
    sendBeacon();
});

// Listen for each Layout Shift
var po = new PerformanceObserver(function(list) {
  var entries = list.getEntries();
  for (var i = 0; i < entries.length; i++) {
    if (!entries[i].hadRecentInput) {
      clsScore += entries[i].value;
    }
  }
});

po.observe({type: 'layout-shift', buffered: true});

Good for:

  • Continuous metrics that are updated over time, and you only want the final value

Bad for:

  • Real time metrics — these will be delayed until the user actually navigates away
  • Reliability — you will lose some of this data just because unload events aren’t as reliable, so have an unload strategy

"Whenever"

Sometimes you may want track metrics or events, but you don’t necessarily need to send the data immediately (because it doesn’t need to be Real Time data). In fact, it may be advantageous to delay sending until another beacon has to go out. For example, as a later beacon is flushed, you can tack on additional data as needed.

In this case, you may want to:

  • Send data on the next outgoing beacon, if any
  • Send batched data periodically, if desired
  • Send any un-sent data at the end of the page

To do this, you would use a combination of the strategies above — using queuing/batching and unload beacons.

Good for:

  • Minimizing beacon counts

Bad for:

  • Real-time metrics
  • Reliability — you will lose some of this data just because unload events aren’t as reliable, so have an unload strategy

How Many Beacons?

Depending on the data you’re collecting, and how you’re considering exfiltrating it, you may have the choice to send a single beacon, or multiple beacons. Each has its own advantages and disadvantages, from the client’s (browser’s) perspective, as well as the server’s.

A Single Beacon

A single beacon is the simplest way to send your data. Collect all of your data, and when you’re done, send out a single beacon and stop processing. This is frequently how marketing and performance analytics beacons are implemented, when sending the results of a single Page Load.

Good for:

  • Less processing (CPU) time in the client
  • Less network egress bytes (less protocol overhead of a single network request vs. multiple requests)
  • Easier on the back-end — all data relating to the user experience is in one beacon payload, so the server doesn’t have to stitch it back together later

Bad for:

  • Real-time metrics, unless you’re sending the beacon early in the Page Load cycle (immediately or at onload).
  • Capturing data after the beacon has been sent

Multiple Beacons

If you’re collecting data at multiple stages throughout the page lifecycle, or due to user interactions, you may want to send that data on multiple beacons.

The main downside to multiple beacons is that it costs more from several perspectives: more JavaScript CPU time building the beacons, more network overhead sending the beacons, more server CPU time processing the beacons.

In addition, depending on how the back-end server infrastructure is setup, you may want to "link" or "stitch" those beacons together. For example, let’s say you’re interested in tracking the Load Time of a Page, as well as the final Cumulative Layout Shift Score. You may send a beacon out at the onload event with the Load Time, but wait until the unload event to send the final CLS Score.

Later, when you’re analyzing the data, you may want to group or compare Page Load times with their final CLS Scores. To do that, you would need to link the beacons together through some sort of GUID, and probably spend time on the back-end joining those beacons together (at your database layer).

An alternative strategy, once the Page Load beacon arrives, is holding it in memory until the final CLS Score arrives, before "stitching" it together on the back-end and sending to the database as a "combined" beacon with all of the data of that Page Load Experience. Doing this would result in additional server complexity, memory usage, and probably less reliability. You’d also need to figure out what happens if one of the partial beacons never arrives (data gets lost in-transit all the time, and sometimes events like unload never fire).

If you’ll never be looking at or comparing the data from those multiple beacons, these concerns may not matter. But if you’re doing more advanced analytics where joining data from multiple beacons would be common, you should weigh the pros and cons of multiple beacons as part of your strategy.

Good for:

  • Real-time capturing/reporting of events, events don’t "wait" for a later beacon to be sent
  • Capturing data beyond a single event, throughout a Page Load lifecycle

Bad for:

  • Generally more processing time on the client (preparing the beacon)
  • Generally more network usage (HTTP protocol overhead, repeated dimensions or IDs to stitch to other beacons)
  • Generally more processing on the server (multiple incoming requests)
  • Harder to keep context of the same user experience together — multiple beacons may need to be "joined" for querying or held in-memory until they all arrive

Mechanisms

Once you’ve figured out when you’d like to send your beacon(s), and how many you’ll send, you need to convince the browser to send it. There’s at least 4 common APIs to send beacons: Image, XMLHttpRequest, sendBeacon() and Fetch API.

Image

The simplest method of beaconing data is by using a HTML Image, commonly called a "pixel". This is generally done via a HTTP GET request by creating a hidden DOM Image, setting its Image.url, and including your beacon data in the query string.

Often, the server will respond with a 204 No Content or a simple/transparent 1×1 pixel image.

var img = new Image();
img.src = 'https://site.com/beacon/?a=1&b=2';

You can’t include any data in the "body" of the Image, as you only have the URL (query string) to work with. This limits you to how much actual data can be sent, depending on both the browser and server configuration.

From the browser’s point of view, most modern browsers support URL lengths of at least 64 KB:

  • Chrome: ~ 100 KB
  • Firefox (3.x): >= 5 MB
  • Firefox (recent): ~ 100 KB
  • Safari 4, 5: >= 5 MB
  • Safari 13: ~ 64 KB
  • Mobile Safari 13: ~ 64 KB
  • Internet Explorer 6, 7: 2083 bytes
  • Internet Explorer 8, 9, 10, 11: >= 5 MB
  • Edge (EdgeHTML 20-44): >= 5 MB
  • Edge (Chromium 79+): ~ 100 KB
  • Opera (Presto <= 12): >= 5 MB
  • Opera (Chromium): ~ 100 KB

Notably small exceptions are Internet Explorer 6 and 7 (… does anyone still care?).

One thing to keep in mind is that serializing data onto the URL is usually inefficient. Strings need to be URI-encoded, which bloats the size of characters due to "percent encoding". Especially if you’re trying to tack on raw JSON, like this:

{"abc":123,"def":"ghi"}

It gets expanded on the URL by 69% to:

%7B%22abc%22:123,%22def%22:%22ghi%22%7D

You may be able to minimize this type of bloat by using compression or things like JSURL.

The browser’s URL limits are just part of the story. Most web servers also have their own max request URL size:

  • Apache: Defaults to 8190 bytes and can be increased via the LimitRequestLine directive
  • TomCat has a default limit of 8 KB, and can be increased up to 64 KB via maxHttpHeaderSize
  • Jetty has a default limit of 8 KB, and can be increased via requestHeaderSize
  • CDNs will have their own URL length limits, which are usually not configurable. Akamai, CloudFront and Fastly all seem to have limits around 8KB.
  • Users may have proxies installed that have their own limits

At the end of the day, it’s safest to limit Image beacon URLs to under 2,000 bytes, if you care about Internet Explorer 6 and 7. If not, you can probably go up to 8,190 bytes unless you’ve specifically configured and tested all of the parts of your CDN and server infrastructure.

I’m not specifically aware of any user proxies with URL limits, but my guess is there are some out there that may have limits around the same sizes (of 2 or 8 KB), so even if your server infrastructure supports longer request URLs, some users may not be able to send requests that long.

Image Beacon Pros:

  • Simplest API
  • Least amount of overhead
  • Largest browser support
  • Will not be rejected or delayed by CORS

Image Beacon Cons:

  • Does not support HTTP POST
  • Does not support any payload other than the URL
  • Does not support more than ~2 KB of data, depending on the browser
  • Not as reliable as sendBeacon()

XMLHttpRequest

Once the XMLHttpRequest (XHR) API was added to browsers, it created a way for developers to use the API to send raw data to any URL, instead of pretending we were fetching Images from everywhere.

XHRs are a lot more flexible than Image beacons. They can use any HTTP method, including POST. They can also include a body payload (of any Content-Type), so we can avoid the URL length concerns of Image beacons.

To avoid the CORS performance penalty of a OPTIONS Pre-Flight, you should make sure your XHR beacon is a simple request: only GET/POST/HEAD, no fancy headers, and a Content-Type of either:

  • application/x-www-form-urlencoded
  • multipart/form-data
  • text/plain

Make sure to review the fallback strategies in case XMLHttpRequest isn’t available, or if it fails.

XHR allows you to send data synchronously or asynchronously. There’s really no reason to send synchronous XHRs these days. Some websites used to send synchronous XHRs on unload to make sure the beacon data was sent prior to the browser closing the page. These days, you should use sendBeacon() instead for even more reliability and better performance.

Here’s an example of using XHR to send a beacon with multiple key-value pairs:

// data to send
var data = {
    a: 1,
    b: 2
};

// open a POST
var xhr = new XMLHttpRequest();
xhr.open('POST', 'https://site.com/beacon/');
xhr.setRequestHeader('Content-type', 'application/x-www-form-urlencoded');

// prepare to send our data as FORM encoded
var params = [];
for (var name in data) {
    if (data.hasOwnProperty(name)) {
        params.push(encodeURIComponent(name) + '=' + encodeURIComponent(data[name]));
    }
}

var paramsJoined = params.join('&');

// send!
xhr.send(paramsJoined);

XMLHttpRequest Beacon Pros:

  • Simple API
  • Supports HTTP POST and other methods
  • Supports a payload in the body of any content type
  • Supports any size payload (up to server limits)

XMLHttpRequest Beacon Cons:

  • May require consideration around CORS to avoid Pre-Flights
  • Not as reliable as sendBeacon()

sendBeacon

The navigator.sendBeacon(url, payload) API provides a mechanism to asynchronously send beacon data more performantly and reliably than using XMLHttpRequest or Image. When using the sendBeacon() API, even if the page is about to unload, the browser will make a best effort attempt to send the data. The request is always a HTTP POST.

sendBeacon() was built for telemetry, analytics and beaconing, and we should use it if available! According to caniuse.com, over 95% of browser marketshare supports sendBeacon() today (the end of 2020).

The API is fairly simple to use on its own, but has a few gotcha’s and limits.

First, the return value of navigator.sendBeacon() should be checked. If it returned true, you’ve successfully handed data off to the browser and you’re good to go! Note this doesn’t mean the data arrived at the server — you’ll never be able to see the server’s response to the beacon with the sendBeacon() API.

The sendBeacon() API will return false if the UA could not queue the request. This generally happens if the payload size has tripped over certain beacon limits that the browser has set for the page. Here’s what the Beacon API spec says about these limits:

The user agent imposes limits on the amount of data that can be sent via this API: this helps ensure that such requests are delivered successfully and with minimal impact on other user and browser activity. If the amount of data to be queued exceeds the user agent limit, this method returns false; a return value of true implies the browser has queued the data for transfer. However, since the actual data transfer happens asynchronously, this method does not provide any information whether the data transfer has succeeded or not.

In practice today, the following limits are observed:

  • Firefox does not appear to impose any limits
  • Chromium-based browsers and Safari have:
    • A payload size limit: this is defined in the Fetch API spec as 64 KB
    • An outstanding-beacon payload limit: if there are other navigator.sendBeacon() requests in progress (from any script), and the sum of their payload sizes is over 64 KB, the limit is breached
  • In Chrome versions earlier than 66, if the total size of previous calls to sendBeacon() was over 64 KB, subsequent calls would fail

Besides these limits, the URL itself could also contain data, and would adhere to the same URL limits seen in the Image beacon section.

If the navigator.sendBeacon() returns false, it means the browser will not be sending the beacon. If so, it’s best to fallback to XMLHttpRequest or Image beacons.

This sample code will check that sendBeacon() exists and works, and if not, fallback to XHR/Image beacons:

function sendData(payload) {
    if (window &&
        window.navigator &&
        typeof window.navigator.sendBeacon === "function" &&
        typeof window.Blob === "function") {

        var blobData = new window.Blob([payload], {
            type: "application/x-www-form-urlencoded"
        });

        try {
            if (window.navigator.sendBeacon('https://site.com/beacon/', blobData)) {
                // sendBeacon was successful!
                return;
            }
        } catch (e) {
            // fallback below
        }
    }

    // Fallback to XHR or Image
    sendXhrOrImageBeacon();
}

Note there are only 3 CORS safelisted Content-Types you can send:

  • application/x-www-form-urlencoded
  • multipart/form-data
  • text/plain

Any other content type will result in a CORS pre-flight for cross-origin requests, which isn’t desired for a beacon that you’re trying to get out reliably. So if you’re wanting to send application/json content to another domain, you may consider encoding it as just text/plain.

sendBeacon Pros:

  • Simple API, but beware of fallbacks
  • Most reliable
  • Should not be rejected or delayed by CORS (using the correct Content-Types)
  • Supports any size payload, though the browser may reject larger sizes (stick to under 64 KB)

sendBeacon Cons:

  • Calling it does not guarantee the API will "accept" the call — you may need to fallback to other metrics
  • Only supports HTTP POST
  • Supports only some Content Types to avoid CORS pre-flight

Fetch API

Similar to using an XMLHttpRequest, the modern fetch() API could be used to send beacons. If you’re already using Fetch in your app, you could use that interchangeably with XMLHttpRequest as a fallback.

In addition, there’s a recent Fetch API option called keepalive: true. This option is likely what sendBeacon() is using under the hoods in most browsers.

This is supported by Chrome 66+, Safari 11+, and is being considered by Firefox.

There are some caveats and limitations around using keepalive so I’d encourage you to review that issue if you’re using the Fetch API.

At this point, I’d suggest using sendBeacon() over the Fetch API.

Fallback Strategies

Not every beaconing method is available in every browser. You’ll want to try to fallback to older methods if sendBeacon() isn’t available:

Generally, use:

  1. sendBeacon() if available (for reliability) and if it returns true
  2. XMLHttpRequest (or Fetch API) if you need to use HTTP POST or have a body payload or if the data is > 2 KB
  3. Image otherwise

Payload

What does your data look like? How big is it?

Ideally, you should minimize the outgoing request size as much as possible to avoid overtaxing your visitor’s network. To do this, you could consider various forms of data minification or compression.

Limits

It would be wise to first look at your expected minimum, median and maximum payload size. This may dictate what kind of beacon you can send, i.e. Image vs XMLHttpRequest vs sendBeacon(), and whether any sort of minification/compression is needed.

Briefly:

  • If your data is under 2 KB, you can use any type of beacon, and probably don’t need to compress it
  • If your data is under 8 KB, you can use any type of beacon, but won’t support IE 6 or 7
  • If your data is under 64 KB, you can use sendBeacon() or XMLHttpRequest, and you may want to consider compressing it
  • If your data is over 64 KB, you can only use XMLHttpRequest, and you may want to consider compressing it

Payload via URL (Query String)

The simplest beacons can include all of their data in the Query String of a URL, i.e.:

https://mysite.com/beacon/?a=1&b=2...

As we saw with the Image beacon section, in practice this is limited to a total URL length of 2 KB (if you support IE 6/7) or 8 KB (unless your server infrastructure supports more).

One complication is that characters outside of the range below will need to be URI-encoded by encodeURIComponent:

A-Z a-z 0-9 - _ . ! ~ * ' ( )

Depending on your data, this could bloat the size of your URL significantly! You may want to consider JSURL or another compression technique to help offset this if you’re sticking to a URL payload.

Payload via Request Body

For XMLHttpRequest and sendBeacon calls, you’ll often specify the bulk of your data in the payload of the beacon (instead of the URL).

Common ways of encoding your beacon data include:

  • multipart/form-data via FormData, which is pretty inefficient for sending multiple small key-value pairs due to the "boundary" and Content-Disposition overhead:

    ------WebKitFormBoundaryeZAm2izbsZ6UAnS8
    Content-Disposition: form-data; name="a"
    
    1
    ------WebKitFormBoundaryeZAm2izbsZ6UAnS8
    Content-Disposition: form-data; name="b"
    
    2
    ------WebKitFormBoundaryeZAm2izbsZ6UAnS8--
  • application/x-www-form-urlencoded (via UrlSearchParams), which suffers from the same percentage encoding bloat as URLs if you have many non-alpha-numeric characters.
  • text/plain with whatever text content you want, if your server knows how to parse it

Any other content type may trigger a CORS pre-flight for cross-origin requests in XMLHttpRequest and sendBeacon.

Compression

You may want to consider reducing the size of your URL or Body payloads, if possible. There are always trade-offs in doing so, as minification/compression generally use CPU (JavaScript) to reduce outgoing byte sizes.

Some common techniques include:

  • Using a data-specific compression technique to reduce or minify data. We have some examples for data compression in Boomerang for ResourceTiming and UserTiming.
  • URL and application/x-www-form-urlencoded body payloads can benefit from being minified by JSURL, which swaps out characters that must be encoded for URL-safe characters.
  • The Compression Streams API could be used to compress large payloads for browsers that support it

Reliability

As described above, there are many different stages of the page lifecycle that you can send data. Often, you’ll want to send data during one of the lifecycle events like onload or unload.

Browsers give us a lot of lifecycle events to listen to, and depending on which of these events you use, you may be more-or-less likely to receive data if you send a beacon then.

Let’s look at some examples, and find a strategy for when to send our beacons, so we can have the best reliability of the data reaching our servers.

Methodology

I recently ran a study on one of my websites, collecting data over a week from a large set (millions+) of Page Loads.

For each of these visitors, I sent multiple beacons: as soon as the page started up, at onload, during unload and several other events.

The goal was to see how reliable beaconing is at each of those events, and to see what combination of events would be the most reliable way to receive beacons.

The percentages below reflect how frequently a beacon arrived if sent during that event, as compared to the "startup" beacon that was sent as soon as the page’s <head> was parsed.

This test was done on a single site so results from other sites will differ.

Page Load (onload) Event

Besides sending a beacon as soon as the page starts up, the most frequent opportunity to send data is the window load event (aka onload).

onload event

When sending data just at onload, beacons arrive only 86.4% of the time (on this site).

This of course varies by browser:

onload event - by browser

A large percentage of those "missing" beacons are due to page abandons, i.e. when the visitor leaves before the onload event has fired.

This abandon rate will vary by site, but for this particular site, nearly 14% of visits would not be tracked if you only listened to onload.

Thus, if your data requires waiting until the onload event, you should also listen to page lifecycle "unload" events, to get the opportunity to send a beacon if the user is leaving the page. See avoiding abandons below.

Delayed Page Load (onload) Event

Sometimes, you may not want to send data immediately at the onload event. It could make sense to wait a little bit.

You could consider waiting a pre-defined amount of time, say 1 or 5 or 10 seconds after onload before sending the beacon.

Alternatively, if you have page components that are delay-loaded until the onload event, you may want to wait until they load to measure them.

Any amount of time you’re waiting beyond the Page Load will decrease beacon rates, unless you’re also listening to unload events (see below).

For example, artificially adding a delay after onload before sending the beacon resulted in a clear drop-off of reliability:

Waiting N seconds after onload to send a beacon

Again, these rates are if you only listen to the onload (and send a beacon N seconds after that) — you’d ideally pair this with avoiding abandons below to make sure you send a beacon if the visitor leaves first.

Unload Events

There are several events that are all related to the page "unloading", such as visibilitychange, pagehide, beforeunload, and unload. They are all used for specific purposes, and not all browsers support each event.

unload and beforeunload are two events that are fired as the page is being unloaded:

  • beforeunload happens first, and gives JavaScript the opportunity to cancel the unload
  • unload happens next, and there is no turning back

While the unload and beforeunload events have been with us since the beginning of the web, they’re not the most reliable events to use for beaconing:

onload event

The unload event is significantly more reliable than the beforeunload event. This discrepancy is primarily due to browser differences:

unload event - by browser
beforeunload event - by browser

Notably, on Safari Mobile, beforeunload is not fired at all (while unload is).

pagehide and visibilitychange are more "modern" events:

  • visibilitychange can happen when a user switches to another tab (so the current tab is not unloading yet). This may not be the time you want to send a beacon, as a change to hidden doesn’t preclude the page coming back to visible later — the user hasn’t navigated away, just gone away (possibly) temporarily. But it’s possibly the last opportunity you’ll have to send data, so it’s a good time to send a beacon if you can.
  • pagehide was introduced as a more reliable "this page is going away" event than the original unload events, which have some caveats and scenarios where they aren’t expected to fire.

Here’s how often beacons sent during those events arrived:

onload event

As seen above, we find pagehide (the modern version of unload) to be slightly more reliable than unload (74.8% vs. 72.2%). visibilitychange (hidden) alone doesn’t send beacons as often, but if combined with pagehide events, we’re up to 82.3% reliability which is superior to the combined 73.4% of beforeunload|unload.

By browser:

pagehide event - by browser
visibilitychange event - by browser

Not coincidentally, listening for these two events pagehide and visibilitychange to save state or to send a beacon is the recommendation from Ilya Grigorik from back in 2015. This is still a great recommendation. However, if you’re sending only a single beacon (and not just saving state), I recommend considering the trade-offs of attempting to beacon earlier in the process.

Below are all of the unload-style events in a single chart. If for some reason you want to listen to all of these events, you gain the most reliability (82.94%):

onload event

Listening to all events gives you 0.64% more reliability (82.94%) than just pagehide/visibilitychange (at 82.3%).

However, there is a major downside to registering for the unload handler: it breaks BFCache in Chrome , Safari and Firefox! BFCache is a browser performance optimization that’s been available in Firefox and Safari for a while, and was recently added to Chrome 86+. The beforeunload handler also breaks BFCache in Firefox.

Depending on your site (or if you’re a third-party analytics provider), you should consider the trade-off of more beacons vs. breaking BFCache when deciding which events to listen for.

Note: Not all browsers support pagehide or visibilitychange, so you’ll want to detect support for those and if not, fallback to listening for unload and beforeunload as well.

Wrapping this all together, here’s my recommendation for listening for unload-style events to get the most reliability:

// pseudo-code

// prefer pagehide to unload events
if ('onpagehide' in self) {
    addEventListener('pagehide', sendBeacon, { capture: true} );
} else {
    // only register beforeunload/unload in browsers that don't support
    // pagehide to avoid breaking bfcache
    addEventListener('unload', sendBeacon, { capture: true} );
    addEventListener('beforeunload', sendBeacon, { capture: true} );
}

// visibilitychange may be your last opportunity to beacon,
// though the user could come back later
addEventListener('visibilitychange', function() {
    if (document.visibilityState === 'hidden') {
        sendBeacon();
    }
}, { capture: true} );

Avoiding Abandons

If your primary beaconing event is the Page Load (onload) event, but you want to also respond to users abandoning the page before the page reaches onload, you’ll want to combine listening for both onload and Unload events.

When the page is abandoned prematurely, the page may not have all of the data you track for "full" navigations. However, there are often useful things you’ll still want to track, such as:

  • That the Page Load happened at all
  • Characteristics of the page, user, browser
  • What "phase" of the Page Load they reached

Combining onload plus the two recommended Unload events pagehide and visibilitychange (hidden) gives you the best possible opportunity for tracking the Page Load:

Avoiding Abandons

By listening to those three events, we see beacons arriving 92.6% of the time.

This rate:

  • Decreases by just 0.6% to 92.0% if you don’t listen for visibilitychange (if you don’t want to beacon if the user might come back after a tab switch)
  • Increases by just 0.2% to 92.8% if you listen for beforeunload (which would break BFCache in Firefox)
  • Does not increase in any meaningful way if you also listened for unload (which breaks BFCache anyway).

By browser:

Avoiding Abandons

Notably Safari and Safari Mobile seem less reliably for measuring, likely due to not firing the pagehide and visibilitychange events as often.

So if your primary use case is just sending out one beacon by the onload (or Unload) event:

// pseudo-code

// prefer pagehide to unload event
if ('onpagehide' in self) {
    addEventListener('pagehide', sendBeacon, { capture: true} );
} else {
    // only register beforeunload/unload in browsers that don't support
    // pagehide to avoid breaking bfcache
    addEventListener('unload', sendBeacon, { capture: true} );
    addEventListener('beforeunload', sendBeacon, { capture: true} );
}

// visibilitychange may be your last opportunity to beacon,
// though the user could come back later
addEventListener('visibilitychange', function() {
    if (document.visibilityState === 'hidden') {
        sendBeacon();
    }
}, { capture: true} );

// send data at load!
addEventListener('load', sendBeacon, { capture: true} );

// track if we've sent this beacon or not
var sentBeacon = false;
function sendBeacon() {
    if (sentBeacon) {
        return;
    }

    // 1. call navigator.sendBeacon or XHR or Image
    // 2. cleanup after yourself, e.g. handlers

    sentBeacon = true;
}

One Beacon Trade-offs

Many analytics scripts prefer to send a single beacon. Taking boomerang as an example, we measure the performance of the user experience up to the Page Load (onload) event, and attempt to send our performance beacon immediately afterwards.

There are some continuous performance metrics, such as Cumulative Layout Shift (CLS) where it may be desirable to continue measuring the metric throughout the page’s lifetime, right up to the unloading of the page. Doing so would track the "full page" CLS score, instead of just the CLS score snapshotted at the onload event.

There’s an inherent trade-off when trying to decide to send a beacon immediately (at onload) instead of waiting until the unload event. Sending earlier is better for reliability, sending later is better for measuring "more" of the user experience.

Through this study we were able to quantify what this trade-off is (at least for the study’s website):

So the "cost" of sending a single beacon at Unload instead of Page Load is about 10% of beacons don’t arrive. Depending on your priorities, that decrease in beacons may be worth measuring for "longer" before you send your data?

One important thing to remember when some beacons don’t arrive is that their characteristics may not be evenly distributed. In other words, those 10% of beacons may be more frequently "good" experiences, or "bad" experiences, or a particular class of devices or browsers. Those missing beacons aren’t a representative sample of the entire class of visitors, and could be hiding some real issues!

Bringing it back to Ilya’s advice about saving app state via the unloading events: this is still suitable if you’re saving app state or sending multiple beacons, but I’d suggest considering the reliability drop-off of not sending the beacon earlier, depending on the data you’re measuring.

Advanced Techniques

If your goal is to capture as many user experiences as possible, there are a few more things you can try.

Persisting Beacon Data in Local Storage

If your goal is to send a single beacon, and you want to wait as long as possible to send it, you may want to only register for Unload events.

Since not beaconing earlier has a trade-off of being less reliable, you could consider temporarily storing your upcoming beacon data into localStorage until you send it.

If your Unload events fire properly and you’re able to send a beacon, great! You can remove that data from localStorage too.

However, if your application starts up and finds orphan beacon data from a previous Page Load, you could send it on that page instead.

This works best if you’re concerned about losing data for users navigating across your site — obviously if a user navigates away to another website, you may never get the opportunity to send data again (unless they come back later).

Service Workers

You could also consider using a ServiceWorkers as a "network buffer" for your beacon data.

If you’re goal is to send a single beacon but want to wait until as late as possible, you can reduce some of the reliability trade-offs by "sending" the data to a ServiceWorker for the domain, and letting it transmit at its leisure.

You could have a communications channel with your ServiceWorker where you keep updating its beacon data throughout the page’s lifetime, and rely on the ServiceWorker to send when it detects the user is no longer on the page

The reason this works is often a ServiceWorker will persist beyond the page’s lifetime, even if the user navigates to another domain entirely. This won’t work if the browser is closed (or crashes), but ServiceWorkers often live a little beyond the page unload.

Using a ServiceWorker would be best suited for first-party beacons (i.e. capturing data on your own site) — most third-party analytics tools would have a hard time convincing a domain to install a ServiceWorker just to improve their beacon reliability.

Misc

Cleanup

After you’ve successfully sent your data, it’s a good opportunity to consider cleaning up after yourself if you don’t anticipate any additional work.

For example, you could:

  • Remove any event listeners, such as click handlers or unload events
  • Discard any shared state (local variables)

You may not need to do this if you’re sending a beacon as the result of an unload event firing, but if you’re sending data earlier in the Page Load process, make sure you JavaScript won’t continue doing work even though it’ll never send a beacon again.

During Prerender or when Hidden?

You should consider whether it makes sense for you to send a beacon if the user hasn’t seen the page yet.

The most likely scenario is when the page is loaded completely hidden. This can happen when a user opens a link into a new (background) tab, or loads a page and tabs/switches away before it loads.

Is this experience something you want to track? Does the experience matter if the user never saw the page? If you do want to send a beacon, do you send it at onload or wait until the page becomes visible first? These are all questions you should consider when capturing telemetry.

In Boomerang for example, we still measure those "Always Hidden" user experiences (where the user never sees the page before onload), and send a beacon right away. However, the beacon is also tagged with a special parameter, so the back-end (like mPulse) can "bucket" those user experiences so they can be excluded (or reviewed independently) from regular Page Loads.

There used to be some user agents that would also implement a "prerender" mode, but that was abandoned a few years ago. There’s a new privacy-focused prerender proposal that may come back at some point that you should consider similar to the "hidden" case above.

The Future

Because of the limitations we mentioned in this article around the trade-offs for a "one beacon" approach versus its reliability, there have been recent discussions around using something like the Reporting API as a better "beacon data queuing mechanism" that would reliably send your beacon data when the user leaves the page.

You can see a presentation from Yoav Weiss from this year’s 2020 W3C WebPerf TPAC event.

This could enable better capturing of continuous metrics (like CLS) via a single beacon sent just at the end of the Page Load in a reliable way.

Hoping the discussion continues!

TL;DR Summary

There are many reason why and when you may want to send beacons, but here are some high level tips:

  • Use navigator.sendBeacon() when possible, but listen to its return codes and fallback to XMLHttpRequest or Image beacons when needed
  • Send your beacon(s) as early as possible to ensure as many can reach your endpoints
  • If you’re waiting for a specific event to send your beacon, like Page Load, make sure you also have an abandonment strategy
  • There are several browser events that happen near the unloading of a page — listen to pagehide and visibilitychange (hidden) (and not unload or beforeunload which can break BFCache)
  • Be aware of your content and look for ways of minimizing payload size via compression or other means if it makes sense

Finally, we started this research by looking into our own beaconing strategy in Boomerang. We’ve found a few key changes we should make:

  • We currently listen for the unload and beforeunload events to try to make sure we capture all abandons/unloads. This is not only unnecessary (it does not meaningfully increase reliability rate), it also breaks BFCache in nearly all modern browsers
  • We do not currently listen for visibilitychange (hidden) to send our beacon, and we should consider it as it would increase our reliability (by 0.6% points)
  • Boomerang generally sends its Page Load beacon right at onload if possible, as we were concerned with losing measurements if we waited later. This study found we’d miss around 10% of all Page Loads if we only sent our beacon during Unload instead. This may be a tradeoff some RUM customers want, so we can add that as an option.

Cumulative Layout Shift in the Real World

October 9th, 2020

Table of Contents

Introduction

This is a companion post to Cumulative Layout Shift in Practice, which goes over what Cumulative Layout Shift (CLS) is, how it can be measured in lab (synthetic) and real-world (RUM) environments, and why it matters.

This article will review real world Cumulative Layout Shift data, taken by analyzing billions of individual page load experiences collected via Akamai mPulse’s RUM performance analytics. It is written from the point of view of an author of Boomerang and an employee working on mPulse, which measures CLS via the Boomerang JavaScript RUM library.

Real World Data

What do Cumulative Layout Shift scores look like in the real world?

The boomerang.js JavaScript RUM library has support for capturing Cumulative Layout Shift in version 1.700.0+. Boomerang measures CLS up to the Page Load or SPA Page Load event, as well as for each SPA Soft Navigation.

Akamai’s mPulse RUM product uses boomerang.js to gather performance metrics for Akamai’s customers.

As part of their Core Web Vitals, Google recommends a CLS score under 0.1 for a Good experience, and under 0.25 for Needs Improvement. Anything above 0.25 falls under the Poor category. They explain how they came up with these thresholds in a blog post with more details.

Google's Suggested CLS Values

Across the Web

Let’s take a look at a sample of the Cumulative Layout Shift distribution over all mPulse websites. This histogram reflects hundreds of millions of page load experiences captured over a week in September 2020:

CLS all Akamai mPulse websites

We see what looks like a logarithmic distribution with higher occurrences of CLS near 0.00 and a long tail out towards 2.0+. Note all CLS values over 2.0 are limited to 2.0 for these graphs.

Some interesting findings from this dataset:

  • 7.5% of page loads have CLS scores of 0.00 to 0.01 (the most common bucket)
  • 50% of page loads have CLS under 0.10 (the median)
  • 75% of page loads have CLS under 0.28 (what Google recommends to measure at)
  • 90% of page loads have CLS under 0.63
  • 95% of page loads have CLS under 0.93
  • 99% of page loads have CLS under 1.60
  • 0.5% of page loads have CLS over 2.00

There also seems to be a strange spike around 1.00 — I wonder if there’s a common scenario or type of website that shifts all visible content once? I hope to investigate this more later.

The 75th percentile (which Google recommends measuring at) shows a CLS score of 0.28 for these websites — just outside of the Needs Improvement range (0.1 to 0.25), and in to the Poor bucket (0.25 and higher). Luckily the median experience is at 0.10, right at the edge of the threshold for Good experiences (according to Google).

Note that all of the data you see in the chart above (and sections below) will be biased towards the websites mPulse measures, which skews more towards North America and European websites, across retail, financial and other sectors. It is not a representative sample of all websites.

This data may also be biased towards the higher-traffic websites that mPulse measures (it is not normalized by traffic rates).

By Industry

Let’s break down Cumulative Layout Shift by industry.

For these charts, we’re taking a sample of at least 5 websites for each industry, split by the top-level categories of Retail, News and Travel:

CLS Retail
CLS News
CLS Travel

These three graphs highlight how different industries (and for that matter, different websites) may have different page styles, and as a result, different user experiences.

These sample Retail websites show a relatively smooth logarithmic decrease from 0.00 towards 2.00. The 75th percentile user experience is 0.23 — in the Needs Improvement bucket, but better than the other sectors.

These sample News websites look similar to Retail, but also have a few spikes of data around 0.10 (and a smaller one at 1.00). The 75th percentile user experience is at 0.29, and it appears these experiences shift more towards the Poor bucket than Retail.

These sample Travel websites show a much different distribution, with spikes at a lot of different score buckets. These sites have a 75th percentile CLS score of 0.41, which is worse than the other two industries. In fact, this is the only sector with a median (0.29) in the Poor category.

(Obviously, the exact websites that go into each of these samples will have a dramatic effect on the shape of the graphs, but we tried to use similarly sized and traffic’d websites so one particular website doesn’t overly skew the data.)

By Page Group

A Page Group, for a specific website, is a set of pages with a common design or layout. Common Page Groups might be called Home, Product Page, Product List, Cart, etc. for a Retail website.

Each Page Group may be constructed differently, with varying content. While we can’t really compare Page Groups across different websites, it can be interesting to see how dramatically Cumulative Layout Shift scores may differ by Page Group on a single website.

For this example Retail website, we can see CLS scores for two unique Page Groups. The first Page Group shows a majority of Good experiences, while the second Page Group has mainly Poor experiences:

Example CLS Distribution - Page Group 1

Example CLS Distribution - Page Group 2

When looking at CLS for a website, or your website, make sure you understand all of the experiences going into the reported value, and that you have enough data to be able to target and reduce the largest factors of that score.

Desktop vs. Mobile

Breaking down CLS from all mPulse websites by device type shows slightly different curves:

CLS Desktop

CLS Mobile

Desktop CLS scores are skewed more towards 0.00 and logarithmically decrease towards 2.0+, while mobile CLS scores still have a spike around 0.00 but have additional peaks around 0.01 and drop off more slowly towards 1.00.

There’s also a noticeable spike for mobile CLS around 1.0, which we don’t see as pronounced in desktop. Maybe there is a subset of mobile pages or ads or widgets that shift all content at once?

The 75th percentile CLS for mobile (0.39) is notably worse than for desktop (0.23), and are in different ranking buckets (Poor vs. Needs Improvement). Mobile websites are often built differently than desktop layouts, but it’s a shame mobile users see such an increase in layout shifts. Shifting content can be frustrating and cause users to loose their place or mis-click on the wrong content, and those frustrations can be amplified on smaller screens.

vs. Bounce Rate

How does Cumulative Layout Shift affect Bounce Rate?

Bounce Rate is a measure of whether your visitors bounce (leave) after visiting a single page. Any user that visits two or more pages is considered a non-Bounce.

Since the first page will help decide whether the user navigates elsewhere, let’s take a look at Landing Page Cumulative Layout Shift vs. that user’s Bounce Rate (whether they left the site after the first page or not).

The theory is that if a user has a high Cumulative Layout Shift (i.e. negative experience) on the first page, they may be more likely to bounce.

Here’s one example Retail website. CLS (from 0.0 to 2.0 max) is on the X axis, Bounce Rate (as a percentage of users who bounced after one page at that CLS) on the Y axis. The size of the circle is the relative number of data points for that bucket:

Landing Page CLS vs. Bounce Rate Retail 1

We can see correlation (ρ=0.74) between Cumulative Layout Shift and Bounce Rate. There are obviously outliers, but the Poor (> 0.25) CLS scores generally increase Bounce Rate as the CLS increases.

Here’s a second retail website, which seems to show a similar correlation (ρ=0.83) to Bounce Rate:

Landing Page CLS vs. Bounce Rate Retail 2

Let’s look at a different sector of websites. Here’s a News website that shows less of a correlation (ρ=0.53):

Landing Page CLS vs. Bounce Rate News

(note the Y scale has changed)

The lowest CLS scores (Good experiences) show a relatively low Bounce Rate. As soon as the CLS goes out of the range of Good (0.1) towards Needs Improvement (0.25) and beyond, Bounce Rate stays relatively the same.

For this site, why doesn’t the Bounce Rate change much as the CLS increases? Honestly, I’m not sure, though if I had time I could dig into the data. It’s possible the lowest-CLS experiences are pages that entice the user to stay more.

For the retail websites, obviously CLS is just one measure of the user experience, and we just see a correlation with Bounce Rate. Improving CLS alone may not improve bounce rates. It’s probable that some of the lower-bouncing pages have lower CLS because of how they’re designed. Or, those lower-CLS pages are crafted “landing pages” that try to get the visitor to go to more pages on the site.

It’s also possible other factors like ad-blockers are affecting things here — maybe an ad-free non-shifting user experience keeps visitors longer? It would take a bit more research into the specific sites to understand this better.

vs. Session Length

Similar to Bounce Rate, Session Length is a measure of how many pages a visitor accesses over a specific period of time (e.g. 30 minutes).

Here’s the same retailer’s Session Length vs. Landing Page CLS. Like how Bounce Rate increased with CLS, let’s look to see if the Session Length decreases with higher CLS scores:

Landing Page CLS vs. Session Length Retail 1

As expected, the higher the Landing Page Cumulative Layout Shift, the fewer number of pages those visitors go to.

As we saw before with the same News website, lower CLS values seem to give a slightly higher Session Length (e.g. more pages were visited) for Good experiences, but the drop in Session Length isn’t as pronounced for higher CLS scores (the difference between ~1.5 and ~2.0 pages per Session).

Landing Page CLS vs. Session Length Retail 1

Also note this graph is just comparing the Landing Page CLS score — i.e. their first experience on the site — not the subsequent CLS scores from additional pages.

This data just shows a correlation, not causation. When looking at data like this, try to consider what is causing the shifts in the first place. Was it ads? Social widgets? Removing the content that causes the shifts will help multiple aspects of performance, including network activity, runtime tasks, layout shifts, and more.

vs. Page Load Time

Does Cumulative Layout Shift correlate with Page Load times?

Using Boomerang, we can collect Page Load times (for regular and Single Page Apps) as well as the Cumulative Layout Shift score (at the time of the load).

Here’s a plot of hundreds of millions of CLS score buckets versus the median Page Load times:

CLS vs. Page Load Time

There appears to be strong correlation (ρ=0.84) for Cumulative Layout Shift increasing with increased Page Load time.

Intuitively, I would expect this to be the case — the more content that is added to a page (which increases its Load Time), the more likely that content will cause layout shifts.

Again, this is just showing a correlation. Some layout shifts may be caused by simple layout inefficiencies or bugs. Other layout shifts may be directly caused by third-party content, which is also increasing Page Load time.

vs. Rage Clicks

Does Cumulative Layout Shift correlate with Rage Clicks?

Using Boomerang, we can collect Rage Clicks, which are a measure of how commonly a visitor clicks the same area repeatedly. One of the cases where this may happen is when a website stops reacting to user input, and the user repeats the same clicks in the same region.

Here’s a plot of hundreds of millions of CLS score buckets versus average Rage Clicks per page:

CLS vs. Page Load Time

We again see a decent correlation (ρ=0.77) between Cumulative Layout Shifts and Rage Clicks.

There is a strange spike of Rage Clicks around CLS values of ~0.10, and I haven’t had a chance to investigate why. That could be an over-representation of some website that has a lot of CLS values around 0.10 and higher Rage Click occurrences. Or it could be a common design pattern or widget/ad that is causing issues! Something to dig into in the future.

Rage Clicks can frustrate your users, and cause them to bounce. Even if you’re not measuring Rage Clicks directly, your CLS scores may give a hint toward how often it happens. It’s intuitive that the worst CLS scores (over 1.0) have a strong correlation with users (mis)clicking, if content is shifting around a lot.

What’s Next

Cumulative Layout Shift is still a relatively new metric for websites to measure. At mPulse, we capture billions of performance metrics a day, and there are still are a lot of aspects of CLS that we haven’t dug into yet. Over time, I hope to share more insights and graphs around CLS (and other performance metrics) in this post or others.

Being a relatively new metric, there is still a lot of opportunity to understand how closely CLS reflects the user experience. From the above data, we see correlations with business and performance metrics, but on its own, CLS scores may just be a side effect of how the rest of the site is built and the third party components or ads you include. If you’re interested in improving your own CLS score, you really need to dig into your own data and use developer tools to find and fix the shifts.

If you want to learn more about CLS in general, you can read the companion post Cumulative Layout Shift in Practice.

If you have any interesting insights into your own CLS data, please share below!

Cumulative Layout Shift in Practice

October 9th, 2020

Table of Contents

Introduction

Cumulative Layout Shift (CLS) is a user experience metric that measures how unstable content is for your visitors. Layout shifts occur when page content moves after being presented to the user. These unexpected shifts can lead to a frustrating visual and user experience, such as misplaced clicks or rendered content being scrolled out of view.

Trying to read or interact with a page that has a high CLS can be a frustrating experience! A common example of layout shifts occurs when reading an article on a mobile device, and you see your content jumping up or down as ads are dynamically inserted when you scroll:

Layout Shifts while reading content

Cumulative Layout Shift is a measure of how much content shifts on a page, and is one of Google’s Core Web Vitals metrics, so there has been a lot of attention on it lately. It will soon be used as a signal in Google’s Search Engine Optimization (SEO) rankings, meaning lower CLS scores may give higher search rankings.

As of September 2020, Cumulative Layout Shift is part of a draft specification of the Web Platform Incubator Community Group (WICG), and not yet a part of the W3C Standards track. It is only supported in Blink-based browsers (Chrome, Opera, Edge) at the moment.

This article will review what Cumulative Layout Shift is, how it can be measured in lab (synthetic) and real-world (RUM) environments, and why it matters. A companion post dives into what CLS looks like in the real world by looking at mPulse RUM data.

This article is written from the point of view of an author of Boomerang and an employee working on Akamai’s mPulse RUM product, which measures CLS via the Boomerang JavaScript RUM library.

What is Cumulative Layout Shift?

Cumulative Layout Shift is a score that starts at 0.0 (for no unexpected shifts) and grows incrementally for each unexpected layout shift that happens on the page.

The score is unitless and unbound — theoretically, you could see CLS scores over 1.0 or 10.0 or 100.0 on highly shifting pages. In the real world, 99.5% of CLS scores are under 2.0.

As part of their Core Web Vitals, Google recommends a CLS score under 0.10 for a Good experience, and under 0.25 for Needs Improvement. Anything above 0.25 falls under the Poor category. They explain how they came up with these thresholds in a blog post with more details.

Google's Suggested CLS Values

Note that Google’s recommended CLS value of 0.10 is for the 75th percentile of your users on both mobile and desktop.

For this blog post, we will generally use Google’s recommended thresholds above when talking about Good, Needs Improvement, or Poor categories.

Importantly, just like any performance metric, Cumulative Layout Shift is a distribution of values across your entire site. While individual synthetic tests (like WebPagetest or Lighthouse) may only measure a single (or few) test runs, when looking at your CLS scores from the wild in RUM data, you may have thousands or millions of individual data points. CLS will be different for different page types, visitors, devices, and screens.

Let’s say, through some sort of aggregate data (like mPulse RUM or CrUX), you know that your site has a Cumulative Layout Shift score of 0.31 at the 75th percentile.

Here’s what that distribution could look like:

Example CLS Distribution

The frequency distribution above shows real data (via mPulse) for a retail website over a single day, comprising of 7+ million user experiences. Note that while the 75th percentile is 0.31 (Poor), the median (50th percentile) is 0.16 (Needs Improvement).

The distribution is not normal, and shows that there are a few “groups” of common CLS scores, i.e. around 0.00, 0.10, 0.17 and 1.00. It’s possible those humps represent different subsets of the data, such as different device types or page groups.

For example, let’s breakdown the data into Desktop vs. Mobile:

Example CLS Distribution - Desktop

Example CLS Distribution - Mobile

As you can see, your experience varies by the type of device that you’re on.

Desktop users have a lot of CLS scores between 0.0 and 0.4, with a small bump around 1.0.

Mobile users have some experiences around 0.0, a spike at 0.06-0.10, then a fairly even distribution all the way to 1.0.

Of course, different parts of a website may be constructed differently, with varying content. Reviewing CLS scores for two unique page groups shows a Good experience for the first type of page, and a lot of Poor experiences for the second type of page:

Example CLS Distribution - Page Group 1

Example CLS Distribution - Page Group 2

All of this is to say, when looking at CLS for a website, make sure you understand all of the experiences going into the reported value, and that you have enough data to be able to target and reduce the largest factors of that score.

Why is it important?

Why does Cumulative Layout Shift matter?

CLS is one measurement of the user experience. There are many ways your website can frustrate or delight your users, and CLS is a measurement that may highlight some of those negative experiences.

A bad (high) CLS score may indicate that users are seeing content shift and flow around as they’re trying to interact with your site, which can be frustrating. Users who get frustrated may leave your site, and never come back!

Some of those frustrating experiences may be:

  • Reading an article and having the content jump down below the viewport, causing the visitor to lose their place (see demo at the start of this article)
  • Mis-clicking or clicking the wrong button:
Mis-click demo

See the data below in the real-world data section for how Cumulative Layout Shift correlates with other performance and business metrics, such as Bounce Rate, Session Length, Rage Clicks and more.

In some ways, Cumulative Layout Shift is more of a user experience / web design metric than a web performance metric. It measures what the user sees, not how long something takes.

It’s good for the websites to move away from just measuring network- and DOM-based metrics and towards measuring more of the overall user experience. We need to understand what delights and frustrates our users.

Finally, Google is putting their weight behind the metric and will be using it as a signal in Google’s Search Engine Optimization (SEO) rankings. Search ranking have a direct impact on visitors, and a lot of attention has been going into CLS as a result.

Definition

The Cumulative Layout Shift score is a sum of the impact of each unexpected layout shift that happens to a user over a period of time.

Multiple Layout Shifts

Only shifts of visible content from within in the viewport matter. Content that moves below the fold (or currently scrolled viewport) does not degrade the user experience.

As a visitor loads and interacts with a site, they may encounter these layout shifts. The sum of the “scores” of each individual layout shift results in the Cumulative Layout Shift score.

To calculate the score from an individual layout shift, we need to look at two components of that shift: its impact fraction and distance fraction.

The impact fraction measures how much of the viewport changed from one frame (moment) to the next.

CLS - Impact Fraction

In the above screenshot, the green frame shows the portion of the viewport changing from the previous frame.

The distance fraction measures the greatest distance moved by any of those unstable elements, as a portion of the viewport’s size.

CLS - Distance Fraction

In the above screenshot, the blue arrow shows the distance fraction (from the new Ads/Widgets coming in).

Multiplied together, you get a single layout shift score:

layout shift score = impact fraction * distance fraction

Each layout shift is then accumulated into the Cumulative Layout Shift score over time.

Both HTML Elements (such as images, videos, etc.) as well as text nodes may be affected by layout shifts. Under discussion is whether some types of hidden elements (such as visibility:hidden) would be considered.

For further details, the web.dev article on CLS has a great explanation on how CLS is calculated as well.

When does it End?

The point at which individual layout shifts stop being added to the Cumulative Layout Shift score may differ depending on what you or your tool is measuring.

Tools may measure up to one of the following events:

  • When the browser’s onload event fires
  • For Single Page Apps (SPAs), when all SPA content is loaded
  • For the life of the page (even after the user interacts with the page)

When does CLS end?

If your main concern is just the Page Load experience, you can accumulate layout shifts into the Cumulative Layout Shift score until the browser’s onload event fires (or a similar event for Single Page Apps).

These onload (and SPA “load”) events are measuring until a pre-defined and consistent phase of the page load. Once that phase has been reached (e.g. most/all content is loaded), the Cumulative Layout Shift score accumulated from the start of the navigation through that event is finalized.

This type of “load-limited” Cumulative Layout Shift is often what pure synthetic tools such as Lighthouse or WebPagetest measure, in the absence of any user interactions on the page. RUM tools, such as Boomerang.js also generally send their beacon right after the load events, so will stop their CLS measurements there.

Alternatively, CLS can be measured beyond just the “load” event, continually accumulating as the user interacts on the page. Layout shifts that happen after the result of scrolling (e.g. dynamic ad loads) can be especially frustrating users. It’s worthwhile measuring the page’s entire lifetime CLS if you can. You would generally accumulate layout shifts until something like the visibilitychange event (when the page goes hidden or unloads).

As a result, these “page lifetime” CLS scores will likely be higher than “load-limited” CLS scores. See the RUM vs. Synthetic section for more details on why different tools may report a different CLS.

If your page is a Single Page App (SPA), it’s probably best to “restart” the Cumulative Layout Shift score each time an in-page (“Soft”) SPA navigation starts. This way the score will reflect each view change and will not just keep growing indefinitely as users interacts with the page over time. More details in the SPA section.

Single Page Apps (SPAs)

Measuring the user experience in a Single Page App (SPA) is a unique challenge. SPAs rewrite and may completely change the DOM and visuals as the user navigates throughout a website.

For example, when Boomerang is on a SPA website with SPA monitoring enabled, it takes additional steps to measure the page’s performance and user experience:

  • Instead of waiting for just the onload event to gather performance data, it waits for the dynamic visual content to be fetched. This is called a “SPA Hard Navigation“.
  • Boomerang monitors for state and view changes from the SPA framework as the user clicks around, and tracks the resources fetched as part of a “SPA Soft Navigation”

Both types of SPA navigations can shift content around on the page, potentially causing unexpected layout shifts. The definition of Cumulative Layout Shift actually excludes content changes right after direct user input such as clicks (since those types of changes to the view are intentional and expected by the user), but additional dynamic content (ads, widgets) after the initial shifts may be unexpected and frustrating.

Since the onload event in SPAs doesn’t matter as much, it’s worthwhile to keep accumulating the Cumulative Layout Score beyond just onload. For example, Boomerang in SPA mode measures CLS up to the end of the SPA Hard Navigation (when all dynamic content has loaded), when it sends its beacon.

After the SPA Hard Navigation, it’s also useful to know about the user experience during subsequent Soft Navigations. Resetting the CLS value for each Soft Navigation lets you understand how each individual view change affects the user experience.

CLS with SPA Navigations

Not all measurement tools will be able to split out CLS by Soft Navigation. For example, the Chrome User Experience (CrUX) data measures all layout shifts until the page goes hidden (or unloads), which means the Hard navigation and all Soft navigations are combined and Cumulative Layout Shift is just the sum of all of those experiences.

IFRAMEs

The Layout Instability spec mentions that:

The cumulative layout shift (CLS) score is the sum of every layout shift value that is reported inside a top-level browsing context, plus a fraction (the subframe weighting factor) of each layout shift value that is reported inside any descendant browsing context.

and

The subframe weighting factor for a layout shift value in a child browsing context is the fraction of the top-level viewport that is occupied by the viewport of the child browsing context.

In other words, shifts in IFRAMEs should affect the top-level document’s CLS score.

This seems logical, right? IFRAMEs that are in the viewport also have the chance to shift visible content. End-users don’t necessarily know which content is in a frame versus the top-level page, so IFRAME layout shifts should be able to affect the top-level document’s Cumulative Layout Shift Score.

CLS In IFRAMEs

In the above image, let’s pretend the content in the blue box is in an <iframe> taking approximately 50% of the viewport. If an Annoying Ad pops it, it may cause a Layout Shift with a value of 0.10 within the IFRAME itself. That layout shift could theoretically affect its’ parent’s Cumulative Layout Shift as well. Since the IFRAME is 50% of the viewport of its parent, the parent’s Cumulative Layout Shift core would increase by 0.05.

Here’s the complication:

  • While the Layout Instability spec proposes this behavior, as of October 2020, IFRAME layout shifts do not affect the Cumulative Layout Shift scores in most current synthetic and RUM tools
  • Chrome Lighthouse (in browser Developer Tools, as well as powering PageSpeed Insights and WebPagetest’s CLS scores) does not currently track Layout Shifts in frames.
    • While Lighthouse reports a CLS of 0.0 for shifts from IFRAMEs, it will still suggest Avoid large layout shifts for any shifts in those frames (bug tracking this), which can be confusing:
CLS in IFRAMEs in Dev Tools
  • All current RUM tools only track Layout Shifts in the top-level page, not accounting for any shifts from IFRAMEs
    • If they wanted to do this, they would need to crawl for all IFRAMEs and register PerformanceObservers for those
    • It’s hard to do this for dynamically added or removed IFRAMEs
    • This cannot be done for any cross-origin IFRAMEs due to frame restrictions
    • Here’s an issue discussing this discrepancy
  • On the other hand, Google’s Chrome User Experience (CrUX) report does factor in IFRAME layout shifts for CLS

As a result, if you have content shifting in IFRAMEs today, those might (or might-not) not be affecting your top-level Cumulative Layout Shift scores, depending on what data you’re looking at.

In the future, if Lighthouse and other synthetic tools are updated to include layout shifts from IFRAMEs, it is likely they will always differ from RUM CLS which cannot easily (or at all) get layout shifts from IFRAMEs.

We should strive to keep RUM CLS as close as possible to synthetic CLS, so I’ve filed an issue to try to get the same IFRAME details in RUM easily.

How to Improve It

This article won’t dive too deeply into how to improve a site’s CLS score, as there is already a lot of great content from other sources, such as Google’s Optimize Cumulative Layout Shift article on web.dev.

However, it’s important to take time to understand and investigate why your CLS score is the way it is before you try to fix or improve anything.

The first step of improving any performance metric is making sure you understand precisely how that metric is being measured. Whether you’re looking at synthetic or RUM data, make sure you understand how it’s being calculated and how much data the CLS value represents.

For example, make sure you know how much of the page’s lifetime layout shifts are being measured for, as it varies by tool.

If you’re looking at a CLS score from a synthetic test like Lighthouse or WebPagetest, you can probably get a trace, or breakdown, of the content that contributed to that score. From there, you can look for opportunities to improve.

CLS in Lighthouse

Remember, synthetic developer tools often just measure a single test case on your developer machine, and may not be representative of what your users are seeing across devices, browsers, screens and locations! Synthetic monitoring tools are useful for getting repeatable measurements from a lab-like environment, but won’t be representative of your real visitors.

If you have RUM data, see if you can break down CLS by Page Group, Mobile/Desktop, and other dimensions to see which segments of your visitors are having the worst experiences.

CLS in RUM

Intuitively, Cumulative Layout Shift scores may differ significantly for each page group (e.g. different types of pages such as Home, Product, or List pages) of a site.

Tim Vereecke confirms this is what he found for his site:

RUM Data Tweet

RUM data can also contain attribution that has details about which elements moved for each layout shift.

Once you’ve narrowed down the largest scenarios and population segments that are contributing to your CLS, you can use a local debugger or synthetic testing tools to try to reproduce the layout shifts.

From there, at a high-level, layout shifts occur when content is inserted above or at where the current viewport is.

Many times, this can be caused by:

  • Scroll bars needing to be added by additional content (which can reduce the width of the page, which can shift content to the left or down)
  • CSS animations
    • Use transform properties instead
  • Image sliders
    • Make sure you’re using transforms instead of changing dimension / placement properties
  • Ads
    • If possible, define dimensions ahead of time
  • Images without dimensions
  • Content that only gets included or initialized after the user scrolls to it
    • Add placeholders with the correct dimensions
  • Fonts
    • Unstyled fonts being drawn before the final font (which may have slightly different dimensions) can lead to layout shifts
    • font-display: swap in conjunction with a good matching font fallback can help

More details on the above fixes are on Google’s Optimize Cumulative Layout Shift page.

Taking a video as you load and interact with a page can highlight specific cases where CLS increases, and Chrome Developer Tools has an option to see which regions shifted in real-time.

One note is that a lot of today’s modern performance best practices may potentially have a negative effect on CLS, such as lazy-loading CSS, images, fonts, etc. When those components are loaded asynchronously, it’s possible for them to introduce layout shifts as they need to be drawn with the proper dimensions.

In other cases, websites that are tuning for performance may be exposing themselves to more layout shifts unintentionally. Besides lazy-loading, fast-loading sites optimize for a quick first-paint, to get something on-screen for the visitor’s eyes. As additional content comes in, it may be shifting the page around significantly, even though the user may think it’s possible for them to start interacting with the site.

That’s why it can be important to keep an eye on CLS every time major performance changes are being considered. There are always trade-offs between delivering content quickly and delivering it too quickly, where it will need to be shuffled around before the page has reached its final form.

How to Measure It

CLS can be measured synthetically (in the lab) or for real users (via RUM). Lab measurements may only capture layout shifts from a single or repeated Page Load experience, while RUM measurements will be more reflective of what real users see as they experience and interact with a site.

RUM

Cumulative Layout Shift can be measured via the browser’s Layout Instability API. This experimental API reports individual layout-shift entries to any registered PerformanceObserver on the page.

Each layout-shift entry represents an occurrence where an element in the viewport changes its starting position between two frames. An element simply changing its size or being added to the DOM for the first time won’t necessarily trigger a layout shift, if it doesn’t affect other visible DOM elements in the viewport.

Not all layout shifts are necessarily bad. For instance, if a user is interacting with the page, such as clicking a button in a Single Page App, they may be expecting the viewport to change. Each layout-shift event has a hadRecentInput flag that tells whether there was input within the last 500ms of the shift. If so, that layout shift can probably be excluded from the Cumulative Layout Shift score.

Inputs that trigger hadRecentInput are mousedown, keydown, and pointerdown. Simple mousemove and pointermove events and scrolls are not counted.

How long should layout shifts be added to the Cumulative Layout Shift score? That depends on how much of the user experience you’re trying to measure.

See When does it End? for more details.

Example Code

There are many open-source libraries that capture CLS today, such as Boomerang or the web-vitals library.

See the open-source RUM section for more examples.

If you want to experiment with the raw layout shifts via the Layout Instability API, the first thing is to create a PerformanceObserver:

var clsScore = 0;

try {
  var po = new PerformanceObserver(function(list) {
    var entries = list.getEntries();
    for (var i = 0; i < entries.length; i++) {
      if (!entries[i].hadRecentInput) {
        clsScore += entries[i].value;
      }
    }
  });

  po.observe({type: 'layout-shift', buffered: true});
} catch (e) {
  // not supported
}

buffered:true is used to gather any layout-shifts that occurred before the PerformanceObserver was initialized. This is especially useful for scripts, libraries, or third-party analytics that load asynchronously on the page.

Each callback to the above PerformanceObserver will have a list of entries, via list.getEntries().

Each entry is a LayoutShift object:

LayoutShift Object

Here are its attributes:

  • duration will always be 0
  • entryType will always be layout-shift
  • hadRecentInput is whether there was user input in the last 500ms
  • lastInputTime is the time of the most recent input
  • name should be layout-shift (though Chrome appears to currently put the empty string "")
  • sources is a sampling of attribution for what caused the layout shift (see attribution below)
  • startTime is the high resolution timestamp when the shift occurred
  • value is the layout shift contribution (see definition above)

If you’re just interested in calculating the Cumulative Layout Score, you can add the value of each layout-shift as long as it doesn’t have hadRecentInput set.

For more details on the shifts, you could capture the sources to see top contributors.

There are a few edge-cases to be aware of, so it’s best to look at one of the example libraries for details.

If you want to browse the web and watch CLS entries as they happen live, you can try this simple script for Tampermonkey, or the Web Vitals Chrome Extension.

Attribution

So, your site has a CLS score of 0.3. Great!? Now what?

You probably want to know why. Besides the raw value that each layout-shift generates, it has a sources attribute that can give an indication of the top elements that shifted.

The sources attribute of the layout-shift entry is sampling of up to five DOM elements whose layout shifts most substantially contributed to the layout shift value:

LayoutShift Object

Note sources are the elements that shifted, not necessarily the element(s) that caused the shift. For example, an element that is inserted above the current viewport could cause elements within the viewport to shift (and contribute to the CLS score), though the inserted element itself may not be in the sources list.

Attribution via sources is only available in Chrome 84+.

Fallbacks

Unfortunately, it would be challenging to measure Layout Shifts without the Layout Instability API, which today is only supported in Blink-based browsers.

Theoretically, a polyfill might be able to calculate the placement and dimensions of every element within the viewport every frame and how they change… seems like that would be rather inefficient to do in JavaScript.

Maybe someone will prove me wrong!

For now, it’s best to capture CLS via browsers that support the Layout Instability API and use other spot checks to make sure other browsers have similar layout behavior.

Browser Support

CanIUse.com tracks browser support for the Layout Instability API.

As of 2020-10, only Blink-based browsers support it, which is about 69% of global market share:

  • Chrome 77+
  • Opera
  • Edge 80+ (based on Chromium — no support in EdgeHTML)

Note that Chrome has done a great job documenting any changes they’ve made to the Layout Instability API or CLS measurement.

Based on recent feedback to the Layout Instability GitHub Issues Page it seems that Mozilla engineers are reviewing the specification (but have not yet shown a public commitment to implementing it).

Gotchas

When measuring and reporting on Cumulative Layout Shift, there are a lot of gotchas and caveats to understand:

  • Layout Shifts are affected by the viewport and size of the viewport. Only content that is within the viewport is visible. Shifts that happen below the fold will have no effect on Cumulative Layout Shift:
CLS in boomerang.js
  • Layout Shifts may happen more frequently on mobile vs. desktop due to responsive layouts that are more vertical, with a lot of dynamically added content from scrolling. When analyzing CLS data, investigate Desktop and Mobile layouts separately.
  • The point at which you “stop” accumulating layout shifts into the Cumulative Layout Shift score matters, and different measurement tools may stop at different points. See the When does it End? section for more details.
  • There are bugs (with developer tools) and inconsistencies (between synthetic and RUM) with measuring layout shifts happening in IFRAMEs.
  • There are some known canonical cases that might provide high CLS values but still present a good user experience. For example, some types of image carousels (not using transform) might cause a large shift every time the image changes.
  • CLS can’t distinguish elements that don’t paint any content (but have non-zero fixed size), see this discussion.
  • Anytime there’s a new performance metric, there will be places it breaks down or doesn’t work well. It’s useful to browse (and possibly subscribe) to the Layout Instability’s Issue Page if you’re interested in this metric.

Open-Source / Free RUM

Cumulative Layout Shift is already supported in many popular open-source JavaScript libraries:

boomerang.js

boomerang.js is an open-source performance monitoring JavaScript library. (I am one of its authors).

It has support for Cumulative Layout Shift, which was added as part of the Continuity plugin in version 1.700.0.

CLS is measured up to the point the beacon is sent. For traditional apps, this is right after the onload event. For Single Page Apps (SPAs), CLS is measured up to the SPA Hard beacon is sent, which can include dynamically loaded content. CLS is also measured for each SPA Soft navigation.

CLS in boomerang.js
perfume.js

perfume.js is an open-source web performance monitoring JavaScript library that reports field data back to your favorite analytics tool.

Perfume added support for Cumulative Layout Shift in version 4.8.0.

Perfume is measured up to two points: when First Input Delay happens (as cls), and when the page’s lifecycle state changes to hidden (as clsFinal).

CLS in perfume.js
web-vitals from Google

Google’s official web-vitals open-source JavaScript library measures all of Google’s Web Vitals metrics, in a way that accurately matches how they’re measured by Chrome and reported to other Google tools.

web-vitals can measure CLS throughout the page load process, and will also report CLS as the page is being unloaded or backgrounded.

CLS in Web Vitals
CrUX

The Chrome User Experience (CrUX) Report provides real-user monitoring (RUM) data for Chrome users as they navigate across the web.

Its data is available via PageSpeed Insights and in raw form via the Public Google Big Query Project. It’s data is also used in Google Search Console’s Core Web Vitals report.

If you’re interested in setting up a CrUX report for your own domain, you can follow this guide.

CrUX always reports on the last 28 days of data.

CLS in CrUX

Commercial RUM

Commercial Real User Monitoring (RUM) providers measure the experiences of real-world page loads. They can aggregate millions (or billions) of page loads into dashboards where you can slice and dice the data.

Akamai mPulse

Akamai mPulse (which I work on) has added full support for Cumulative Layout Shift (and other Web Vitals):

CLS in mPulse
SpeedCurve’s LUX

SpeedCurve‘s LUX RUM tool has full support for Web Vitals, including CLS:

CLS in SpeedCurve
New Relic Browser

New Relic Browser is New Relic’s RUM monitoring, and has added support for Cumulative Layout Shift in Browser Agent v1177.

RequestMetrics

RequestMetrics provides website performance monitoring and has support for Web Vitals:

CLS in RequestMetrics

Synthetic

Synthetic tests are run in a lab-like environment or on developer machines. In general, synthetic tests allow for repeated testing of a URL in a consistent environment.

Synthetic developer tools take traces of individual page loads, and are fantastic for diving into and fixing CLS scores.

Synthetic monitoring tools help measure and monitor a URL (or set of URLs) over time, to ensure performance metrics don’t regress.

Free Synthetic Developer Tools

The following free synthetic developer tools can help you dive into individual URLs to understand what is causing layout shifts and how to fix them.

Chrome Developer Tools and Lighthouse

Chrome Developer Tools (and the Lighthouse browser extension/CLI) provide a wealth of information about Cumulative Layout Shift and the individual layout shifts that go into the score.

Within the Chrome Developer Tools, you have access to Lighthouse performance audits. Head to the Lighthouse tab, and run a Performance Audit:

CLS in Chrome Developer Tools

In addition to the top-level Cumulative Layout Shift score, you can get a breakdown of the contributing layout shifts:

CLS in Chrome Developer Tools - Contributions

(Note there’s a bug where IFRAME shifts aren’t accounted for in the score but are shown in the breakdown)

If you click on View Original Trace in the Audit, it will automatically open the Performance tab:

CLS in Chrome Developer Tools - Performance Tab

Within the Performance tab, there is now a new Experience row in the timeline that highlights individual layout shifts and their details:

CLS in Chrome Developer Tools - Experience Row

Outside of taking a trace, you can browse while getting visual indicators that layout shifts are happening.

To do this, open the Rendering option in More Tools:

CLS in Chrome Developer Tools - Rendering Options

Then enable Layout Shift Regions:

CLS in Chrome Developer Tools - Layout Shift Regions

And when you browse, you’ll see light-blue highlights of content that had layout shifts:

CLS in Chrome Developer Tools - Highlights

All of these tools can be used to help find, fix, and verify layout shifts.

PageSpeed Insights

PageSpeed Insights is a free tool from Google. It analyzes the content of a web page, then generates suggestions to make that page faster.

Behind the scenes, it runs Lighthouse as the analysis engine, so you’ll get similar results.

CLS in PageSpeed Insights
WebPagetest

WebPagetest.org, the gold standard in free synthetic performance testing, has a Web Vitals section that calculates CLS (for Chrome browser tests).

CLS in WebPagetest
layoutstability.rocks

layoutstability.rocks provides a simple form where you can enter a URL to get the CLS of a page:

CLS in LayoutStability.rocks
Web Vitals Chrome Extension

The Web Vitals Chrome Extension shows a page’s Largest Contentful Paint (LCP) in the extension bar, plus a popup with LCP, First Input Delay (FID) and Cumulative Layout Shift.

CLS Web Vitals Chrome extension

Commercial Synthetic Monitoring Tools

There are several commercial synthetic performance monitoring solutions that help measure Cumulative Layout Shift over time. Here is a sample of some of the best:

SpeedCurve

SpeedCurve has full support for Web Vitals, including CLS:

CLS in SpeedCurve
Calibre

Calibre is a synthetic performance monitoring product, and has full support for Web Vitals, including CLS.

CLS in Calibre

Rigor

Rigor offers synthetic performance monitoring and supports Web Vitals.

DareBoost

DareBoost is a synthetic performance monitoring and website analysis product, and has recently added support for CLS.

CLS in Dareboost

Why does CLS differ between Synthetic and RUM?

(or even between tools?)

CLS scores reported by synthetic tests (such as Lighthouse, WebPagetest or PageSpeed Insights) may be different than CLS scores coming from real-world (RUM) data. RUM libraries (such as boomerang.js or web-vitals.js) may also report different CLS scores than browser data (such as from the Chrome User Experience (CrUX) report).

Here are some reasons why:

  • Each tool may measure layout shifts until a different “end” point
    • See the When does it End? section for more details
    • This is especially important for Single Page Apps. For example, the Chrome User Experience (CrUX) data measures until the visibility state changes (i.e. when the page goes hidden or unloads), while other RUM tools (like Boomerang) more frequently measure just up to the Page Load event, and each individual in-page Soft Navigation separately
  • A single testcase (run) of a synthetic tool (e.g. one Lighthouse run) may report dramatically different results than real-world aggregated data (e.g. RUM or CrUX)
  • Aggregated data may be reflective of a specific date or period in time, while other tools may focus on other date ranges. For example:
    • CrUX always shows the last 28 days
    • mPulse RUM can report any period from last 5 minutes to up to 18 months ago
  • Google generally recommends measuring CLS at the 75th percentile across mobile and desktop devices. Make sure your tool has the capability of measuring different percentiles (and not just averages or only the median)
  • Some tools throw out, or limit CLS scores over a certain value. For example:
  • While today, layout shifts are not counted from IFRAMEs, the spec and synthetic tools suggest they should affect CLS. RUM tools may not be able to easily get layout shifts from IFRAMEs, causing RUM to under-report versus synthetic.

Real World Data

What do Cumulative Layout Shift scores look like in the real world?

I’ve written a companion post to this titled Cumulative Layout Shift in the Real World, which dives into CLS data by looking at data from Akamai mPulse’s RUM.

Head there for insights into how Cumulative Layout Shift scores correlate with business metrics, bounce rates, load times, rage clicks, and more!

What’s Next?

Cumulative Layout Shift is a relatively new metric, and it is still evolving. You can see some of the discussions happening in its GitHub issue tracker as well as through discussions in the Web Performance Working Group.

While it is only supported in Chromium-based browsers today, we hope that it is being considered for other engines as we’ve seen that the metric can provide a good measurement of user experience and correlates with other business metrics.

However, there is still a lot of work to be done to better understand where it’s working, when it doesn’t work, and how we should improve its usefulness over time. As more sites start paying attention to CLS, we will probably learn about its good and bad uses.

Will it be included as part of Google’s Core Vitals metrics next year? We’ll see! They’ve indicated that they’ll evaluate and evolve the primary metrics each year as they gather feedback.

References

Thanks

A few words of thanks…

Thanks to the Boomerang development team (funded by Akamai as part of mPulse), and other mPulse and Akamai employees, and specifically Avinash Shenoy for his work adding CLS support to Boomerang.

The Google engineering team has put a lot of thought and research into Web Vitals, the Layout Shift API and Cumulative Layout Shift scores. Kudos to them for driving for a new performance metric that helps reflect the user experience.

Updates

  • 2020-10-21: Updated the IFRAMEs section to note that CrUX does factor in IFRAME layout shifts into their CLS scores