ResourceTiming Visibility: Third-Party Scripts, Ads and Page Weight
Table Of Contents
- Introduction
- How to gather ResourceTiming data
- How cross-origins play a role
3.1 Cross-Origin Resources
3.2 Cross-Origin Frames - Why does this matter?
4.1 Third-Party Scripts
4.2 Ads
4.3 Page Weight - Real-world data
- Workarounds
- Summary
1. Introduction
ResourceTiming is a specification developed by the W3C Web Performance working group, with the goal of exposing accurate performance metrics about all of the resources downloaded during the entire user experience, such as images, CSS and JavaScript.
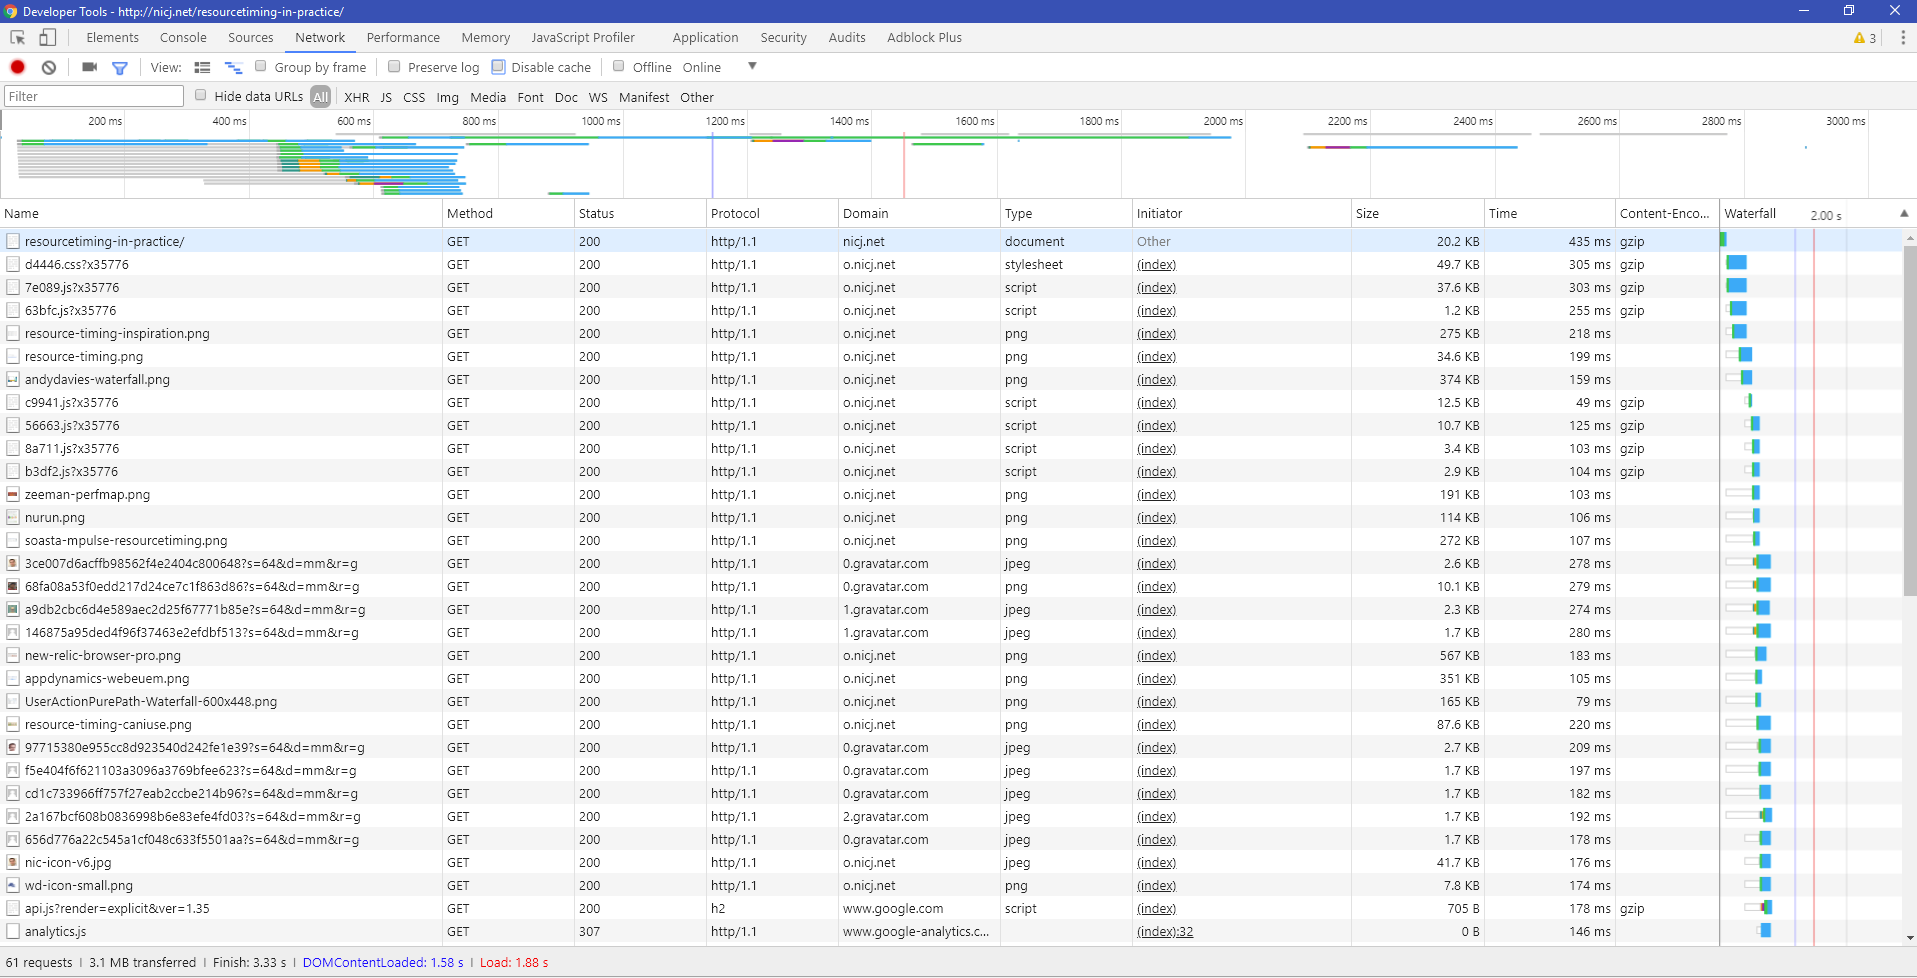
For a detailed background on ResourceTiming, you can see my post on ResourceTiming in Practice.
One important caveat when working with ResourceTiming data is that in most cases, it will not give you the full picture of all of the resources fetched during a page load.
Why is that? Four reasons:
- Assets served from a different domain — known as cross-origin resources — have restrictions applied to them (on timing and size data), for privacy and security reasons, unless they have the
Timing-Allow-OriginHTTP response header - Each
<iframe>on the page keeps track of the resources that it fetched, and theframe.performanceAPI that exposes the ResourceTiming data is blocked in a cross-origin<iframe> - Some asset types (e.g.
<video>tags) may be affected by browser bugs where they don’t generate ResourceTiming entries - If the number of resources loaded in a frame exceeds 150, and the page hasn’t called
performance.setResourceTimingBufferSize()to increase the buffer size, ResourceTiming data will be limited to the first 150 resources
The combination of these restrictions — some in our control, some out of our control — leads to an unfortunate caveat when analyzing ResourceTiming data: In the wild, you will rarely be able to access the full picture of everything that was fetched on the page.
Given these blind-spots, you may have a harder time answering these important questions:
- Are there any third-party JavaScript libraries that are significantly affecting my visitor’s page load experience?
- How many resources are being fetched by my advertisements?
- What is my Page Weight?
We’ll explore what ResourceTiming Visibility means for your page, and how you can work around these limitations. We will also sample ResourceTiming Visibility data across the web by looking at the Alexa Top 1000, to see how frequently resources get hidden from our view.
But first, some background:
2. How to gather ResourceTiming Data
ResourceTiming is a straightforward API to use: window.performance.getEntriesByType("resource") returns a list of all resources fetched in the current frame:
var resources = window.performance.getEntriesByType("resource");

/* eg:
[
    {
        name: "https://www.foo.com/foo.png",
        entryType: "resource",
        startTime: 566.357000003336,
        duration: 4.275999992387369,
        initiatorType: "img",
        redirectEnd: 0,
        redirectStart: 0,
        fetchStart: 566.357000003336,
        domainLookupStart: 566.357000003336,
        domainLookupEnd: 566.357000003336,
        connectStart: 566.357000003336,
        secureConnectionStart: 0,
        connectEnd: 566.357000003336,
        requestStart: 568.4959999925923,
        responseStart: 569.4220000004862,
        responseEnd: 570.6329999957234,
        transferSize: 10000,
        encodedBodySize: 10000,
        decodedBodySize: 10000,
    }, ...
]
*/
There is a bit of complexity added when you have frames on the site, e.g. from third-party content such as social widgets or advertising.
Since each <iframe> has its own buffer of ResourceTiming entries, you will need to crawl all of the frames on the page (and sub-frames, etc), and join their entries to the main window’s.
This gist shows a naive way of doing this. For a version that deals with all of the complexities of the crawl, such as adjusting resources in each frame to the correct startTime, you should check out Boomerang’s restiming.js plugin.
3. How cross-origins play a role
The main challenge with ResourceTiming data is that cross-origin resources and cross-origin frames will affect the data you have access to.
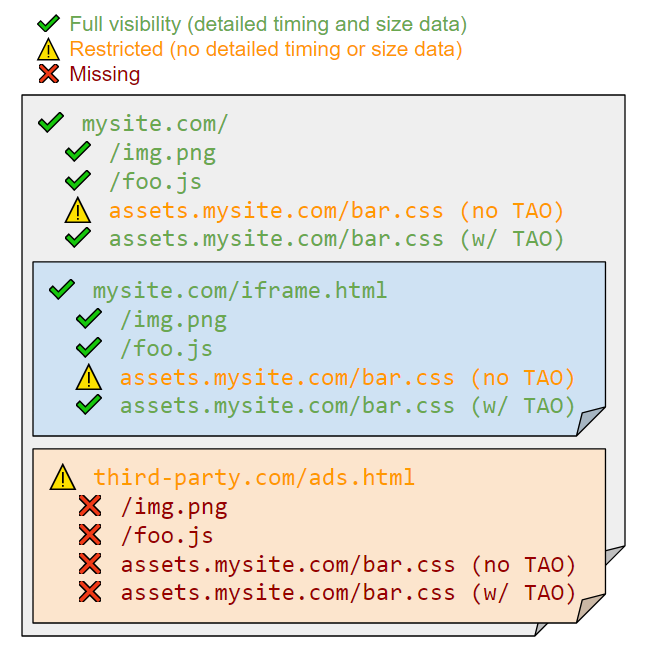
3.1 Cross-Origin Resources
For each window / frame on your page, a resource will either be considered “same-origin” or “cross-origin”:
- same-origin resources share the same protocol, hostname and port of the page
- cross-origin resources have a different protocol, hostname (or subdomain) or port from the page
ResourceTiming data includes all same-origin and cross-origin resources, but there are restrictions applied to cross-origin resources specifically:
- Detailed timing information will always be
0:redirectStartredirectEnddomainLookupStartdomainLookupEndconnectStartconnectEndrequestStartresponseStartsecureConnectionStart- That leaves you with just
startTimeandresponseEndcontaining timestamps
- Size information will always be
0:transferSizeencodedBodySizedecodedBodySize
For cross-origin assets that you control, i.e. images on your own CDN, you can add a special HTTP response header to force the browser to expose this information:
Timing-Allow-Origin: *
Unfortunately, for most websites, you will not be in control of all of third-party (and cross-origin) assets being served to your visitors. Some third party domains have been adding the Timing-Allow-Origin header to their responses, but not all — current usage is around 13%.
3.2 Cross-Origin Frames
In addition, every <iframe> you have on your page will have its own list of ResourceTiming entries. You will be able to crawl any same-origin and anonymous frames to gather their ResourceTiming entries, but cross-origin frames block access to the the contentWindow (and thus the frame.performance) object — so any resources fetched in cross-origin frames will be invisible.
Note that adding Timing-Allow-Origin to a cross-origin <iframe> (HTML) response will give you full access to the ResourceTiming data for that HTML response, but will not allow you to access frame.performance, so all of the <iframe>‘s ResourceTimings remain unreachable.
To recap:
4. Why does this matter?
Why does this all matter?
When you, a developer, are looking at a browser’s networking panel (such as Chrome’s Network tab), you have full visibility into all of the page’s resources:
Unfortunately, if you were to use the ResourceTiming API at the same time, you may only be getting a subset of that data.
ResourceTiming isn’t giving you the full picture.
Without the same visibility into the resources being fetched on a page as a developer has using browser developer tools, if we are just looking at ResourceTiming data, we may be misleading ourselves about what is really happening in the wild.
Let’s look at a couple scenarios:
4.1 Third-Party Scripts
ResourceTiming has given us fantastic insight into the resources that our visitors are fetching when visiting our websites. One of the key benefits of ResourceTiming is that it can help you understand what third-party libraries are doing on your page when you’re not looking.
Third-party libraries cover the spectrum of:
- JavaScript libraries like jQuery, Modernizr, Angular, and marketing/performance analytics libraries
- CSS libraries such as Bootstrap, animate.css and normalize.css
- Social widgets like the Facebook, Twitter and Google+ icons
- Fonts like FontAwesome, Google Fonts
- Ads (see next section)
Each of the above categories bring in different resources. A JavaScript library may come alone, or it may fetch more resources and send a beacon. A CSS library may trigger downloads of images or fonts. Social widgets will often create frames on the page that load even more scripts, images and CSS. Ads may bring in 100 megabytes of video just because.
All of these third-party resources can be loaded in a multitude of ways as well. Some of may be embedded (bundled) directly into your site; some may be loaded from a CDN (such as cdnjs.com); some libraries may be loaded directly from a service (such a Google Fonts or Akamai mPulse).
The true cost of each library is hard to judge, but ResourceTiming can give us some insight into the content being loaded.
It’s also important to remember that just because a third-party library behaves one way on your development machine (when you have Developer Tools open) doesn’t mean that it’s not going to behave differently for other users, on different networks, with different cookies set, when it detects your Developer Tools aren’t open. It’s always good to keep an eye on the cost of your third-party libraries in the wild, making sure they are behaving as you expect.
So how can we use ResourceTiming data to understand third-party library behavior?
- We can get detailed timing information: how long does it take to DNS resolve, TCP connect, wait for the first byte and take to download third-party libraries. All of this information can help you judge the cost of a third-party library, especially if it is for a render-blocking critical resource like non-async JavaScripts, CSS or Fonts.
- We can understand the weight (byte cost) of the third party, and the dependencies it brings in, by looking at the
transferSize. We can also see if it’s properly compressed by comparingencodedBodySizetodecodedBodySize.
In order to get the detailed timing information and weight of third-party libraries, they need to be either served same-domain (bundled with your other assets), or with a Timing-Allow-Origin HTTP response header. Otherwise, all you get is the overall duration (without DNS, TCP, request and response times), and no size information.
Take the below screenshot as an example. In it, there are third-party (cross-origin) images on vgtstatic.com that have Timing-Allow-Origin set, so we get a detailed breakdown of the how long they took. We can determine Blocking, DNS, TCP, SSL, Request and Response phases of the requests. We see that many of these resources were Blocked (the grey phase) due to connection limits to *.vgtstatic.com. Once TCP (green) was established, the Request (yellow) was quick and the Response (purple) was nearly instant:
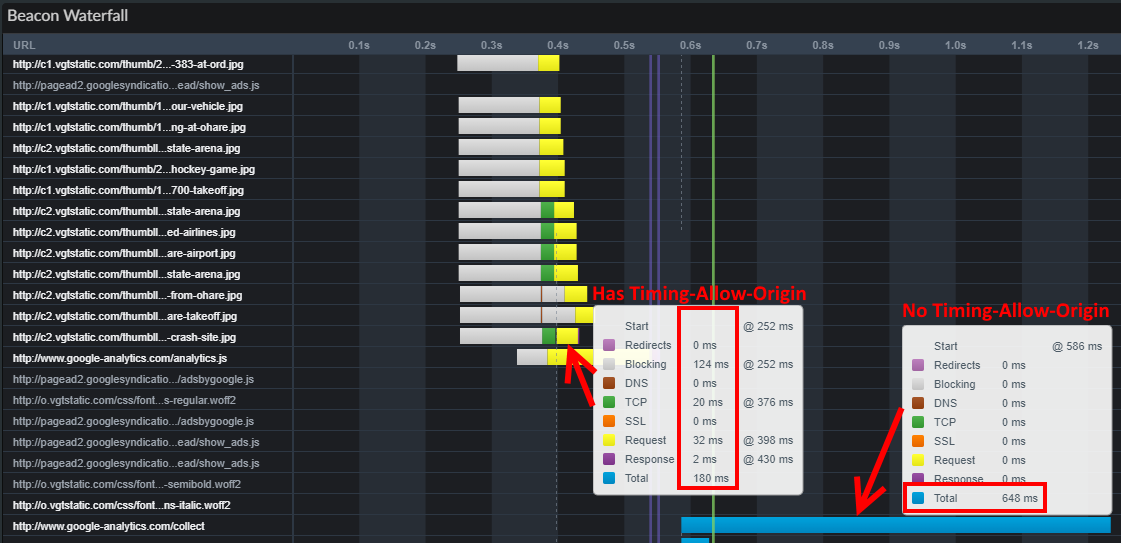
Contrast all of this information to a cross-origin request to http://www.google-analytics.com/collect. This resources does not have Timing-Allow-Origin set, so we only see its total Duration (deep blue). For some reason this beacon took 648 milliseconds, and it is impossible for us to know why. Was it delayed (Blocked) by other requests to the same domain? Did google-analytics.com take a long time to first byte? Was it a huge download? Did it redirect from http:// to https://?
Since the URL is cross-origin without Timing-Allow-Origin, we also do not have any byte information about it, so we don’t know how big the response was, or if it was compressed.
The great news is that many of the common third-party domains on the internet are setting the Timing-Allow-Origin header, so you can get full details:
> GET /analytics.js HTTP/1.1
> Host: www.google-analytics.com
>
< HTTP/1.1 200 OK
< Strict-Transport-Security: max-age=10886400; includeSubDomains; preload
< Timing-Allow-Origin: *
< ...
However, there are still some very common scripts that show up without Timing-Allow-Origin (in the Alexa Top 1000), even when they’re setting TAO on other assets:
https://connect.facebook.net/en_US/fbevents.js(200 sites)https://sb.scorecardresearch.com/beacon.js(133 sites)https://d31qbv1cthcecs.cloudfront.net/atrk.js(104 sites)https://www.google-analytics.com/plugins/ua/linkid.js(54 sites)
Also remember that any third-party library that loads a cross-origin frame will be effectively hiding all of its cost from ResourceTiming. See the next section for more details.
4.2 Ads
Ads are a special type of third-party that requires some additional attention.
Most advertising on the internet loads rich media such as images or videos. Most often, you’ll include an ad platform on your website by putting a small JavaScript snippet somewhere on your page, like the example below:
<script async src="//pagead2.googlesyndication.com/pagead/js/adsbygoogle.js"></script>
<ins class="adsbygoogle" style="display:block;width: 120px; height: 600px" data-ad-client="ca-pub-123"></ins>
<script>(adsbygoogle = window.adsbygoogle || []).push({});</script>
Looks innocent enough right?
Once the ad platform’s JavaScript is on your page, it’s going to bootstrap itself and try to fetch the media it wants to display to your visitors. Here’s the general lifecycle of an ad platform:
- The platform is loaded by a single JavaScript file
- Once that JavaScript loads, it will often load another library or load a “configuration file” that tells the library where to get the media for the ad
- Many ad platforms then create an
<iframe>on your page to load a HTML file from an advertisor - That
<iframe>is often in control of a separate third-party advertisor, which can (and will) load whatever content it wants, including additional JavaScript files (for tracking viewing habits), media and CSS.
In the end, the original JavaScript ad library (e.g. adsbygoogle.js at 25 KB) might be responsible for loading a total of 250 KB of content, or more — a 10x increase.
How much of this content is visible from ResourceTiming? It all depends on a few things:
- How much content is loaded within your page’s top level window and has
Timing-Allow-Originset? - How much content is loaded within same-origin (anonymous) frames and has
Timing-Allow-Originset? - How much content is loaded from a cross-origin frame?
Let’s take a look at one example Google AdSense ad:
- In the screenshot below, the green content was loaded into the top-level window. Thankfully, most of Google AdSense’s resources have
Timing-Allow-Originset, so we have complete visibility into how long they took and how many bytes were transferred. These 3 resources accounted for about 26 KB of data. - If we crawl into accessible same-origin frames, we’re able to find another 4 resources that accounted for 115 KB of data. Only one of these was missing
Timing-Allow-Origin. - AdSense then loaded the advertiser’s content in a cross-origin frame. We’re unable to look at any of the resources in the cross-origin frame. There were 11 resources that accounted for 98 KB of data (40.8% of the total)
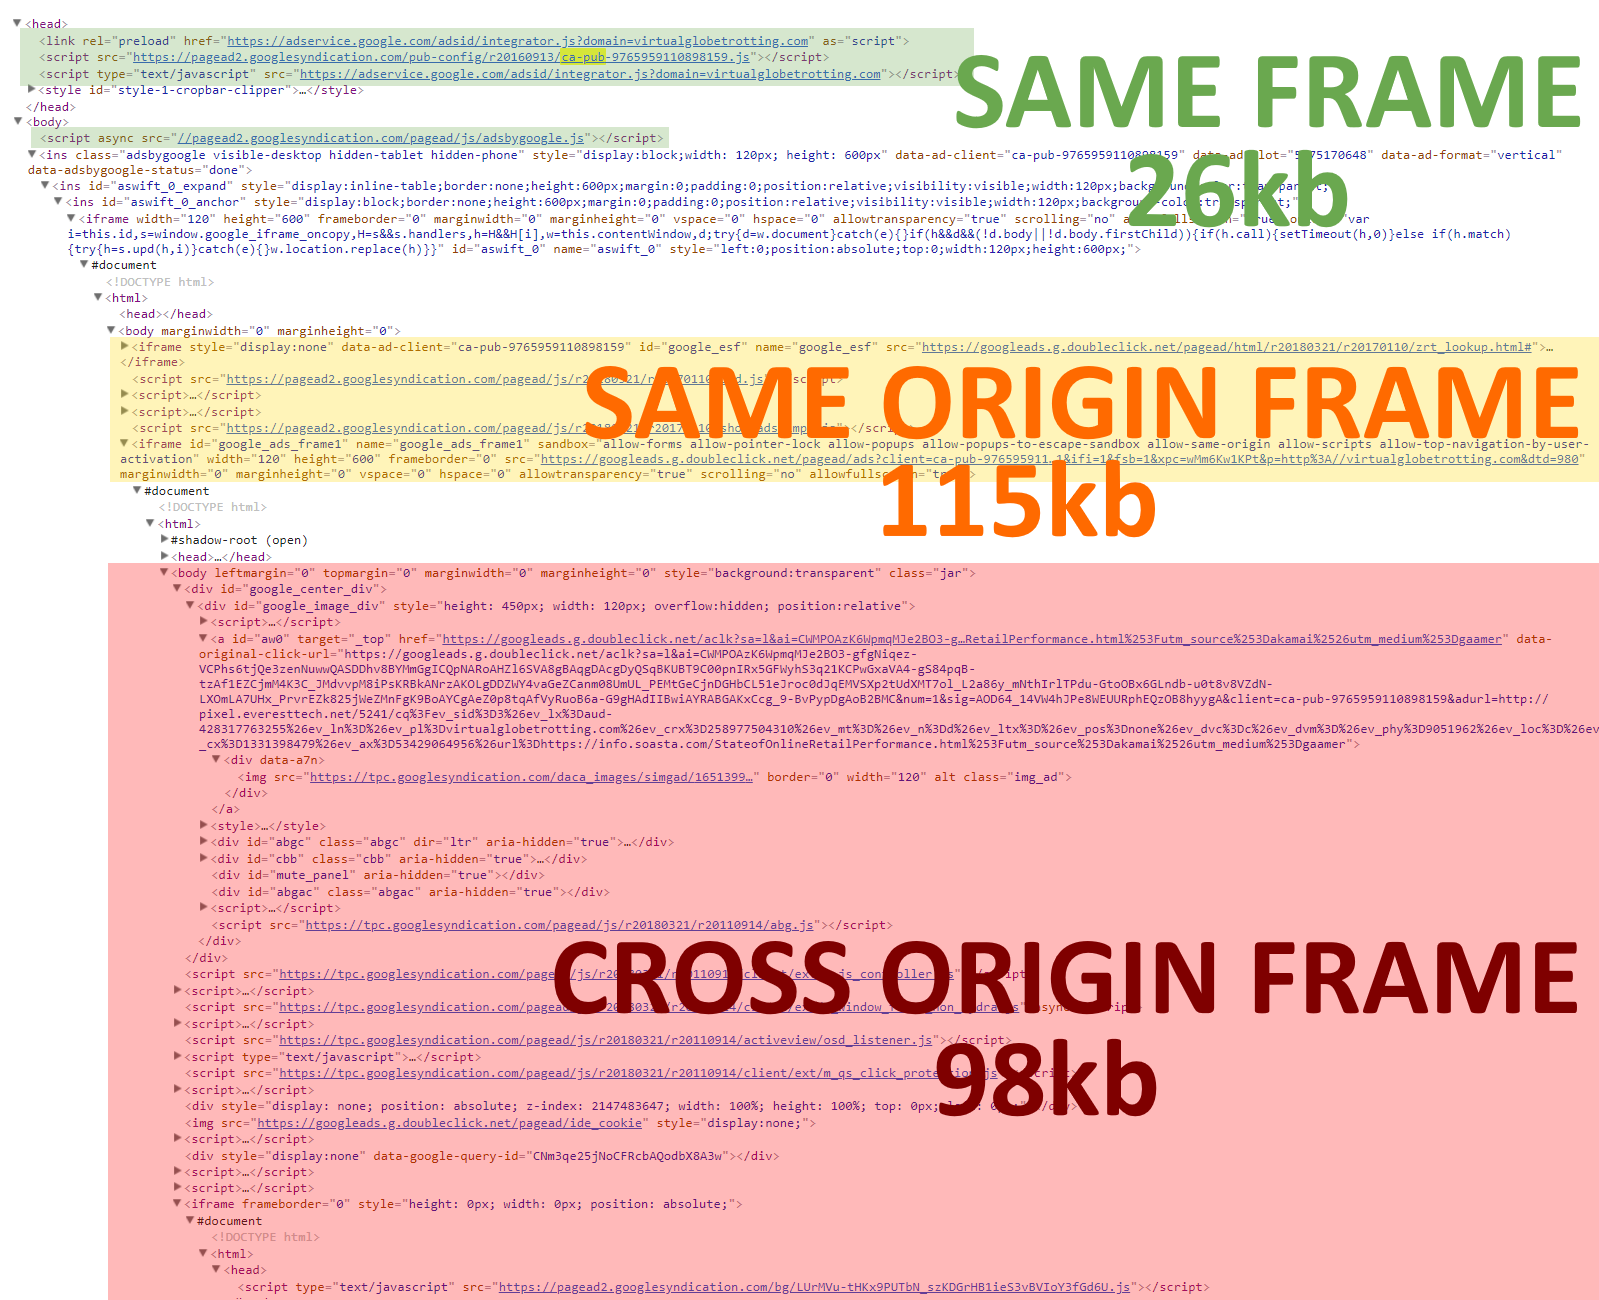
Most advertising platforms’s ads are loaded into cross-origin frames so they are less likely to affect the page itself. Unfortunately, as you’ve seen, this means it’s also easy for advertisers to unintentionally hide their true cost to ResourceTiming.
4.3 Page Weight
Another challenge is that it makes it really hard to measure Page Weight. Page Weight measures the total cost, in bytes, of loading a page and all of its resources.
Remember that the byte fields of ResourceTiming (transferSize, decodedBodySize and encodedBodySize) are hidden if the resource is cross-origin. In addition, any resources fetched from a cross-origin frame will be completely invisible to ResourceTiming.
So in order for ResourceTiming to expose the accurate Page Weight of a page, you need to ensure the following:
- All of your resources are fetched from the same origin as the page
- Unless: If any resources are fetched from other origins, they must have
Timing-Allow-Origin
- Unless: If any resources are fetched from other origins, they must have
- You must not have any cross-origin frames
- Unless: If you are in control of the cross-origin frame’s HTML (or you can convince third-parties to add a snippet to their HTML), you might be able to “bubble up” ResourceTiming data from cross-origin frames
Anything less than the above, and you’re not seeing the full Page Weight.
5. Real World data
How many of your resources are fully visible to ResourceTiming? How many are visible, but don’t contain the detailed timing and size information due to cross-origin restrictions? How many are completely hidden from your view?
There’s been previous research and HTTP Archive stats on Timing-Allow-Origin usage, and I wanted to expand on that research by also seeing how significantly the cross-origin <iframe> issue affects visibility.
To test this, I’ve built a small testing tool that runs Chrome headless (via puppetteer).
The tool loads the Alexa Top 1000 websites, monitoring all resources fetched in the page by the Chrome native networking APIs. It then executes a crawl of the ResourceTiming data, going into all of the frames it has access to, and compares what the browser fetched versus what is visible to ResourceTiming.
Resources are put into three visibility buckets:
- Full: Same-origin resources, or cross-origin resources that have
Timing-Allow-Originset. These have all of the timing and size fields available. - Restricted: Cross-origin resources without
Timing-Allow-Originset. These only havestartTimeandresponseEnd, and no size fields (so can’t be used for Page Weight calculations). - Missing: Any resource loaded in a cross-origin
<iframe>. Completely invisible to ResourceTiming.
Overall
Across the Alexa Top 1000 sites, only 22.3% of resources have Full visibility from ResourceTiming.
A whopping 31.7% of resources are Missing from ResourceTiming, and the other 46% are Restricted, showing no detailed timing or size information:
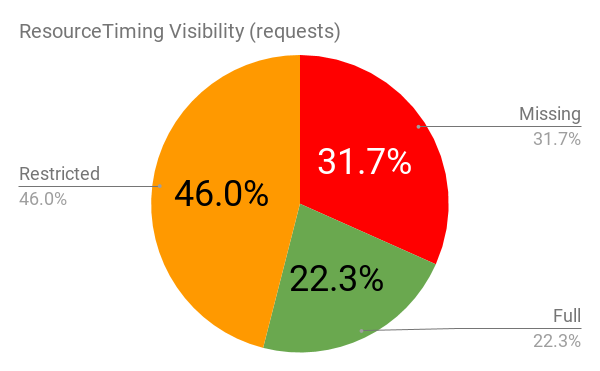
Overall ResourceTiming Visibilty by Request Count
If you’re interested in measuring overall byte count for Page Weight, even more data is missing from ResourceTiming. Over 50% of all bytes transferred when loading the Alexa Top 1000 were Missing from ResourceTiming. In order to calculate Page Weight, you need Full Visibility, so if you used ResourceTiming to calculate Page Weight, you would only be (on average) including 18% of the actual bytes:
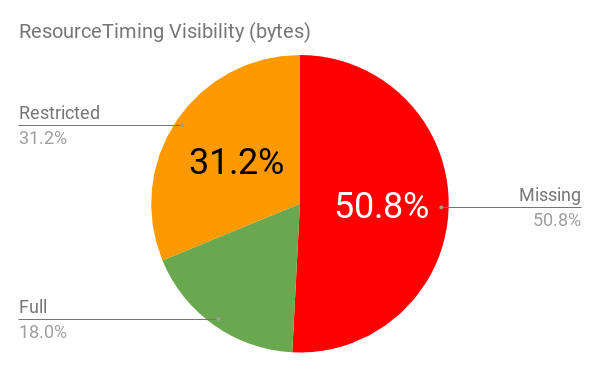
Overall ResourceTiming Visibilty by Byte Count
By Site
Obviously each site is different, and due to how a site is structured, each site will have a differing degrees of Visibility. You can see that Alexa Top 1000 websites vary across the Visibility spectrum:
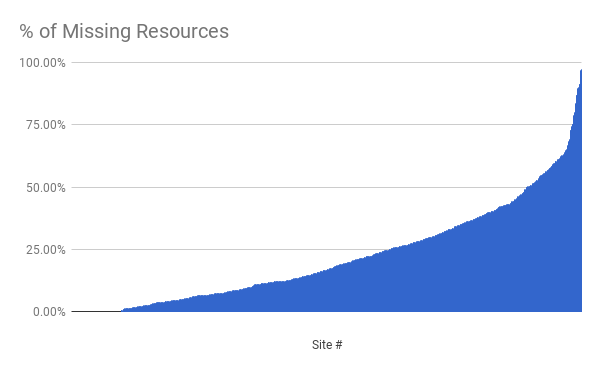
There are some sites with 100% Full Visibility. They’re serving nearly all of the content from their primary domain, or, have Timing-Allow-Origin on all resources, and don’t contain any cross-origin frames. For example, a lot of simple landing pages such as search engines are like this:
- google.com
- sogou.com
- telegram.org
Other sites have little or no Missing resources but are primarily Restricted Visibility. This often happens when you serve your homepage on one domain and all static assets on a secondary domain (CDN) without Timing-Allow-Origin:
- stackexchange.com
- chess.com
- ask.fm
- steamcommunity.com
Finally, there are some sites with over 50% Missing resources. After reviewing these sites, it appears the majority of this is due to advertising being loaded from cross-origin frames:
- weather.com
- time.com
- wsj.com
By Content
It’s interesting how Visibility commonly differs by the type of content. For example, CSS and Fonts have a good chance of being Full or at least Restricted Visibility, while Tracking Pixels and Videos are often being loaded in cross-origin frames so are completely Missing.
Breaking down the requests by type, we can see that different types of content are available at different rates:
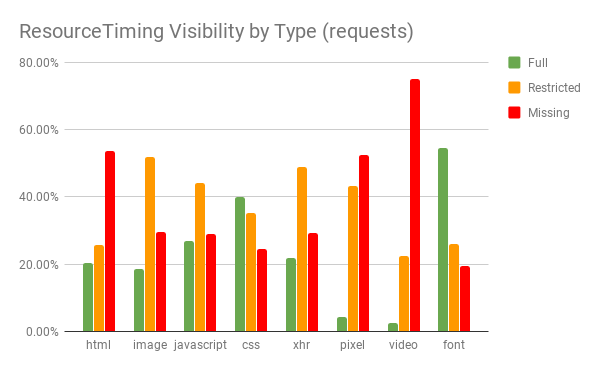
ResourceTiming Visibility by Type
Let’s look at a couple of these types.
HTML Content
For the purposes of this analysis, HTML resources have an initiatorType of iframe or were a URL ending in .htm*. Note that the page itself is not being reported in this data.
From the previous chart, HTML content is:
- 20% Full Visibility
- 25% Restricted
- 53% Missing
Remember that all top-level frames will show up in ResourceTiming, either as Full (same-origin) or Restricted (cross-origin without TAO). Thus, HTML content that is being reported as Missing must be an <iframe> loaded within a cross-origin <iframe>.
For example, https://pagead2.googlesyndication.com/pagead/s/cookie_push.html is often Missing because it’s loaded within container.html (a cross-origin frame):
<iframe src="https://tpc.googlesyndication.com/safeframe/1-0-17/html/container.html">
    <html>
        <iframe src="https://pagead2.googlesyndication.com/pagead/s/cookie_push.html">
    </html>
</iframe>
Here are the top 5 HTML URLs seen across the Alexa Top 1000 that are Missing in ResourceTiming data:
| URL | Count |
|---|---|
https://staticxx.facebook.com/connect/xd_arbiter/r/Ms1VZf1Vg1J.js?version=42 | 221 |
https://pagead2.googlesyndication.com/pagead/s/cookie_push.html | 195 |
https://static.eu.criteo.net/empty.html | 106 |
https://platform.twitter.com/jot.html | 83 |
https://tpc.googlesyndication.com/sodar/6uQTKQJz.html | 62 |
All of these appear to be <iframes> injected for cross-frame communication.
Video Content
Video content is:
- 2% Full Visibility (0.8% by byte count)
- 22% Restricted (1.9% by byte count)
- 75% Missing (97.3% by byte count)
Missing video content appears to be pretty site-specific — there aren’t many shared video URLs across sites (which isn’t too surprising).
What is surprising is how often straight <video> tags don’t often show up in ResourceTiming data. From my experimentation, this appears to be because of when ResourceTiming data surfaces for <video> content.
In the testing tool, I capture ResourceTiming data at the onload event — the point which the page appears ready. In Chrome, Video content can start playing before onload, and it won’t delay the onload event while it loads the full video. So the user might be seeing the first frames of the video, but not the entire content of the video by the onload event.
However, it looks like the ResourceTiming entry isn’t added until after the full video — which may be several megabytes — has been loaded from the network.
So unfortunately Video content is especially vulnerable to being Missing, simply because it hasn’t loaded all frames by the onload event (if that’s when you’re capturing all of the ResourceTiming data).
Also note that some browsers will (currently) never add ResourceTiming entries for <video> tags.
Most Missing Content
Across the Alexa Top 1000, there are some URLs that are frequently being loaded in cross-origin frames.
The top URLs appear to be a mixture of JavaScript, IFRAMEs used for cross-frame communication, and images:
| URL | Count | Total Bytes |
|---|---|---|
| tpc.googlesyndication.com/pagead/js/r20180312/r20110914/client/ext/m_window_focus_non_hydra.js | 291 | 350946 |
| staticxx.facebook.com/connect/xd_arbiter/r/Ms1VZf1Vg1J.js?version=42 | 221 | 3178502 |
| tpc.googlesyndication.com/pagead/js/r20180312/r20110914/activeview/osd_listener.js | 219 | 5789703 |
| tpc.googlesyndication.com/pagead/js/r20180312/r20110914/abg.js | 215 | 4850400 |
| pagead2.googlesyndication.com/pagead/s/cookie_push.html | 195 | 144690 |
| tpc.googlesyndication.com/safeframe/1-0-17/js/ext.js | 178 | 1036316 |
| pagead2.googlesyndication.com/bg/lSvH2GMDHdWiQ5txKk8DBwe8KHVpOosizyQXSe1BYYE.js | 178 | 886084 |
| tpc.googlesyndication.com/pagead/js/r20180312/r20110914/client/ext/m_js_controller.js | 163 | 2114273 |
| googleads.g.doubleclick.net/pagead/id | 146 | 8246 |
| www.google-analytics.com/analytics.js | 126 | 1860568 |
| static.eu.criteo.net/empty.html | 106 | 22684 |
| static.criteo.net/flash/icon/nai_small.png | 106 | 139814 |
| static.criteo.net/flash/icon/nai_big.png | 106 | 234154 |
| platform.twitter.com/jot.html | 83 | 6895 |
Most Restricted Origins
We can group Restricted requests by domain to see opportunities where getting a third-party to add the Timing-Allow-Origin header would have the most impact:
| Domain | Count | Total Bytes |
|---|---|---|
| images-eu.ssl-images-amazon.com | 714 | 13204306 |
| www.facebook.com | 653 | 31286 |
| www.google-analytics.com | 609 | 757088 |
| www.google.com | 487 | 3487547 |
| connect.facebook.net | 437 | 6353078 |
| images-na.ssl-images-amazon.com | 436 | 8001256 |
| tags.tiqcdn.com | 402 | 3070430 |
| sb.scorecardresearch.com | 365 | 140232 |
| www.googletagmanager.com | 264 | 7684613 |
| i.ebayimg.com | 260 | 5489475 |
| http2.mlstatic.com | 253 | 3434650 |
| ib.adnxs.com | 243 | 1313041 |
| cdn.doubleverify.com | 239 | 4950712 |
| mc.yandex.ru | 235 | 2108922 |
Some of these domains are a bit surprising because the companies behind them have been leaders in adding Timing-Allow-Origin to their third-party content such as Google Analytics and the Facebook Like tag. Looking at some of the most popular URLs, it’s clear that they forgot to / haven’t added TAO to a few popular resources that are often loaded cross-origin:
https://www.google.com/textinputassistant/tia.pnghttps://www.google-analytics.com/plugins/ua/linkid.jshttps://www.google-analytics.com/collecthttps://images-eu.ssl-images-amazon.com/images/G/01/ape/sf/desktop/xyz.htmlhttps://www.facebook.com/fr/b.php
Let’s hope Timing-Allow-Origin usage continues to increase!
Buffer Sizes
By default, each frame will only collect up to 150 resources in the PerformanceTimeline. Once full, no new entries will be added.
How often do sites change the default ResourceTiming buffer size for the main frame?
| Buffer Size | Number of Sites |
|---|---|
| 150 | 854 |
| 200 | 2 |
| 250 | 2 |
| 300 | 15 |
| 400 | 5 |
| 500 | 5 |
| 1000 | 6 |
| 1500 | 1 |
| 100000 | 3 |
| 1000000 | 1 |
85.4% of sites don’t touch the default ResourceTiming buffer size. Many sites double it (to 300), and 1% pick numbers over 1000.
There are four sites that are even setting it over 10,000:
- messenger.com: 100,000
- fbcdn.net: 100,000
- facebook.com: 100,000
- lenovo.com: 1,000,000
(this isn’t recommended unless you’re actively clearing the buffer)
Should you increase the default buffer size? Obviously the need to do so varies by site.
In our crawl of the Alexa Top 1000, we find that 14.5% of sites exceed 150 resources in the main frame, while only 15% of those sites had called setResourceTimingBufferSize() to ensure all resources were captured.
6. Workarounds
Given the restrictions we have on cross-origin resources and frames, what can we do to increase the visibility of requests on our pages?
6.1 Timing-Allow-Origin
To move Restricted Visibility resources to Full Visibility, you need to ensure all cross-origin resources have the Timing-Allow-Origin header.
This should be straightforward for any content you provide (e.g. on a CDN), but it may take convincing third-parties to also add this HTTP response header.
Most people specify * as the allowed origin list, so any domain can read the timing data. All third party scripts should be doing this!
Timing-Allow-Origin: *
6.2 Ensuring a Proper ResourceTiming Buffer Size
By default, each frame will only collect up to 150 resources in the PerformanceTimeline. Once full, no new entries will be added.
Obviously this limitation will affect any site that loads more than 150 resources in the main frame (or over 150 resources in a <iframe>).
You can change the default buffer size by calling setRessourceTimingBufferSize():
(function(w){
  if (!w ||
    !("performance" in w) ||
    !w.performance ||
    !w.performance.setResourceTimingBufferSize) {
    return;
  }

  w.performance.setResourceTimingBufferSize(500);
})(window);
Alternatively, you can use a PerformanceObserver (in each frame) to ensure you’re not affected by the limit.
6.3 Bubbling ResourceTiming
It’s possible to “leak” ResourceTiming to parent frames by using window.postMessage() to talk between cross-origin frames.
Here’s some sample code that listens for new ResourceTiming entries coming in via a PerformanceObserver, then “bubbles” up the message to its parent frame. The top-level frame can then use these bubbled ResourceTiming entries and merge them with its own list from itself and same-origin frames.
The challenge is obviously convincing all of your third-party / cross-origin frames to use the same bubbling code.
We are considering adding support for this to Boomerang.
6.4 Synthetic Monitoring
In the absence of having perfect Visibility via the above two methods, it makes sense to supplement your Real User Monitoring analytics with synthetic monitoring as well, which will have access to 100% of the resources.
You could also use synthetic tools to understand the average percentage of Missing resources, and use this to mentally adjust any RUM ResourceTiming data.
7. Summary
ResourceTiming is a fantastic API that has given us insight into previously invisible data. With ResourceTiming, we can get a good sense of how long critical resources are taking on real page loads and beyond.
Unfortunately, due to security and privacy restrictions, ResourceTiming data is limited or missing in many real-world site configurations. This makes it really hard to track your third party libraries and ads, or gather an accurate Page Weight,
My hope is that we get more third-party services to add Timing-Allow-Origin to all of the resources being commonly fetched. It’s not clear if there’s anything we can do to get more visibility into cross-origin frames, other than convincing them to always “bubble up” their resources.
For more information on how this data was gathered, you can look at the resourcetiming-visibility Github repo.
I’ve also put the raw data into a BigQuery dataset: wolverine-digital:resourcetiming_visibility.
Thanks to Charlie Vazac and the Boomerang team for feedback on this article.
One additional reason why an entry might not show up in ResourceTiming:
This is currently not working in Chrome but may happen soon.