Table Of Contents
- Introduction
- Methodology
- Audit
- Boomerang Lifecycle
- Loader Snippet
- mPulse CDN
- boomerang.js size
- boomerang.js Parse Time
- boomerang.js
init()
config.json (mPulse)- Work at
onload
- The Beacon
- Work beyond
onload
- Work at Unload
- TL;DR Summary
- Why did we write this article?
1. Introduction
Boomerang is an open-source JavaScript library that measures the page load experience of real users, commonly called RUM (Real User Measurement).
Boomerang’s mission is to measure all aspects of the user’s experience, while not affecting the load time of the page or causing a degraded user experience in any noticeable way (avoiding the Observer Effect). It can be loaded in an asynchronous way that will not delay the page load even if boomerang.js is unavailable.
This post will perform an honest audit of the entire “cost” of Boomerang on a page that it is measuring. We will review every aspect of Boomerang’s lifecycle, starting with the loader snippet through sending a beacon, and beyond. At each phase, we will try to quantify any overhead (JavaScript, network, etc) it causes. The goal is to be open and transparent about the work Boomerang has to do when measuring the user’s experience.
While it is impossible for Boomerang to cause zero overhead, Boomerang strives to be as minimal and lightweight as possible. If we find any inefficiencies along the way, we will investigate alternatives to improve the library.
You can skip down to the TL;DR at the end of this article if you just want an executive summary.
Update 2019-12: We’ve made some performance improvements since this article was originally written. You can read about them here and some sections have been updated to note the changes.
boomerang.js
Boomerang is an open-source library that is maintained by the developers at Akamai.
mPulse, the Real User Monitoring product from Akamai, utilizes a customized version of Boomerang for its performance measurements. The differences between the open-source boomerang.js and mPulse’s boomerang.js are mostly in the form of additional plugins mPulse uses to fetch a domain’s configuration and features.
While this audit will be focused on mPulse’s boomerang.js, most of the conclusions we draw can be applied to the open-source boomerang.js as well.
2. Methodology
This audit will be done on mPulse boomerang.js version 1.532.0.
While Boomerang captures performance data for all browsers going back to IE 6 and onward, this audit will primarily be looking at modern browsers: Chrome, Edge, Safari and Firefox. Modern browsers provide superior profiling and debugging tools, and theoretically provide the best performance.
Modern browsers also feature performance APIs such as NavigationTiming, ResourceTiming and PerformanceObserver. Boomerang will utilize these APIs, if available, and it is important to understand the processing required to use them.
Where possible, we will share any performance data we can in older browsers and on slower devices, to help compare best- and worst-case scenarios.
mPulse uses a customized version of the open-source Boomerang project. Specifically, it contains four extra mPulse-specific plugins. The plugins enabled in mPulse’s boomerang.js v1.532.0 are:
config-override.js (mPulse-only)page-params.js (mPulse-only)iframe-delay.jsauto-xhr.jsspa.jsangular.jsbackbone.jsember.jshistory.jsrt.jscross-domain.js (mPulse-only)bw.jsnavtiming.jsrestiming.jsmobile.jsmemory.jscache-reload.jsmd5.jscompression.jserrors.jsthird-party-analytics.jsusertiming-compression.jsusertiming.jsmq.jslogn.js (mPulse-only)
For more information on any of these plugins, you can read the Boomerang API documentation.
3. Audit
With that, let’s get a brief overview of how Boomerang operates!
3.1 Boomerang Lifecycle
From the moment Boomerang is loaded on a website to when it sends a performance data beacon, the following is a diagram and overview of Boomerang’s lifecycle (as seen by Chrome Developer Tools’ Timeline):
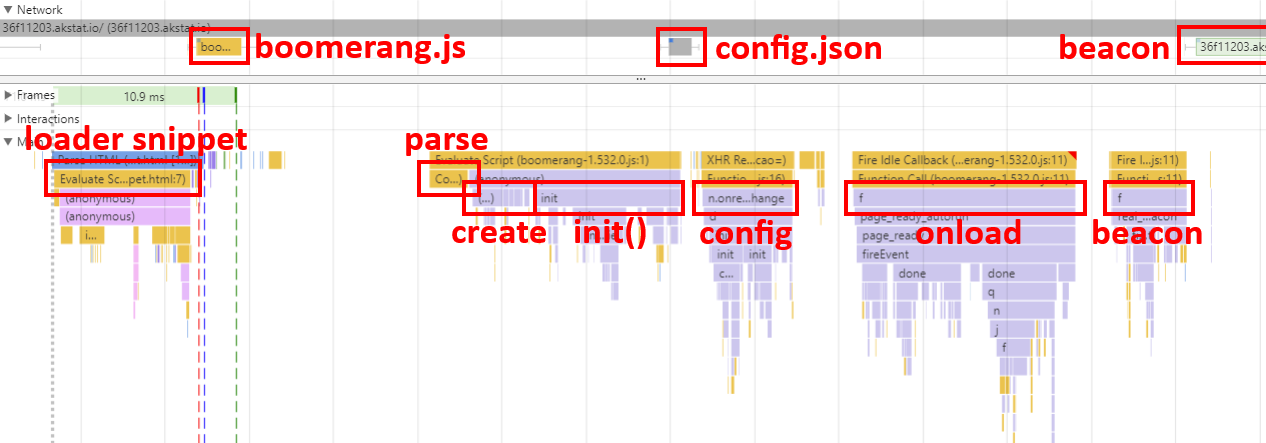
- The Boomerang Loader Snippet is placed into the host page. This snippet loads boomerang.js in an asynchronous, non-blocking manner.
- The browser fetches boomerang.js from the remote host. In the case of mPulse’s boomerang.js, this is from the Akamai CDN.
- Once boomerang.js arrives on the page, the browser must parse and execute the JavaScript.
- On startup, Boomerang initializes itself and any bundled plugins.
- mPulse’s boomerang.js then fetches
config.json from the Akamai CDN.
- At some point the page will have loaded. Boomerang will wait until after all of the
load event callbacks are complete, then it will gather all of the performance data it can.
- Boomerang will ask all of the enabled plugins to add whatever data they want to the beacon.
- Once all of the plugins have completed their work, Boomerang will build the beacon and will send it out the most reliable way it can.
Each of these stages may cause work in the browser:
- JavaScript parsing time
- JavaScript executing time
- Network overhead
The rest of this article will break down each of the above phases and we will dive into the ways Boomerang requires JavaScript or network overhead.
3.2 Loader Snippet
(Update 2019-12: The Loader Snippet has been rewritten for modern browsers, see this update for details.)
We recommend loading boomerang.js using the non-blocking script loader pattern. This methodology, developed by Philip Tellis and others, ensures that no matter how long it takes boomerang.js to load, it will not affect the page’s onload event. We recommend mPulse customers use this pattern to load boomerang.js whenever possible; open-source users of boomerang.js can use the same snippet, pointing at boomerang.js hosted on their own CDN.
The non-blocking script loader pattern is currently 47 lines of code and around 890 bytes. Essentially, an <iframe> is injected into the page, and once that IFRAME’s onload event fires, a <script> node is added to the IFRAME to load boomerang.js. Boomerang is then loaded in the IFRAME, but can access the parent window’s DOM to gather performance data when needed.
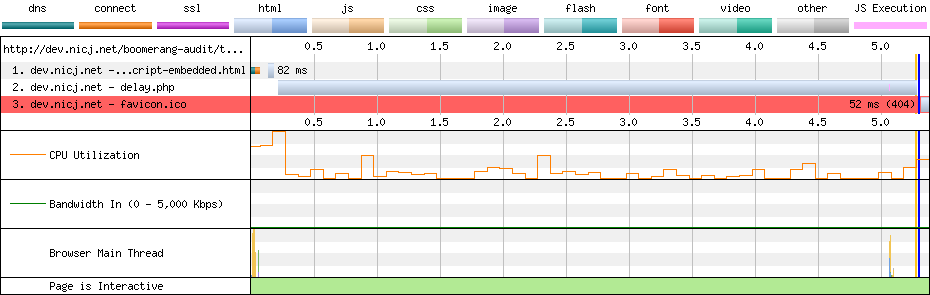
For proof that the non-blocking script loader pattern does not affect page load, you can look at this test case and these WebPagetest results:
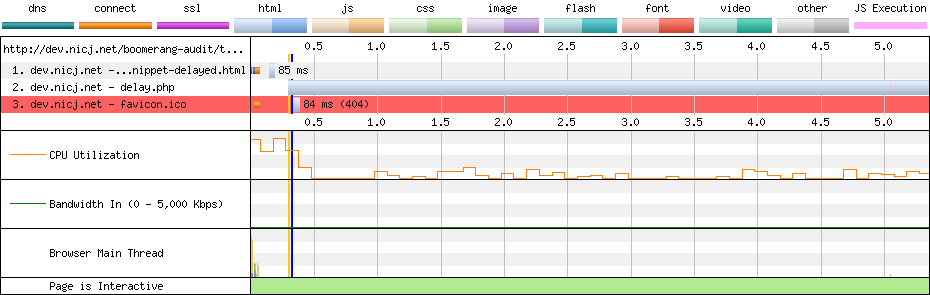
In the example above, we’re using the non-blocking script loader pattern, and the JavaScript is being delayed by 5 seconds. WebPagetest shows that the page still loaded in just 0.323s (the blue vertical line) while the delayed JavaScript request took 5.344s to complete.
You can review the current version of the mPulse Loader Snippet if you’d like.
Common Ways of Loading JavaScript
Why not just add a <script> tag to load boomerang.js directly into the page’s DOM? Unfortunately, all of the common ways of adding <script> tags to a page will block the onload if the script loads slowly. These include:
<script> tags embedded in the HTML from the server<script> tags added at runtime by JavaScript<script> tags with async or defer
Notably, async and defer remove the <script> tag from the critical path, but will still block the page’s onload event from firing until the script has been loaded.
Boomerang strives to not affect the host page’s performance timings, so we don’t want to affect when onload fires.
Examples of each of the common methods above follow:
<script> tags embedded in the HTML from the server
The oldest way of including JavaScript in a page — directly via a <script src="..."> tag, will definitely block the onload event.
In this WebPagetest result, we see that the 5-second JavaScript delay causes the page’s load time (blue vertical line) to be 5.295 seconds:
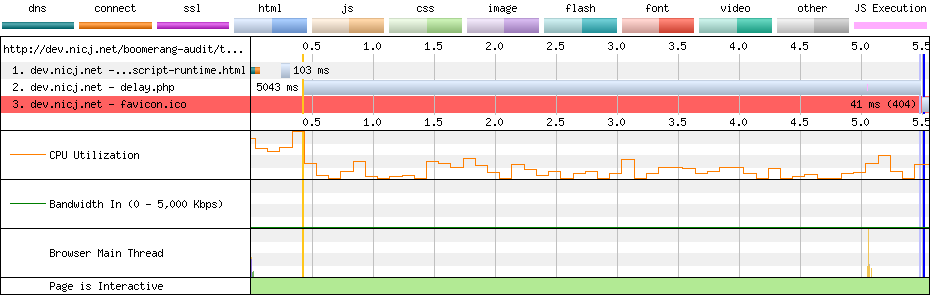
Other events such as domInteractive and domContentLoaded are also delayed.
<script> tags added at runtime by JavaScript
Many third-party scripts suggest adding their JavaScript to your page via a snippet similar to this:
<script>
var newScript = document.createElement('script');
var otherScript = document.getElementsByTagName('script')[0];
newScript.async = 1;
newScript.src = "...";
otherScript.parentNode.insertBefore(newScript, otherScript);
</script>
This script creates a <script> node on the fly, then inserts it into the document adjacent to the first <script> node on the page.
Unfortunately, while this helps ensure the domInteractive and domContentLoaded events aren’t delayed by the 5-second JavaScript, the onload event is still delayed. See the WebPagetest result for more details:
<script> tags with async or defer
<script> async and defer attributes change how scripts are loaded. For both, while the browser will not block document parsing, the onload event will still be blocked until the JavaScript has been loaded.
See this WebPagetest result for an example. domInteractive and domContentLoaded events aren’t delayed, but the onload event still takes 5.329s to fire:
Loader Snippet Overhead
Now that we’ve looked why you shouldn’t use any of the standard methods of loading JavaScript to load Boomerang, let’s see how the non-blocking script loader snippet works and what it costs.
The work being done in the snippet is pretty minimal, but this code needs to be run in a <script> tag in the host page, so it will be executed in the critical path of the page.
For most modern browsers and devices, the amount of work caused by the snippet should not noticeably affect the page’s load time. When profiling the snippet, you should see it take only about 2-15 milliseconds of CPU (with an exception for Edge documented below). This amount of JavaScript CPU time should be undetectable on most webpages.
Here’s a breakdown of the CPU time of the non-blocking loader snippet profiled from various devices:
| Device | OS | Browser | Loader Snippet CPU time (ms) |
|---|
| PC Desktop | Win 10 | Chrome 62 | 7 |
| PC Desktop | Win 10 | Firefox 57 | 2 |
| PC Desktop | Win 10 | IE 10 | 12 |
| PC Desktop | Win 10 | IE 11 | 46 |
| PC Desktop | Win 10 | Edge 41 | 66 |
| MacBook Pro (2017) | macOS High Sierra | Safari 11 | 2 |
| Galaxy S4 | Android 4 | Chrome 56 | 37 |
| Galaxy S8 | Android 7 | Chrome 63 | 9 |
| iPhone 4 | iOS 7 | Safari 7 | 19 |
| iPhone 5s | iOS 11 | Safari 11 | 9 |
| Kindle Fire 7 (2016) | Fire OS 5 | Silk | 33 |
(Update 2019-12: The Loader Snippet has been rewritten for modern browsers, and the overhead has been reduced. See this update for details.)
We can see that most modern devices / browsers will execute the non-blocking loader snippet in under 10ms. For some reason, recent versions of IE / Edge on a fast Desktop still seem to take up to 66ms to execute the snippet — we’ve filed a bug against the Edge issue tracker.
On older (slower) devices, the loader snippet takes between 20-40ms to execute.
Let’s take a look at profiles for Chrome and Edge on the PC Desktop.
Chrome Loader Snippet Profile
Here’s an example Chrome 62 (Windows 10) profile of the loader snippet in action.
In this example, the IFRAME doesn’t load anything itself, so we’re just profiling the wrapper loader snippet code:
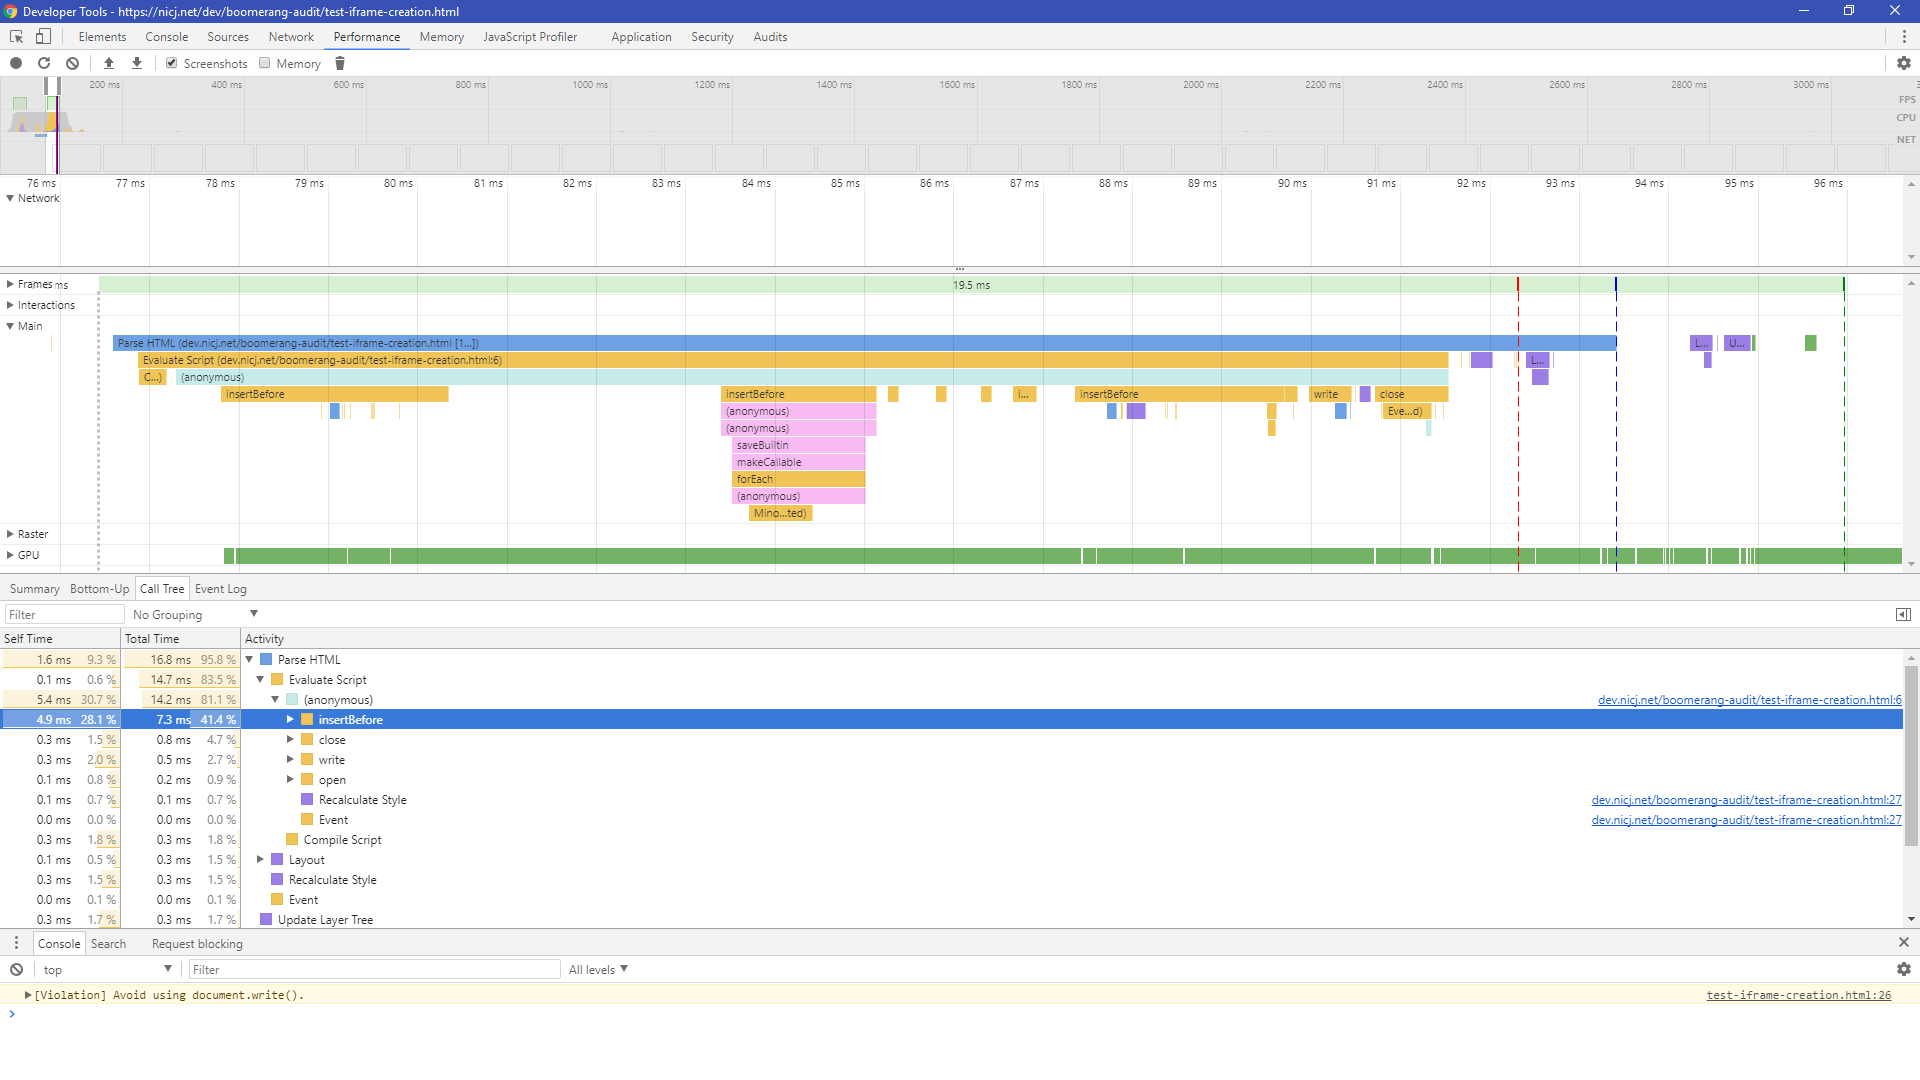
In general, we find that Chrome spends:
- <1ms parsing the loader snippet
- ~5-10ms executing the script and creating the IFRAME
Edge Loader Snippet Profile
Here’s an example Edge 41 (Windows 10) profile of the loader snippet:
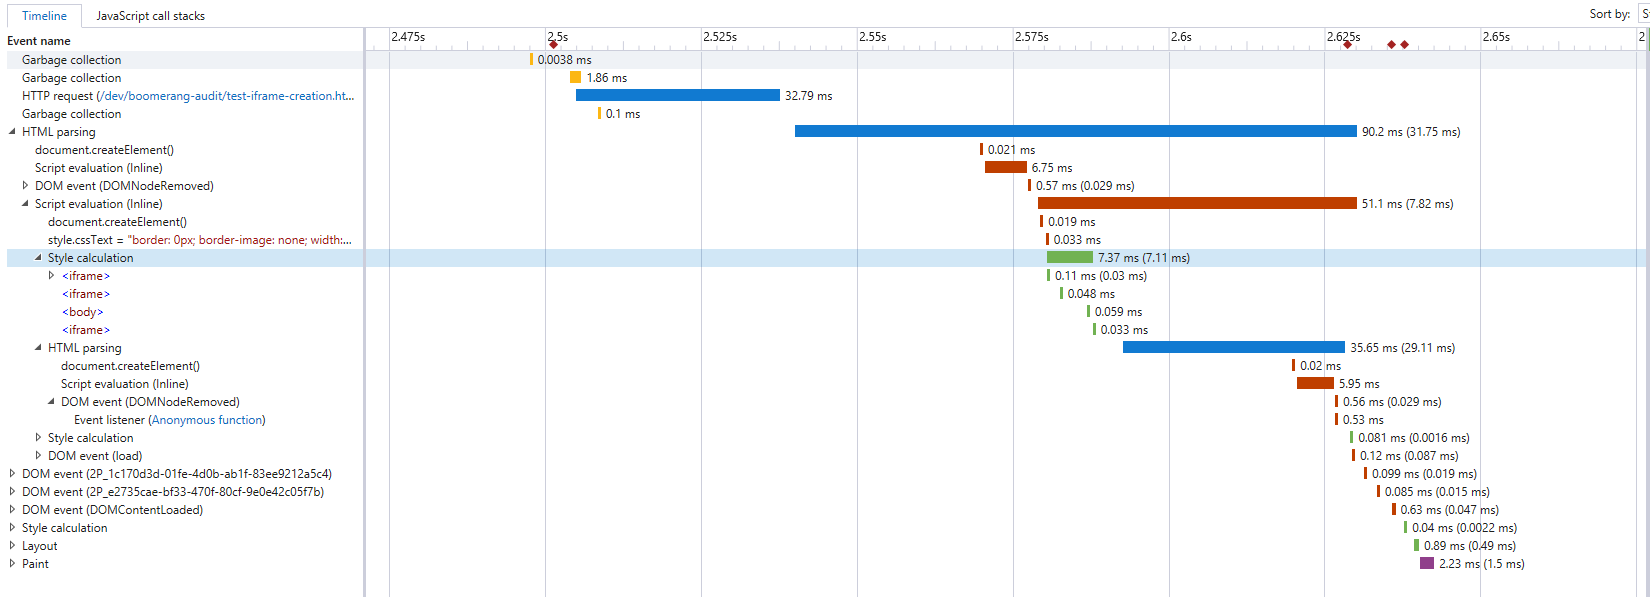
We can see that the loader snippet is more expensive in Edge (and IE 11) than any other platform or browser, taking up to 50ms to execute the loader snippet.
In experimenting with the snippet and looking at the profiling, it seems the majority of this time is caused by the document.open()/write()/close() sequence. When removed, the rest of the snippet takes a mere 2-5ms.
We have filed a bug against the Edge team to investigate. We have also filed a bug against ourselves to see if we can update the document in a way that doesn’t cause so much work in Edge.
Getting the Loader Snippet out of the Critical Path
If the overhead of the loader snippet is of a concern, you can also defer loading boomerang.js until after the onload event has fired. We don’t recommend loading boomerang.js that late, if possible — the later it loads, the higher the possibility you will “lose” traffic because boomerang.js doesn’t load before the user navigates away.
We have example code for how to do this in the Boomerang API docs.
Future Loader Snippet Work
We are currently experimenting with other ways of loading Boomerang in an asynchronous, non-blocking manner that does not require the creation of an anonymous IFRAME.
You can follow the progress of this research on the Boomerang Issues page.
Update 2019-12: The Loader Snippet has been rewritten to improve performance in modern browsers. See this update for details.
3.3 mPulse CDN
Now that we’ve convinced the browser to load boomerang.js from the network, how is it actually fetched?
Loading boomerang.js from a CDN is highly recommended. The faster Boomerang arrives on the page, the higher chance it has to actually measure the experience. Boomerang can arrive late on the page and still capture all of the performance metrics it needs (due to the NavigationTiming API), but there are downsides to it arriving later:
- The longer it takes Boomerang to load, the less likely it’ll arrive on the page before the user navigates away (missing beacons)
- If the browser does not support NavigationTiming, and if Boomerang loads after the
onload event, (and if the loader snippet doesn’t also save the onload timestamp), the Page Load time may not be accurate
- If you’re using some of the Boomerang plugins such as
Errors (JavaScript Error Tracking) that capture data throughout the page’s lifecycle, they will not capture the data until Boomerang is on the page
For all of these reasons, we encourage the Boomerang Loader Snippet to be as early as possible in the <head> of the document and for boomerang.js to be served from a performant CDN.
boomerang.js via the Akamai mPulse CDN
For mPulse customers, boomerang.js is fetched via the Akamai CDN which provides lightning-quick responses from the closest location around the world.
According to our RUM data, the boomerang.js package loads from the Akamai CDN to visitors’ browsers in about 191ms, and is cached by the browser for 50% of page loads.
Note that because of the non-blocking loader snippet, even if Boomerang loads slowly (or not at all), it should have zero effect on the page’s load time.
The URL will generally look something like this:
https://c.go-mpulse.net/boomerang/API-KEY
https://s.go-mpulse.net/boomerang/API-KEY
Fetching boomerang.js from the above location will result in HTTP response headers similar to the following:
Cache-Control: max-age=604800, s-maxage=604800, stale-while-revalidate=60, stale-if-error=3600
Connection: keep-alive
Content-Encoding: gzip
Content-Type: application/javascript;charset=UTF-8
Date: [date]
Expires: [date + 7 days]
Timing-Allow-Origin: *
Transfer-Encoding: chunked
Vary: Accept-Encoding
(Note: these domains are not currently HTTP/2 enabled. However, HTTP/2 doesn’t provide a lot of benefit for a third-party service unless it needs to load multiple resources in parallel. In the case of Boomerang, boomerang.js, config.json and the beacon are all independent requests that will never overlap)
The headers that affect performance are Cache-Control, Content-Encoding and Timing-Allow-Origin:
Cache-Control
Cache-Control: max-age=604800, s-maxage=604800, stale-while-revalidate=60, stale-if-error=3600
The Cache-Control header tells the browser to cache boomerang.js for up to 7 days. This helps ensure that subsequent visits to the same site do not need to re-fetch boomerang.js from the network.
For our mPulse customers, when the boomerang version is updated, using a 7-day cache header means it may take up to 7 days for clients to get the new boomerang.js version. We think that a 7-day update time is a smart trade-off for cache-hit-rate vs. upgrade delay.
For open-source Boomerang users, we recommend using a versioned URL with a long expiry (e.g. years).
Using these headers, we generally see about 50% of page loads have boomerang.js in the cache.
Content-Encoding
Content-Encoding: gzip
Content-Encoding means boomerang.js is encoded via gzip, reducing its size over the wire. This reduces the transfer cost of boomerang.js to about 28% of its original size.
The Akamai mPulse CDN also supports Brotli (br) encoding. This reduces the transfer cost of boomerang.js to about 25% of its original size.
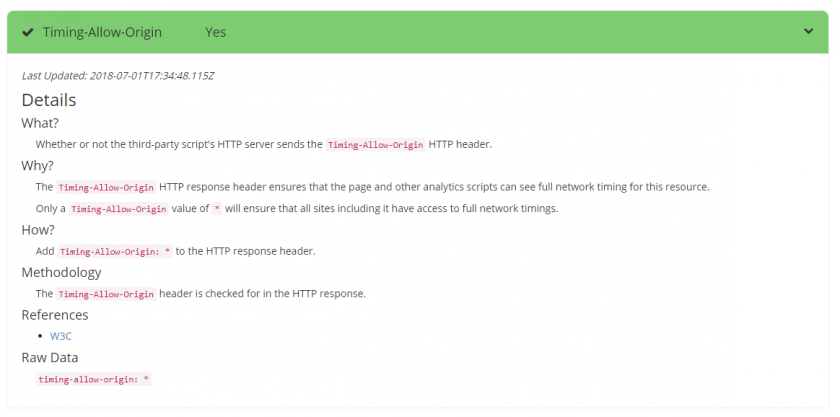
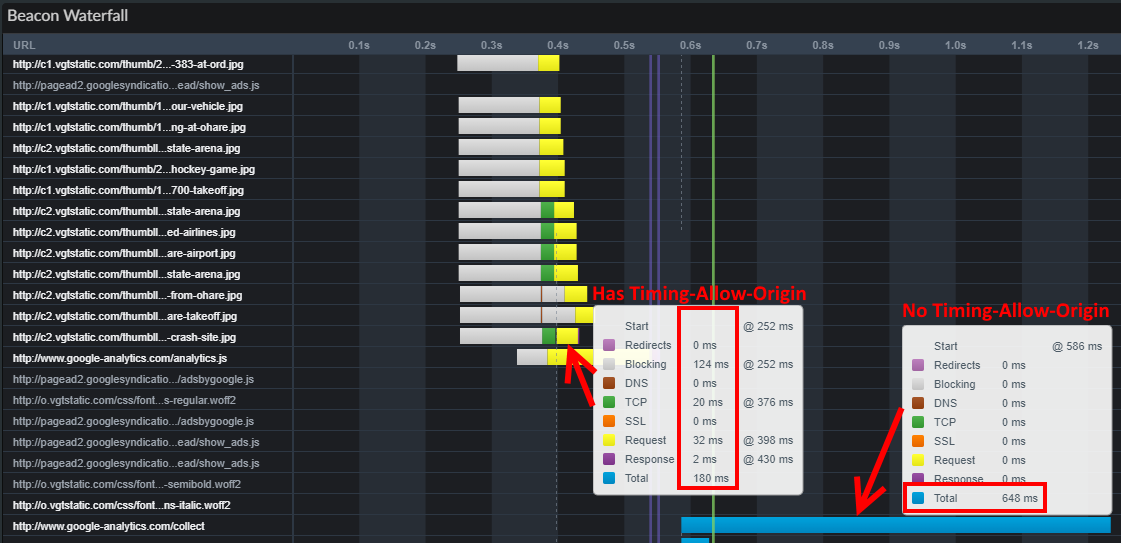
Timing-Allow-Origin
Timing-Allow-Origin: *
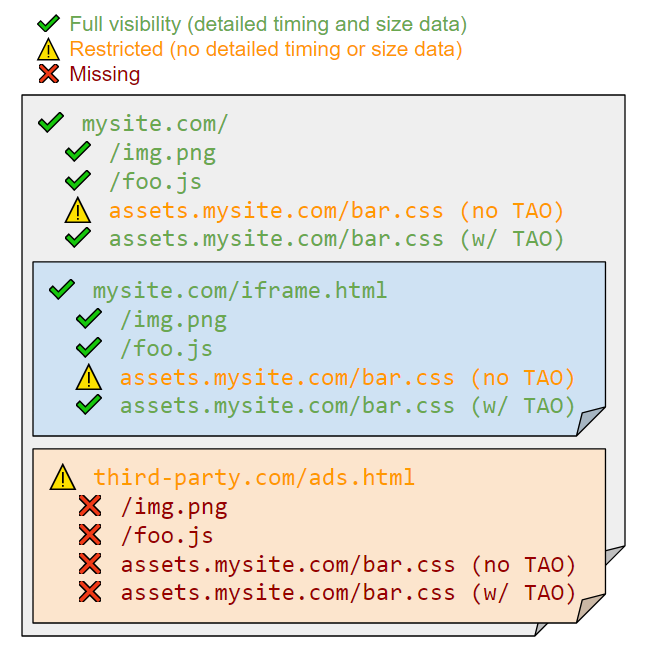
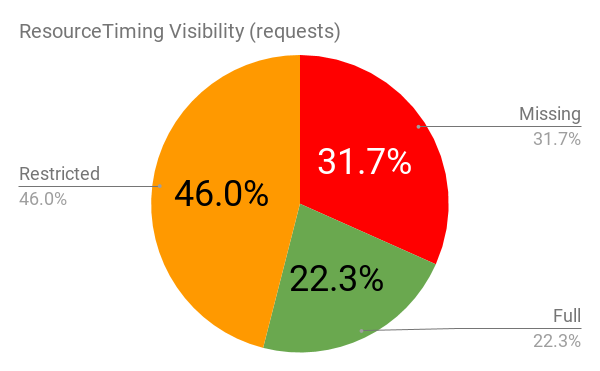
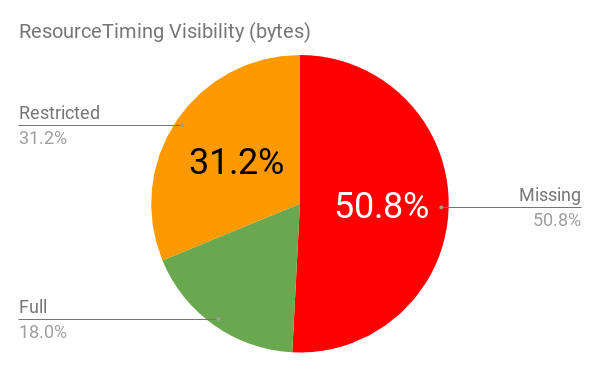
The Timing-Allow-Origin header is part of the ResourceTiming spec. If not set, cross-origin resources will only expose the startTime and responseEnd timestamps to ResourceTiming.
We add Timing-Allow-Origin to the HTTP response headers on the Akamai CDN so our customers can review the load times of boomerang.js from their visitors.
3.4 boomerang.js size
Update 2019-12: Boomerang’s size has been reduced from a few improvements. See this update for details.
boomerang.js generally comes packaged with multiple plugins. See above for the plugins used in mPulse’s Boomerang.
The combined source input file size (with debug comments, etc) of boomerang.js and the plugins is 630,372 bytes. We currently use UglifyJS2 for minification, which reduces the file size down to 164,057 bytes. Via the Akamai CDN, this file is then gzip compressed to 47,640 bytes, which is what the browser must transfer over the wire.
We are investigating whether other minifiers might shave some extra bytes off. It looks like UglifyJS3 could reduce the minified file size down to about 160,490 bytes (saving 3,567 bytes), though this only saves ~500 bytes after gzip compression. We used YUI Compressor in the past, and have tested other minifiers such as Closure, but UglifyJS has provided the best and most reliable minification for our needs.
As compared to the top 100 most popular third-party scripts, the minified / gzipped Boomerang package is in the 80th percentile for size. For reference, Boomerang is smaller than many popular bundled libraries such as AngularJS (111 kB), Ember.js (111 kB), Knockout (58 kB), React (42 kB), D3 (81 kB), moment.js (59 kB), jQuery UI (64 kB), etc.
That being said, we’d like to find ways to reduce its size even further. Some options we’re considering:
Enabling Brotli compression at the CDN. This would reduce the package size to about 41,000 bytes over the wire. (implemented in 2019)- Only sending plugins to browsers that support the specific API. For example, not sending the
ResourceTiming plugin to browsers that don’t support it.
- For mPulse customers, having different builds of Boomerang with different features enabled. For customers wanting a smaller package, that are willing to give up support for things like JavaScript Error Tracking, they could use a customized build that is smaller.
For open-source users of Boomerang, you have the ability to build Boomerang precisely for your needs by editing plugins.json. See the documentation for details.
3.5 boomerang.js Parse Time
Once the browser has fetched the boomerang.js payload from the network, it will need to parse (compile) the JavaScript before it can execute it.
It’s a little complicated to reliably measure how long the browser takes to parse the JavaScript. Thankfully there has been some great work from people like Carlos Bueno, Daniel Espeset and Nolan Lawson, which can give us a good cross-browser approximation of parse/compile that matches up well to what browser profiling in developer tools shows us.
Across our devices, here’s the amount of time browsers are spending parsing boomerang.js:
| Device | OS | Browser | Parse time (ms) |
|---|
| PC Desktop | Win 10 | Chrome 62 | 11 |
| PC Desktop | Win 10 | Firefox 57 | 6 |
| PC Desktop | Win 10 | IE 10 | 7 |
| PC Desktop | Win 10 | IE 11 | 6 |
| PC Desktop | Win 10 | Edge 41 | 6 |
| MacBook Pro (2017) | macOS High Sierra | Safari 11 | 6 |
| Galaxy S4 | Android 4 | Chrome 56 | 47 |
| Galaxy S8 | Android 7 | Chrome 63 | 13 |
| iPhone 4 | iOS 7 | Safari 7 | 42 |
| iPhone 5s | iOS 11 | Safari 11 | 12 |
| Kindle Fire 7 (2016) | Fire OS 5 | Silk | 41 |
In our sample of modern devices, we see less than 15 milliseconds parsing the boomerang.js JavaScript. Older (lower powered) devices such as the Galaxy S4 and Kindle Fire 7 may take up to 42 milliseconds to parse the JavaScript.
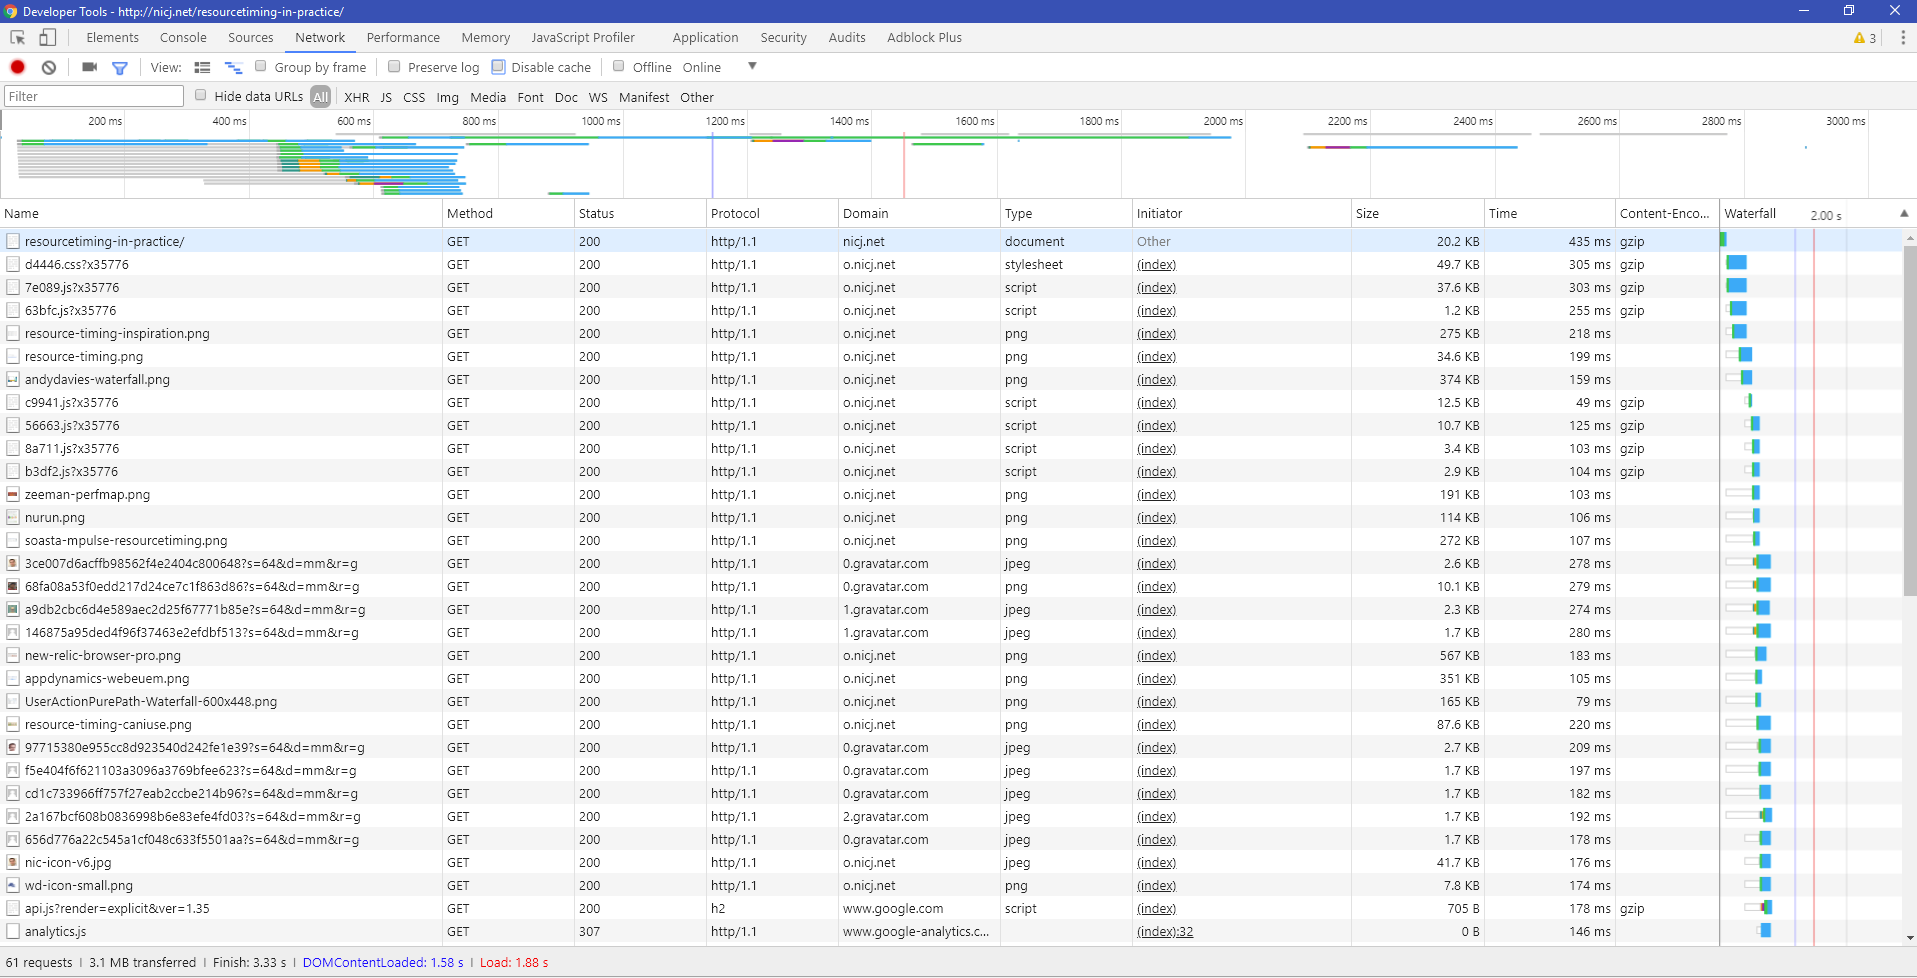
To measure the parse time, we’ve created a test suite that injects the boomerang.js source text into a <script> node on the fly, with random characters appended (to avoid the browser’s cache). This is based on the idea from Nolan Lawson, and matches pretty well to what is seen in Chrome Developer tools:
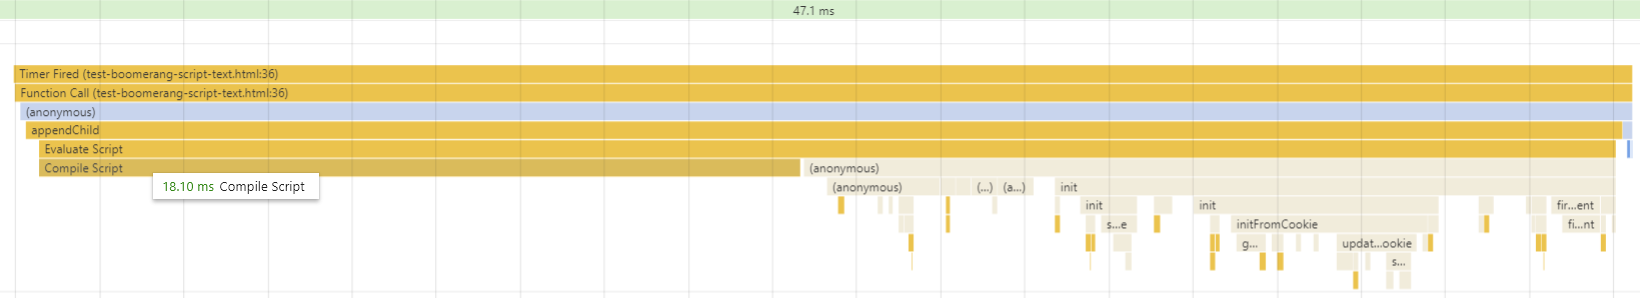
Possible Improvements
There’s not a lot we can do to improve the browser’s parse time, and different browsers may do more work during parsing than others.
The primary way for us to reduce parse time is to reduce the overall complexity of the boomerang.js package. Some of the changes we’re considering (which will especially help the slower devices) were discussed in the previous section on boomerang.js’ size.
3.6 boomerang.js init()
After the browser parses the boomerang.js JavaScript, it should execute the bootstrapping code in the boomerang.js package. Boomerang tries to do as little work as possible at this point — it wants to get off the critical path quickly, and defer as much work as it can to after the onload event.
When loaded, the boomerang.js package will do the following:
- Create the global
BOOMR object
- Create all embedded
BOOMR.plugins.* plugin objects
- Initialize the
BOOMR object, which:
- Registers event handlers for important events such as
pageshow, load, beforeunload, etc
- Looks at all of the plugins underneath
BOOMR.plugins.* and runs .init() on all of them
In general, the Boomerang core and each plugin takes a small amount of processing to initialize their data structures and to setup any events that they will later take action on (i.e. gather data at onload).
Below is the measured cost of Boomerang initialization and all of the plugins’ init():
| Device | OS | Browser | init() (ms) |
|---|
| PC Desktop | Win 10 | Chrome 62 | 10 |
| PC Desktop | Win 10 | Firefox 57 | 7 |
| PC Desktop | Win 10 | IE 10 | 6 |
| PC Desktop | Win 10 | IE 11 | 8 |
| PC Desktop | Win 10 | Edge 41 | 11 |
| MacBook Pro (2017) | macOS High Sierra | Safari 11 | 3 |
| Galaxy S4 | Android 4 | Chrome 56 | 12 |
| Galaxy S8 | Android 7 | Chrome 63 | 8 |
| iPhone 4 | iOS 7 | Safari 7 | 10 |
| iPhone 5s | iOS 11 | Safari 11 | 8 |
| Kindle Fire 7 (2016) | Fire OS 5 | Silk | 15 |
Most modern devices are able to do this initialization in under 10 milliseconds. Older devices may take 10-20 milliseconds.
Here’s a sample Chrome Developer Tools visual of the entire initialization process:
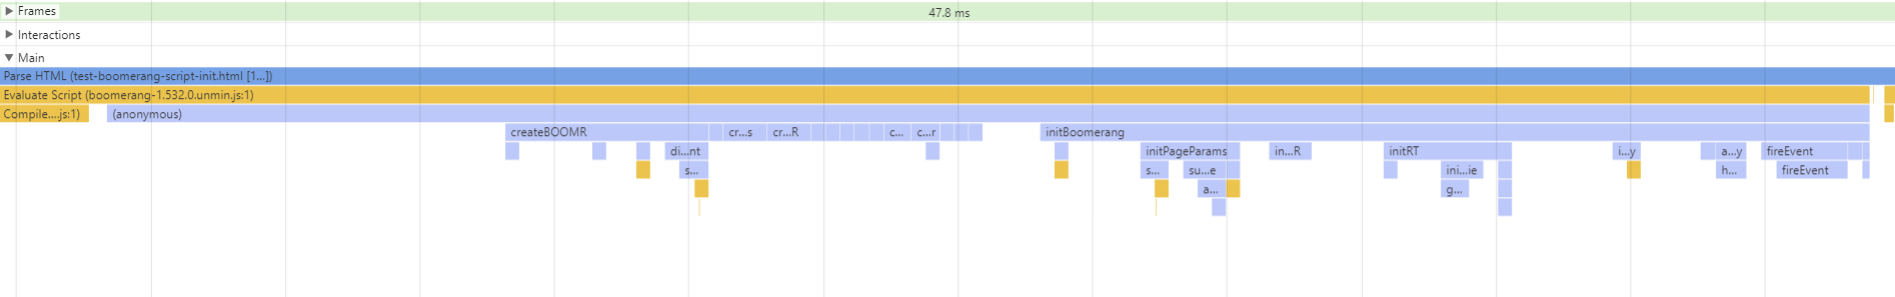
In the above trace, the initialization takes about 13 milliseconds. Broken down:
- General script execution: 3ms
- Creating the
BOOMR object: 1.5ms
- Creating all of the plugins: 2ms
- Initializing
BOOMR, registering event handlers, etc: 7.5ms
- Initializing plugins: 2ms
Possible Improvements
In looking at various Chrome and Edge traces of the creation/initialization process, we’ve found a few inefficiencies in our code.
Since initialization is done in the critical path to page load, we want to try to minimize the amount of work done here. If possible, we should delay work to after the onload event, before we’re about to send the beacon.
In addition, the script currently executes all code sequentially. We can considering breaking up this solid block of code into several chunks, executed on a setTimeout(..., 0). This will help reduce the possibility of a Long Task (which can lead to UI delays and visitor frustration). The plugin creation and initialization is all done sequentially right now, and each could probably be executed after a short delay to allow for any other work that needs to run.
We’ve identified the following areas of improvement:
Bootstrapping Summary
So where are we at so far?
- The Boomerang Loader Snippet has executed, told the browser to fetch boomerang.js in an asynchronous, non-blocking way.
boomerang.js was fetched from the CDN- The browser has parsed the
boomerang.js package
- The
BOOMR object and all of the plugins are created and initialized
On modern devices, this will take around 10-40ms. On slower devices, this could take 60ms or more.
What’s next? If you’re fetching Boomerang as part of mPulse, Boomerang will initiate a config.json request to load the domain’s configuration. Users of the open-source Boomerang won’t have this step.
3.7 config.json (mPulse)
For mPulse, once boomerang.js has loaded, it fetches a configuration file from the mPulse servers. The URL looks something like:
https://c.go-mpulse.net/boomerang/config.json?...
This file is fetched via a XMLHttpRequest from the mPulse servers (on the Akamai CDN). Browser are pros at sending XHRs – you should not see any work being done to send the XHR.
Since this fetch is a XMLHttpRequest, it is asynchronous and should not block any other part of the page load. config.json might arrive before, or after, onload.
The size of the config.json response will vary by app. A minimal config.json will be around 660 bytes (430 bytes gzipped). Large configurations may be upward of 10 kB (2 kB gzipped). config.json contains information about the domain, an Anti-Cross-Site-Request-Forgery token, page groups, dimensions and more.
On the Akamai CDN, we see a median download time of config.json of 240ms. Again, this is an asynchronous XHR, so it should not block any work in the browser, but config.json is required before a beacon can be sent (due to the Anti-CSRF token), so it’s important that it’s fetched as soon as possible. This takes a bit longer to download than boomerang.js because it cannot be cached at the CDN.
config.json is served with the following HTTP response headers:
Cache-Control: private, max-age=300, stale-while-revalidate=60, stale-if-error=120
Timing-Allow-Origin: *
Content-Encoding: gzip
Note that the Cache-Control header specifies config.json should only be cached by the browser for 5 minutes. This allows our customers to change their domain’s configuration and see the results within 5 minutes.
Once config.json is returned, the browser must parse the JSON. While the time it takes depends on the size of config.json, we were not able to convince any browser to take more than 1 millisecond parsing even the largest config.json response.
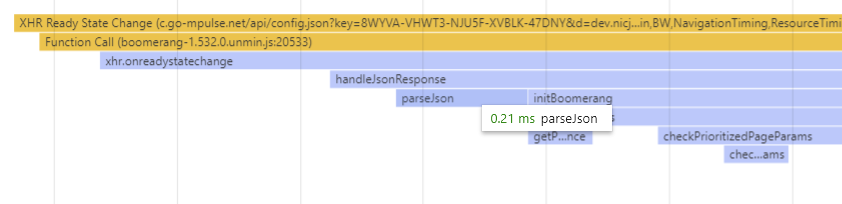
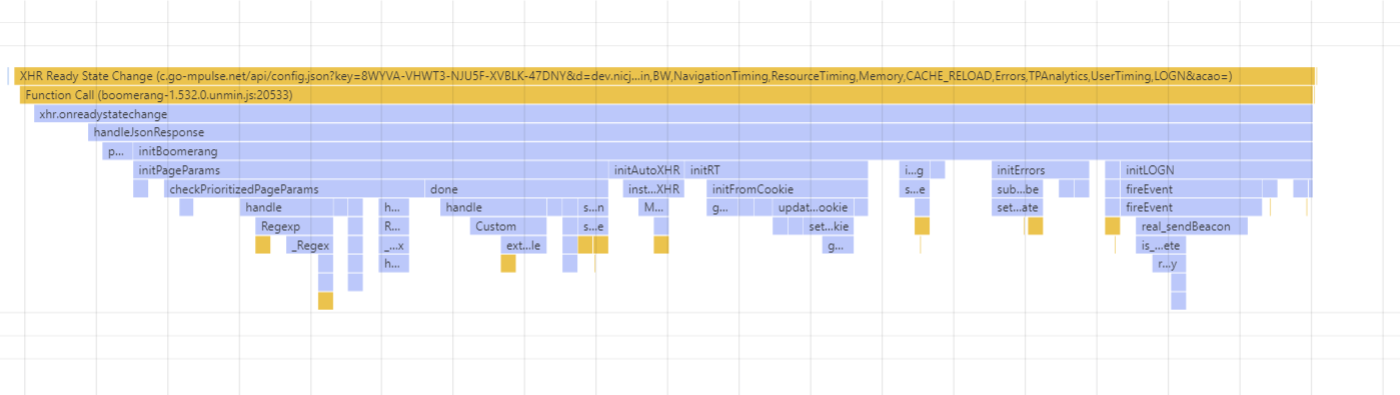
After the JSON is parsed, Boomerang sends the configuration to each of the plugins again (calling BOOMR.plugins.X.init() a second time). This is required as many plugins are disabled by default, and config.json turns features such as ResourceTiming, SPA instrumentation and others on, if enabled.
| Device | OS | Browser | config.json init() (ms) |
|---|
| PC Desktop | Win 10 | Chrome 62 | 5 |
| PC Desktop | Win 10 | Firefox 57 | 7 |
| PC Desktop | Win 10 | IE 10 | 5 |
| PC Desktop | Win 10 | IE 11 | 5 |
| PC Desktop | Win 10 | Edge 41 | 5 |
| MacBook Pro (2017) | macOS High Sierra | Safari 11 | 3 |
| Galaxy S4 | Android 4 | Chrome 56 | 45 |
| Galaxy S8 | Android 7 | Chrome 63 | 10 |
| iPhone 4 | iOS 7 | Safari 7 | 30 |
| iPhone 5s | iOS 11 | Safari 11 | 10 |
| Kindle Fire 7 (2016) | Fire OS 5 | Silk | 20 |
Modern devices spend less than 10 milliseconds parsing the config.json response and re-initializing plugins with the data.
Possible Improvements
The same investigations we’ll be doing for the first init() case apply here as well:
3.8 Work at onload
Update 2019-12: Boomerang’s work at onload has been reduced in several cases. See this update for details.
By default, for traditional apps, Boomerang will wait until the onload event fires to gather, compress and send performance data about the user’s page load experience via a beacon.
For Single Page Apps, Boomerangs waits until the later of the onload event, or until all critical-path network activity (such as JavaScripts) has loaded. See the Boomerang documentation for more details on how Boomerang measures Single Page Apps.
Once the onload event (or SPA load event) has triggered, Boomerang will queue a setImmediate() or setTimeout(..., 0) call before it continues with data collection. This ensures that the Boomerang onload callback is instantaneous, and that it doesn’t affect the page’s “load time” — which is measured until all of the load event handlers are complete. Since Boomerang’s load event handler is just a setImmediate, it should not affect the loadEventEnd timestamp.
The setImmediate() queues work for the next period after all of the current tasks have completed. Thus, immediately after the rest of the onload handlers have finished, Boomerang will continue with gathering, compressing and beaconing the performance data.
At this point, Boomerang notifies any plugins that are listening for the onload event that it has happened. Each plugin is responsible for gathering, compressing and putting its data onto the Boomerang beacon. Boomerang plugins that add data at onload include:
RT adds general page load timestamps (overall page load time and other timers)NavigationTiming gathers all of the NavigationTiming timestampsResourceTiming adds information about each downloaded resource via ResourceTimingMemory adds statistics about the DOM- etc
Some plugins require more work than others, and different pages will be more expensive to process than others. We will sample the work being done during onload on 3 types of pages:
Profiling onload on a Blank Page
This is a page with only the minimal HTML required to load Boomerang. On it, there are 3 resources and the total onload processing time is about 15ms:
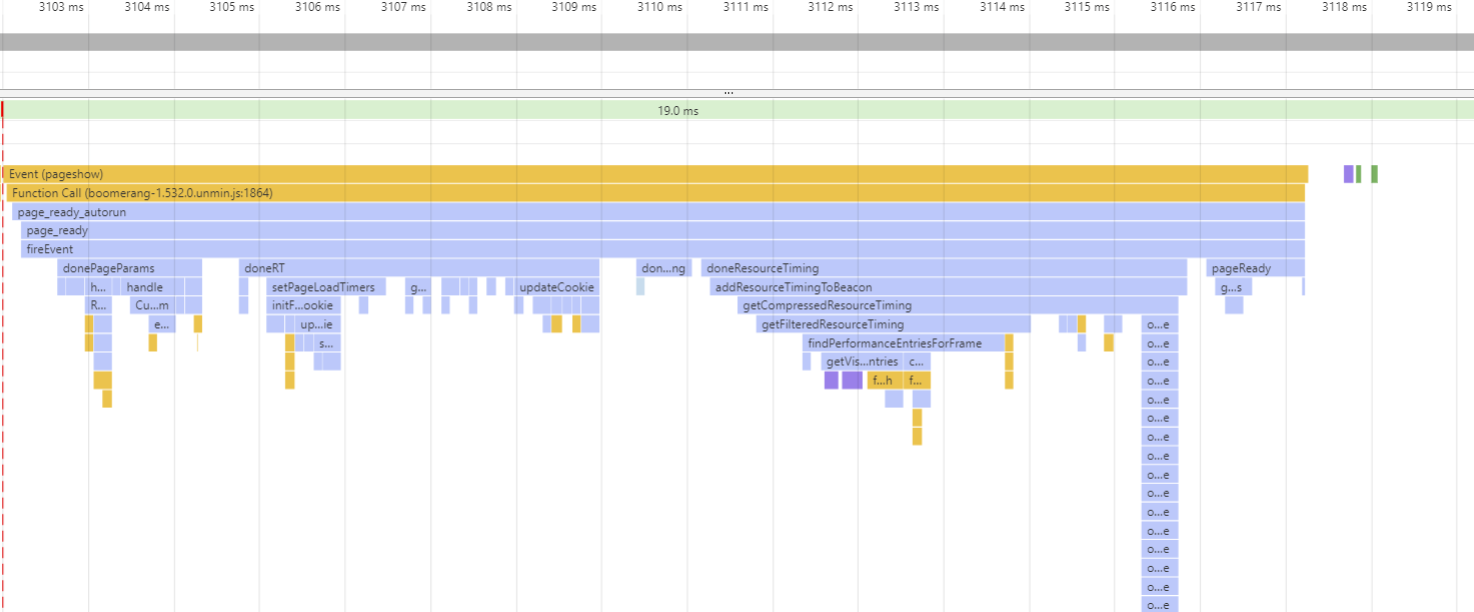
The majority of the time is spent in 3 plugins: PageParams, RT and ResourceTiming:
PageParams handles domain configuration such as page group definitions. The amount of work this plugin does depends on the complexity of the domain configuration.RT captures and calculates all of the timers on the pageResourceTiming compresses all of the resources on the page, and is usually the most “expensive” plugin due to the compression.
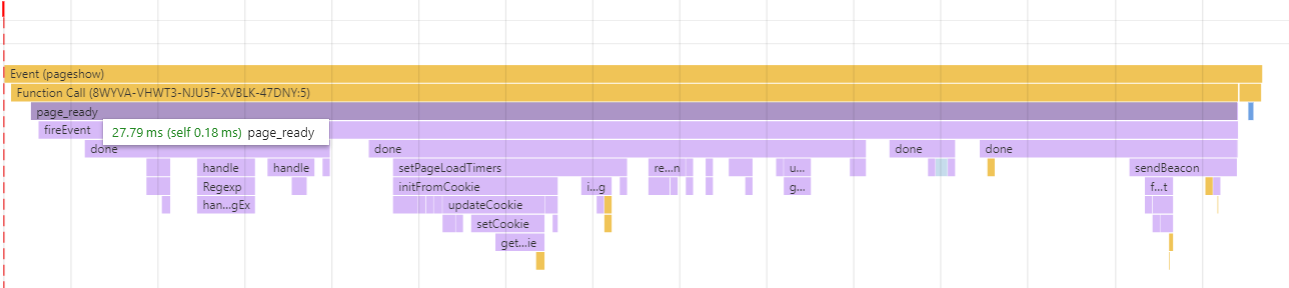
Profiling onload on a Blog
This is loading the nicj.net home page. Currently, there are 24 resources and the onload processing time is about 25ms:
The profile looks largely the same the empty page, with more time being spent in ResourceTiming compressing the resources. The increase of 10ms can be directly attributed to the additional resources.
Profiling a Galaxy S4 (one of the slower devices we’ve been looking at) doesn’t look too differently, taking only 28ms:
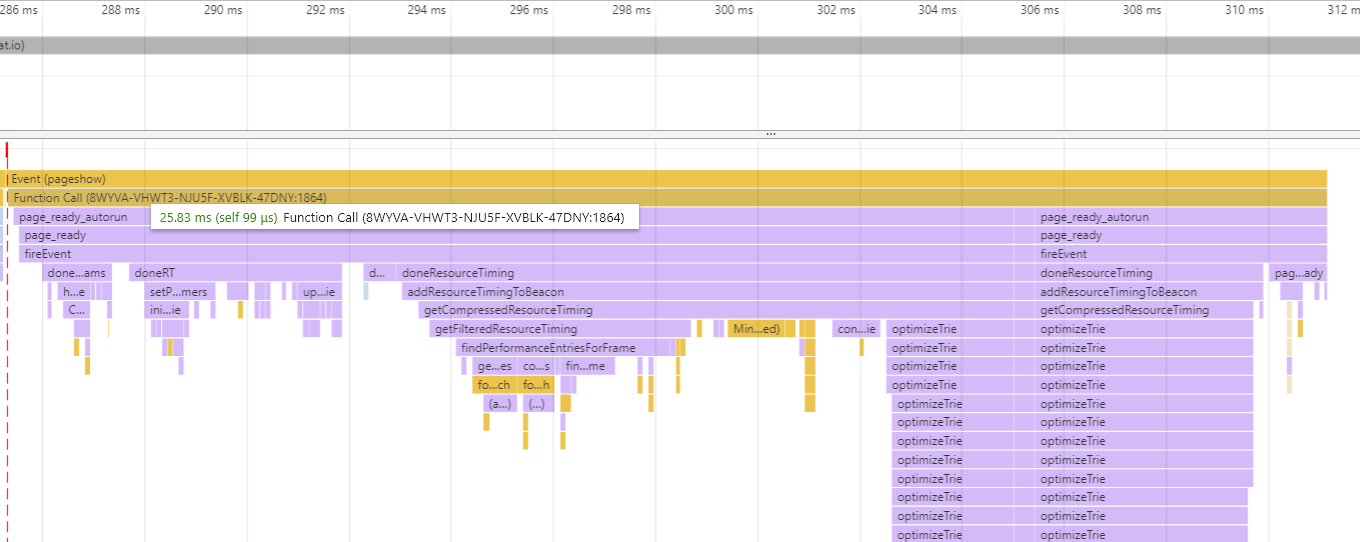
Profiling onload on a Retail Home Page
This is a load of the home page of a popular retail website. On it, there were 161 resources and onload processing time took 37ms:

Again, the profile looks largely the same as the previous two pages. On this page, 25ms is spent compressing the resources.
On the Galaxy S4, we can see that work collecting the performance data (primarily, ResourceTiming data) has increased to about 310ms due to the slower processing power:
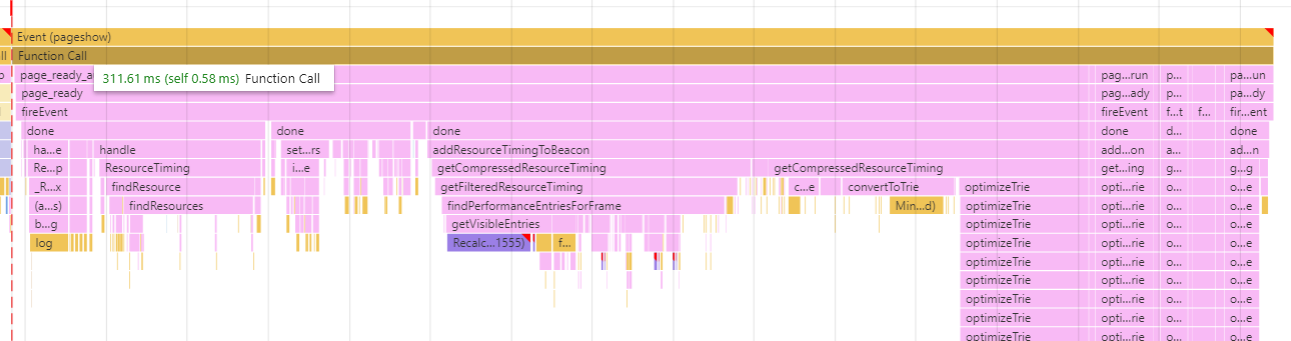
We will investigate ways of reducing this work on mobile devices.
Possible Improvements
While the work done for the beacon is outside of the critical path of the page load, we’ve still identified a few areas of improvement:
3.9 The Beacon
After all of the plugins add their data to the beacon, Boomerang will prepare a beacon and send it to the specified cloud server.
Boomerang will send a beacon in one of 3 ways, depending on the beacon size and browser support:
In general, the size of the beacon varies based on:
- What type of beacon it is (onload, error, unload)
- What version of Boomerang
- What plugins / features are enabled (especially whether
ResourceTiming is enabled)
- What the construction of the page is
- What browser
Here are some sample beacon sizes with 1.532.0, Chrome 63, all plugins enabled:
- Blank page:
- Page Load beacon: 1,876 bytes
- Unload beacon: 1,389 bytes
- Blog:
- Page Load beacon: 3,814-4,230 bytes
- Unload beacon: 1,390 bytes
- Retail:
- Page Load beacon: 8,816-12,812 bytes
- Unload beacon: 1,660 bytes
For the blog and retail site, here’s an approximate breakdown of the beacon’s data by type or plugin:
- Required information (domain, start time, beacon type, etc): 2.7%
- Session information: 0.6%
- Page Dimensions: 0.7%
- Timers: 2%
ResourceTiming: 85%NavigationTiming: 5%Memory: 1.7%- Misc: 2.3%
As you can see, the ResourceTiming plugin dominates the beacon size. This is even after the compression reduces it down to less than 15% of the original size.
Boomerang still has to do a little bit of JavaScript work to create the beacon. Once all of the plugins have registered the data they want to send, Boomerang must then prepare the beacon payload for use in the IMG/XHR/sendBeacon beacon:
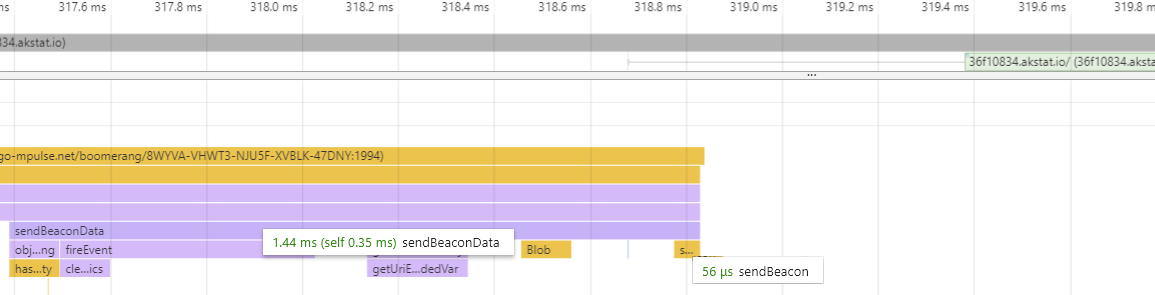
Once the payload has been prepared, Boomerang queues the IMG, XMLHttpRequest or navigator.sendBeacon call.
Browsers are pros at loading images, sending XHRs and beacons: sending the beacon data should barely register on CPU profiles (56 microseconds in the above example). All of the methods of sending the beacon are asynchronous and will not affect the browser’s main thread or user experience.
The beacon itself is delivered quickly to the Akamai mPulse CDN. We immediately return a 0-byte image/gif in a 204 No Content response before processing any beacon data, so the browser immediately gets the response and moves on.
3.10 Work Beyond onload
Besides capturing performance data about the page load process, some plugins may also be active beyond onload. For example:
- The
Errors plugin optionally monitors for JavaScript errors after page load and will send beacons for batches of errors when found
- The
Continuity plugin optionally monitors for user interactions after page load an will send beacons to report on these experiences
Each of these plugins will have its own performance characteristics. We will profile them in a future article.
3.11 Work at Unload
In order to aid in monitoring Session Duration (how long someone was looking at a page), Boomerang will also attempt to send an unload beacon when the page is being navigated away from (or the browser is closed).
Boomerang listens to the beforeunload, pagehide and unload events, and will send a minimal beacon (with the rt.quit= parameter to designate it’s an unload beacon).
Note that not all of these events fire reliably on mobile browsers, and we see only about 30% of page loads send a successful unload beacon.
Here’s a Chrome Developer Tools profile of one unload beacon:
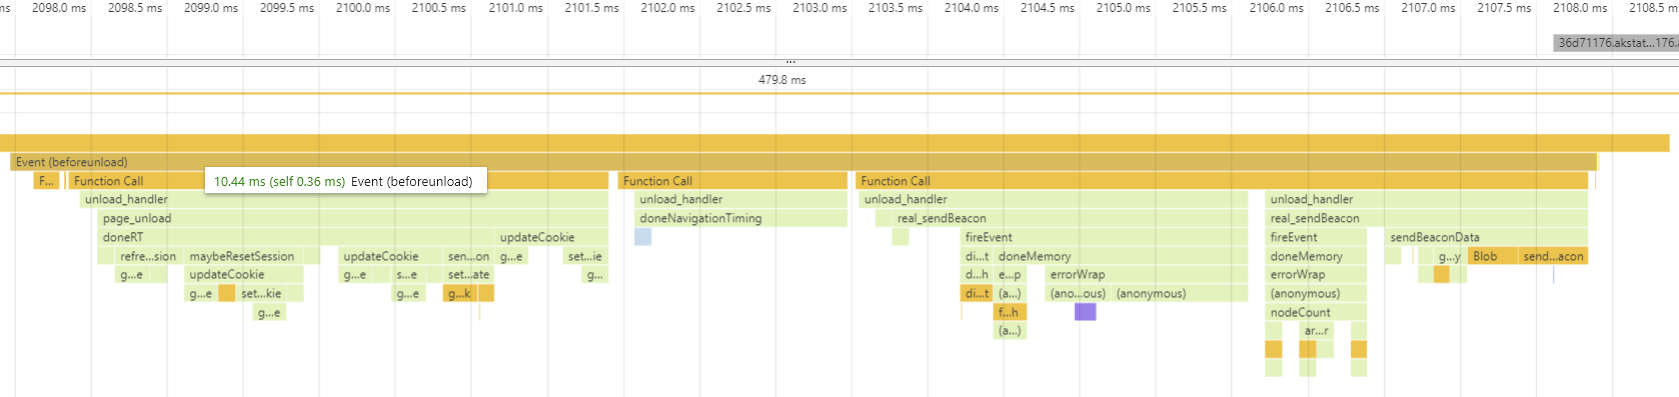
In this example, we’re spending about 10ms at beforeunload before sending the beacon.
Possible Improvements
In profiling a few examples of unload beacon, we’ve found some areas of improvement:
4. TL;DR Summary
So at the end of the day, what does Boomerang “cost”?
- During the page load critical path (loader snippet, boomerang.js parse, creation and initialization), Boomerang will require approximately 10-40ms CPU time for modern devices and 60ms for lower-end devices
- Outside of the critical path, Boomerang may require 10-40ms CPU to gather and beacon performance data for modern devices and upwards of 300ms for lower-end devices
- Loading boomerang.js and its plugins will generally take less than 200ms to download (in a non-blocking way) and transfer around 50kB
- The mPulse beacon will vary by site, but may be between 2-20 kB or more, depending on the enabled features
We’ve identified several areas for improvement. They’re being tracked in the Boomerang Github Issues page.
If you’re concerned about the overhead of Boomerang, you have some options:
- If you can’t have Boomerang executing on the critical path to
onload, you can delay the loader snippet to execute after the onload event.
- Disable or remove plugins
- For mPulse customers, you should disable any features that you’re not using
- For open-source users of Boomerang, you can remove plugins you’re not using by modifying the
plugins.json prior to build.
5. Why did we write this article?
We wanted to gain a deeper understanding of how much impact Boomerang has on the host page, and to identify any areas we can improve on. Reviewing all aspects of Boomerang’s lifecycle helps put the overhead into perspective, so we can identify areas to focus on.
We’d love to see this kind of analysis from other third-party scripts. Details like these can help websites understand the cost/benefit analysis of adding a third-party script to their site.
Thanks
I’d like to thanks to everyone who has worked on Boomerang and who has helped with gathering data for this article: Philip Tellis, Charles Vazac, Nigel Heron, Andreas Marschke, Paul Calvano, Yoav Weiss, Simon Hearne, Ron Pierce and all of the open-source contributors.