Table of Contents
Introduction
Cumulative Layout Shift (CLS) is a user experience metric that measures how unstable content is for your visitors. Layout shifts occur when page content moves after being presented to the user. These unexpected shifts can lead to a frustrating visual and user experience, such as misplaced clicks or rendered content being scrolled out of view.
Trying to read or interact with a page that has a high CLS can be a frustrating experience! A common example of layout shifts occurs when reading an article on a mobile device, and you see your content jumping up or down as ads are dynamically inserted when you scroll:
Cumulative Layout Shift is a measure of how much content shifts on a page, and is one of Google’s Core Web Vitals metrics, so there has been a lot of attention on it lately. It will soon be used as a signal in Google’s Search Engine Optimization (SEO) rankings, meaning lower CLS scores may give higher search rankings.
As of September 2020, Cumulative Layout Shift is part of a draft specification of the Web Platform Incubator Community Group (WICG), and not yet a part of the W3C Standards track. It is only supported in Blink-based browsers (Chrome, Opera, Edge) at the moment.
This article will review what Cumulative Layout Shift is, how it can be measured in lab (synthetic) and real-world (RUM) environments, and why it matters. A companion post dives into what CLS looks like in the real world by looking at mPulse RUM data.
This article is written from the point of view of an author of Boomerang and an employee working on Akamai’s mPulse RUM product, which measures CLS via the Boomerang JavaScript RUM library.
What is Cumulative Layout Shift?
Cumulative Layout Shift is a score that starts at 0.0 (for no unexpected shifts) and grows incrementally for each unexpected layout shift that happens on the page.
The score is unitless and unbound — theoretically, you could see CLS scores over 1.0 or 10.0 or 100.0 on highly shifting pages. In the real world, 99.5% of CLS scores are under 2.0.
As part of their Core Web Vitals, Google recommends a CLS score under 0.10 for a Good experience, and under 0.25 for Needs Improvement. Anything above 0.25 falls under the Poor category. They explain how they came up with these thresholds in a blog post with more details.

Note that Google’s recommended CLS value of 0.10 is for the 75th percentile of your users on both mobile and desktop.
For this blog post, we will generally use Google’s recommended thresholds above when talking about Good, Needs Improvement, or Poor categories.
Importantly, just like any performance metric, Cumulative Layout Shift is a distribution of values across your entire site. While individual synthetic tests (like WebPagetest or Lighthouse) may only measure a single (or few) test runs, when looking at your CLS scores from the wild in RUM data, you may have thousands or millions of individual data points. CLS will be different for different page types, visitors, devices, and screens.
Let’s say, through some sort of aggregate data (like mPulse RUM or CrUX), you know that your site has a Cumulative Layout Shift score of 0.31 at the 75th percentile.
Here’s what that distribution could look like:

The frequency distribution above shows real data (via mPulse) for a retail website over a single day, comprising of 7+ million user experiences. Note that while the 75th percentile is 0.31 (Poor), the median (50th percentile) is 0.16 (Needs Improvement).
The distribution is not normal, and shows that there are a few “groups” of common CLS scores, i.e. around 0.00, 0.10, 0.17 and 1.00. It’s possible those humps represent different subsets of the data, such as different device types or page groups.
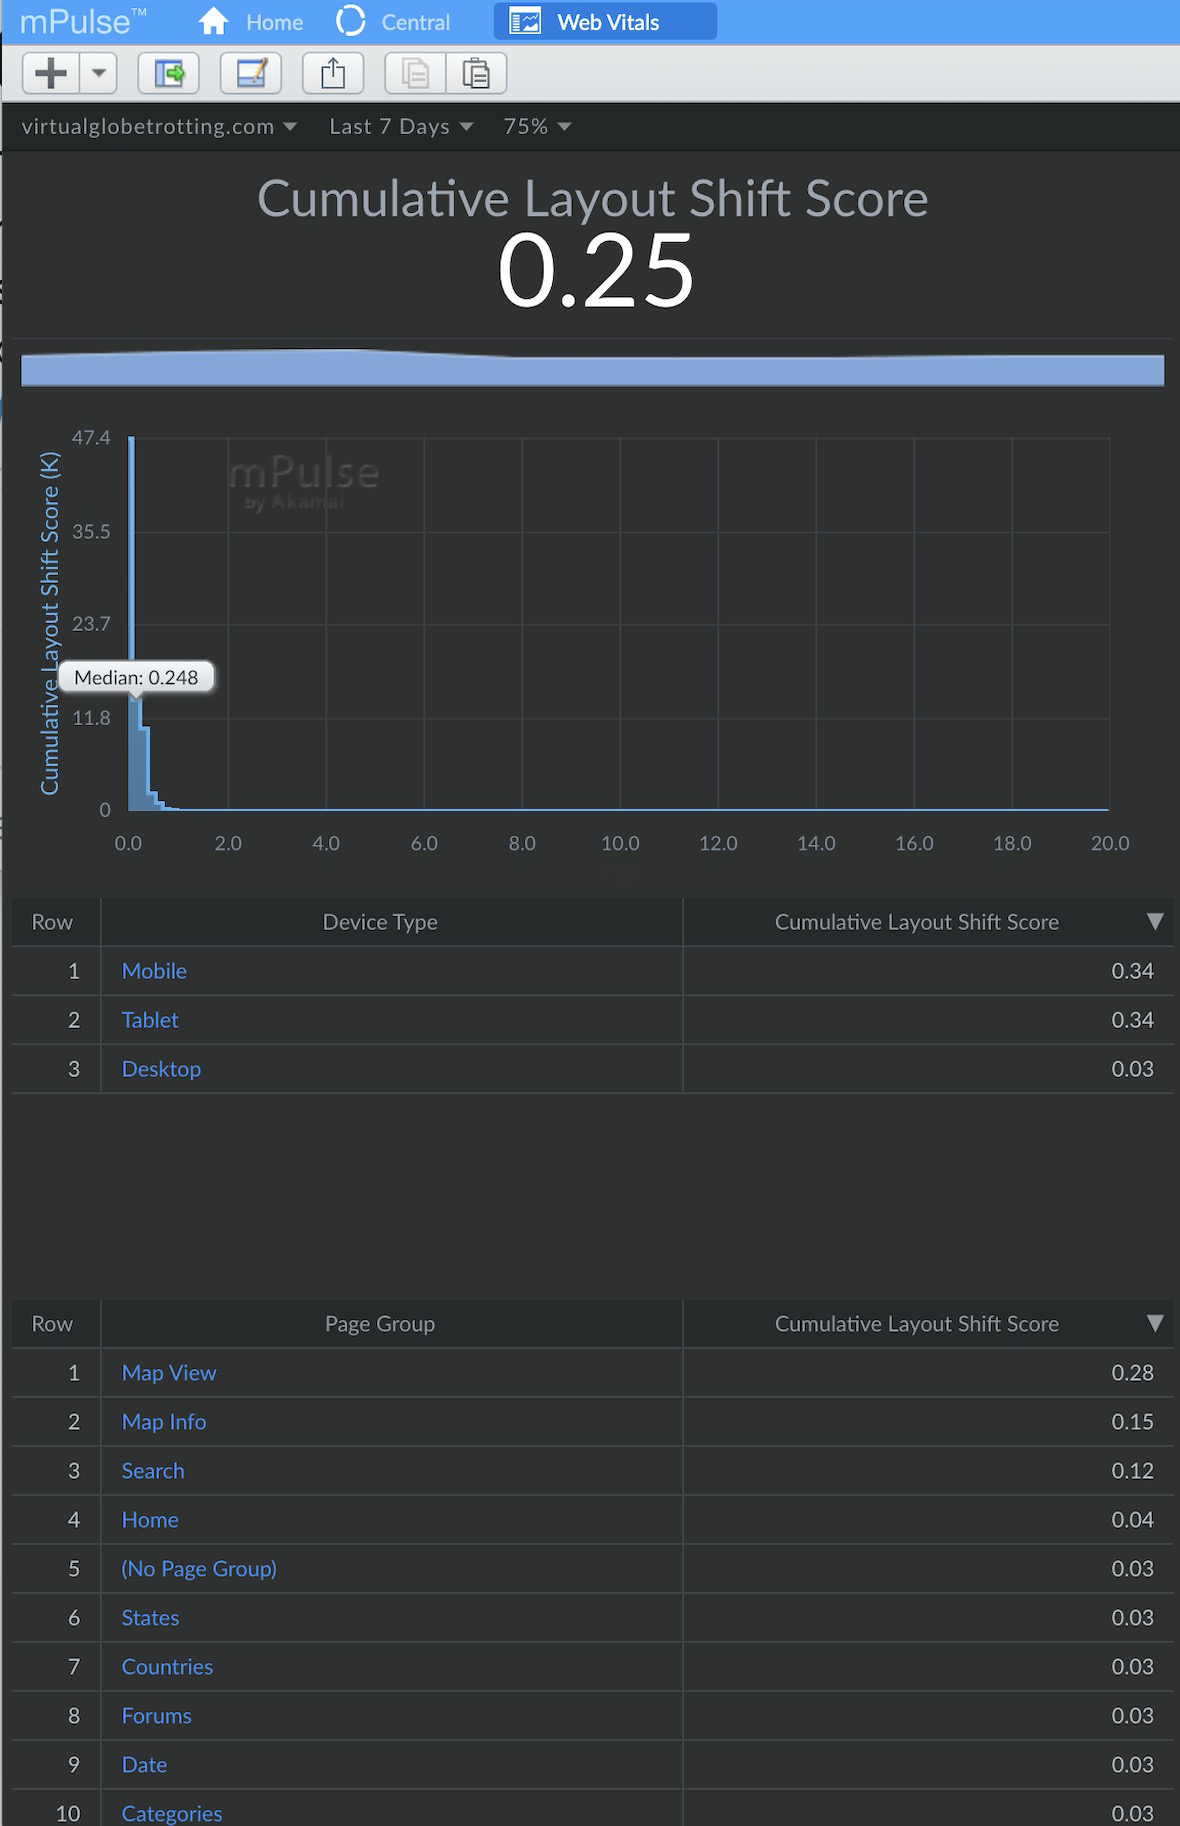
For example, let’s breakdown the data into Desktop vs. Mobile:


As you can see, your experience varies by the type of device that you’re on.
Desktop users have a lot of CLS scores between 0.0 and 0.4, with a small bump around 1.0.
Mobile users have some experiences around 0.0, a spike at 0.06-0.10, then a fairly even distribution all the way to 1.0.
Of course, different parts of a website may be constructed differently, with varying content. Reviewing CLS scores for two unique page groups shows a Good experience for the first type of page, and a lot of Poor experiences for the second type of page:


All of this is to say, when looking at CLS for a website, make sure you understand all of the experiences going into the reported value, and that you have enough data to be able to target and reduce the largest factors of that score.
Why is it important?
Why does Cumulative Layout Shift matter?
CLS is one measurement of the user experience. There are many ways your website can frustrate or delight your users, and CLS is a measurement that may highlight some of those negative experiences.
A bad (high) CLS score may indicate that users are seeing content shift and flow around as they’re trying to interact with your site, which can be frustrating. Users who get frustrated may leave your site, and never come back!
Some of those frustrating experiences may be:
- Reading an article and having the content jump down below the viewport, causing the visitor to lose their place (see demo at the start of this article)
- Mis-clicking or clicking the wrong button:
See the data below in the real-world data section for how Cumulative Layout Shift correlates with other performance and business metrics, such as Bounce Rate, Session Length, Rage Clicks and more.
In some ways, Cumulative Layout Shift is more of a user experience / web design metric than a web performance metric. It measures what the user sees, not how long something takes.
It’s good for the websites to move away from just measuring network- and DOM-based metrics and towards measuring more of the overall user experience. We need to understand what delights and frustrates our users.
Finally, Google is putting their weight behind the metric and will be using it as a signal in Google’s Search Engine Optimization (SEO) rankings. Search ranking have a direct impact on visitors, and a lot of attention has been going into CLS as a result.
Definition
The Cumulative Layout Shift score is a sum of the impact of each unexpected layout shift that happens to a user over a period of time.
Only shifts of visible content from within in the viewport matter. Content that moves below the fold (or currently scrolled viewport) does not degrade the user experience.
As a visitor loads and interacts with a site, they may encounter these layout shifts. The sum of the “scores” of each individual layout shift results in the Cumulative Layout Shift score.
To calculate the score from an individual layout shift, we need to look at two components of that shift: its impact fraction and distance fraction.
The impact fraction measures how much of the viewport changed from one frame (moment) to the next.
In the above screenshot, the green frame shows the portion of the viewport changing from the previous frame.
The distance fraction measures the greatest distance moved by any of those unstable elements, as a portion of the viewport’s size.
In the above screenshot, the blue arrow shows the distance fraction (from the new Ads/Widgets coming in).
Multiplied together, you get a single layout shift score:
layout shift score = impact fraction * distance fraction
Each layout shift is then accumulated into the Cumulative Layout Shift score over time.
Both HTML Elements (such as images, videos, etc.) as well as text nodes may be affected by layout shifts. Under discussion is whether some types of hidden elements (such as visibility:hidden) would be considered.
For further details, the web.dev article on CLS has a great explanation on how CLS is calculated as well.
When does it End?
The point at which individual layout shifts stop being added to the Cumulative Layout Shift score may differ depending on what you or your tool is measuring.
Tools may measure up to one of the following events:
- When the browser’s
onload event fires
- For Single Page Apps (SPAs), when all SPA content is loaded
- For the life of the page (even after the user interacts with the page)

If your main concern is just the Page Load experience, you can accumulate layout shifts into the Cumulative Layout Shift score until the browser’s onload event fires (or a similar event for Single Page Apps).
These onload (and SPA “load”) events are measuring until a pre-defined and consistent phase of the page load. Once that phase has been reached (e.g. most/all content is loaded), the Cumulative Layout Shift score accumulated from the start of the navigation through that event is finalized.
This type of “load-limited” Cumulative Layout Shift is often what pure synthetic tools such as Lighthouse or WebPagetest measure, in the absence of any user interactions on the page. RUM tools, such as Boomerang.js also generally send their beacon right after the load events, so will stop their CLS measurements there.
Alternatively, CLS can be measured beyond just the “load” event, continually accumulating as the user interacts on the page. Layout shifts that happen after the result of scrolling (e.g. dynamic ad loads) can be especially frustrating users. It’s worthwhile measuring the page’s entire lifetime CLS if you can. You would generally accumulate layout shifts until something like the visibilitychange event (when the page goes hidden or unloads).
As a result, these “page lifetime” CLS scores will likely be higher than “load-limited” CLS scores. See the RUM vs. Synthetic section for more details on why different tools may report a different CLS.
If your page is a Single Page App (SPA), it’s probably best to “restart” the Cumulative Layout Shift score each time an in-page (“Soft”) SPA navigation starts. This way the score will reflect each view change and will not just keep growing indefinitely as users interacts with the page over time. More details in the SPA section.
Single Page Apps (SPAs)
Measuring the user experience in a Single Page App (SPA) is a unique challenge. SPAs rewrite and may completely change the DOM and visuals as the user navigates throughout a website.
For example, when Boomerang is on a SPA website with SPA monitoring enabled, it takes additional steps to measure the page’s performance and user experience:
- Instead of waiting for just the
onload event to gather performance data, it waits for the dynamic visual content to be fetched. This is called a “SPA Hard Navigation“.
- Boomerang monitors for state and view changes from the SPA framework as the user clicks around, and tracks the resources fetched as part of a “SPA Soft Navigation”
Both types of SPA navigations can shift content around on the page, potentially causing unexpected layout shifts. The definition of Cumulative Layout Shift actually excludes content changes right after direct user input such as clicks (since those types of changes to the view are intentional and expected by the user), but additional dynamic content (ads, widgets) after the initial shifts may be unexpected and frustrating.
Since the onload event in SPAs doesn’t matter as much, it’s worthwhile to keep accumulating the Cumulative Layout Score beyond just onload. For example, Boomerang in SPA mode measures CLS up to the end of the SPA Hard Navigation (when all dynamic content has loaded), when it sends its beacon.
After the SPA Hard Navigation, it’s also useful to know about the user experience during subsequent Soft Navigations. Resetting the CLS value for each Soft Navigation lets you understand how each individual view change affects the user experience.

Not all measurement tools will be able to split out CLS by Soft Navigation. For example, the Chrome User Experience (CrUX) data measures all layout shifts until the page goes hidden (or unloads), which means the Hard navigation and all Soft navigations are combined and Cumulative Layout Shift is just the sum of all of those experiences.
IFRAMEs
The Layout Instability spec mentions that:
The cumulative layout shift (CLS) score is the sum of every layout shift value that is reported inside a top-level browsing context, plus a fraction (the subframe weighting factor) of each layout shift value that is reported inside any descendant browsing context.
and
The subframe weighting factor for a layout shift value in a child browsing context is the fraction of the top-level viewport that is occupied by the viewport of the child browsing context.
In other words, shifts in IFRAMEs should affect the top-level document’s CLS score.
This seems logical, right? IFRAMEs that are in the viewport also have the chance to shift visible content. End-users don’t necessarily know which content is in a frame versus the top-level page, so IFRAME layout shifts should be able to affect the top-level document’s Cumulative Layout Shift Score.
In the above image, let’s pretend the content in the blue box is in an <iframe> taking approximately 50% of the viewport. If an Annoying Ad pops it, it may cause a Layout Shift with a value of 0.10 within the IFRAME itself. That layout shift could theoretically affect its’ parent’s Cumulative Layout Shift as well. Since the IFRAME is 50% of the viewport of its parent, the parent’s Cumulative Layout Shift core would increase by 0.05.
Here’s the complication:
- While the Layout Instability spec proposes this behavior, as of October 2020, IFRAME layout shifts do not affect the Cumulative Layout Shift scores in most current synthetic and RUM tools
- Chrome Lighthouse (in browser Developer Tools, as well as powering PageSpeed Insights and WebPagetest’s CLS scores) does not currently track Layout Shifts in frames.
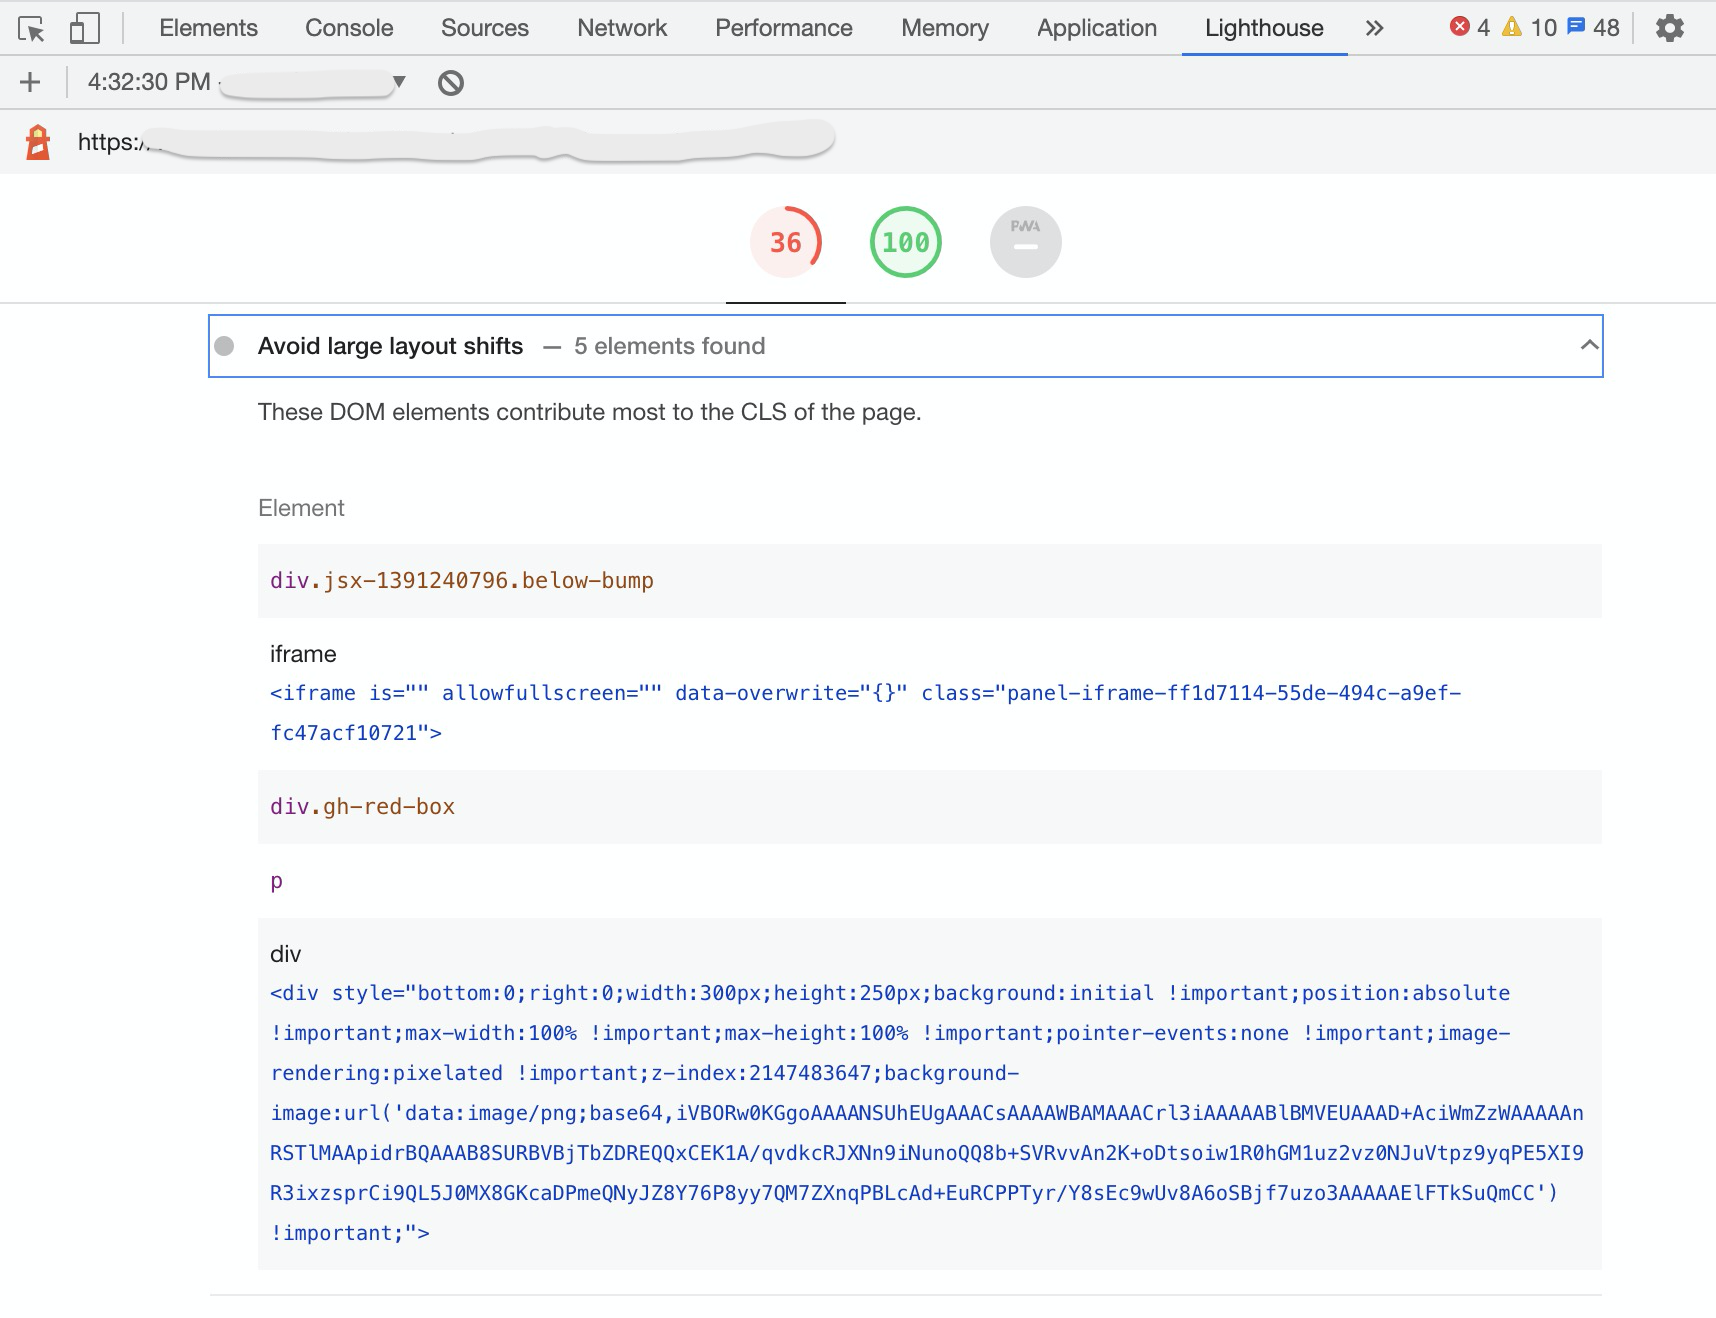
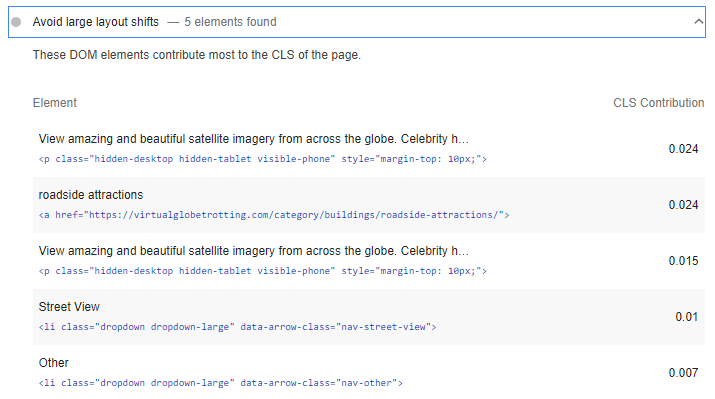
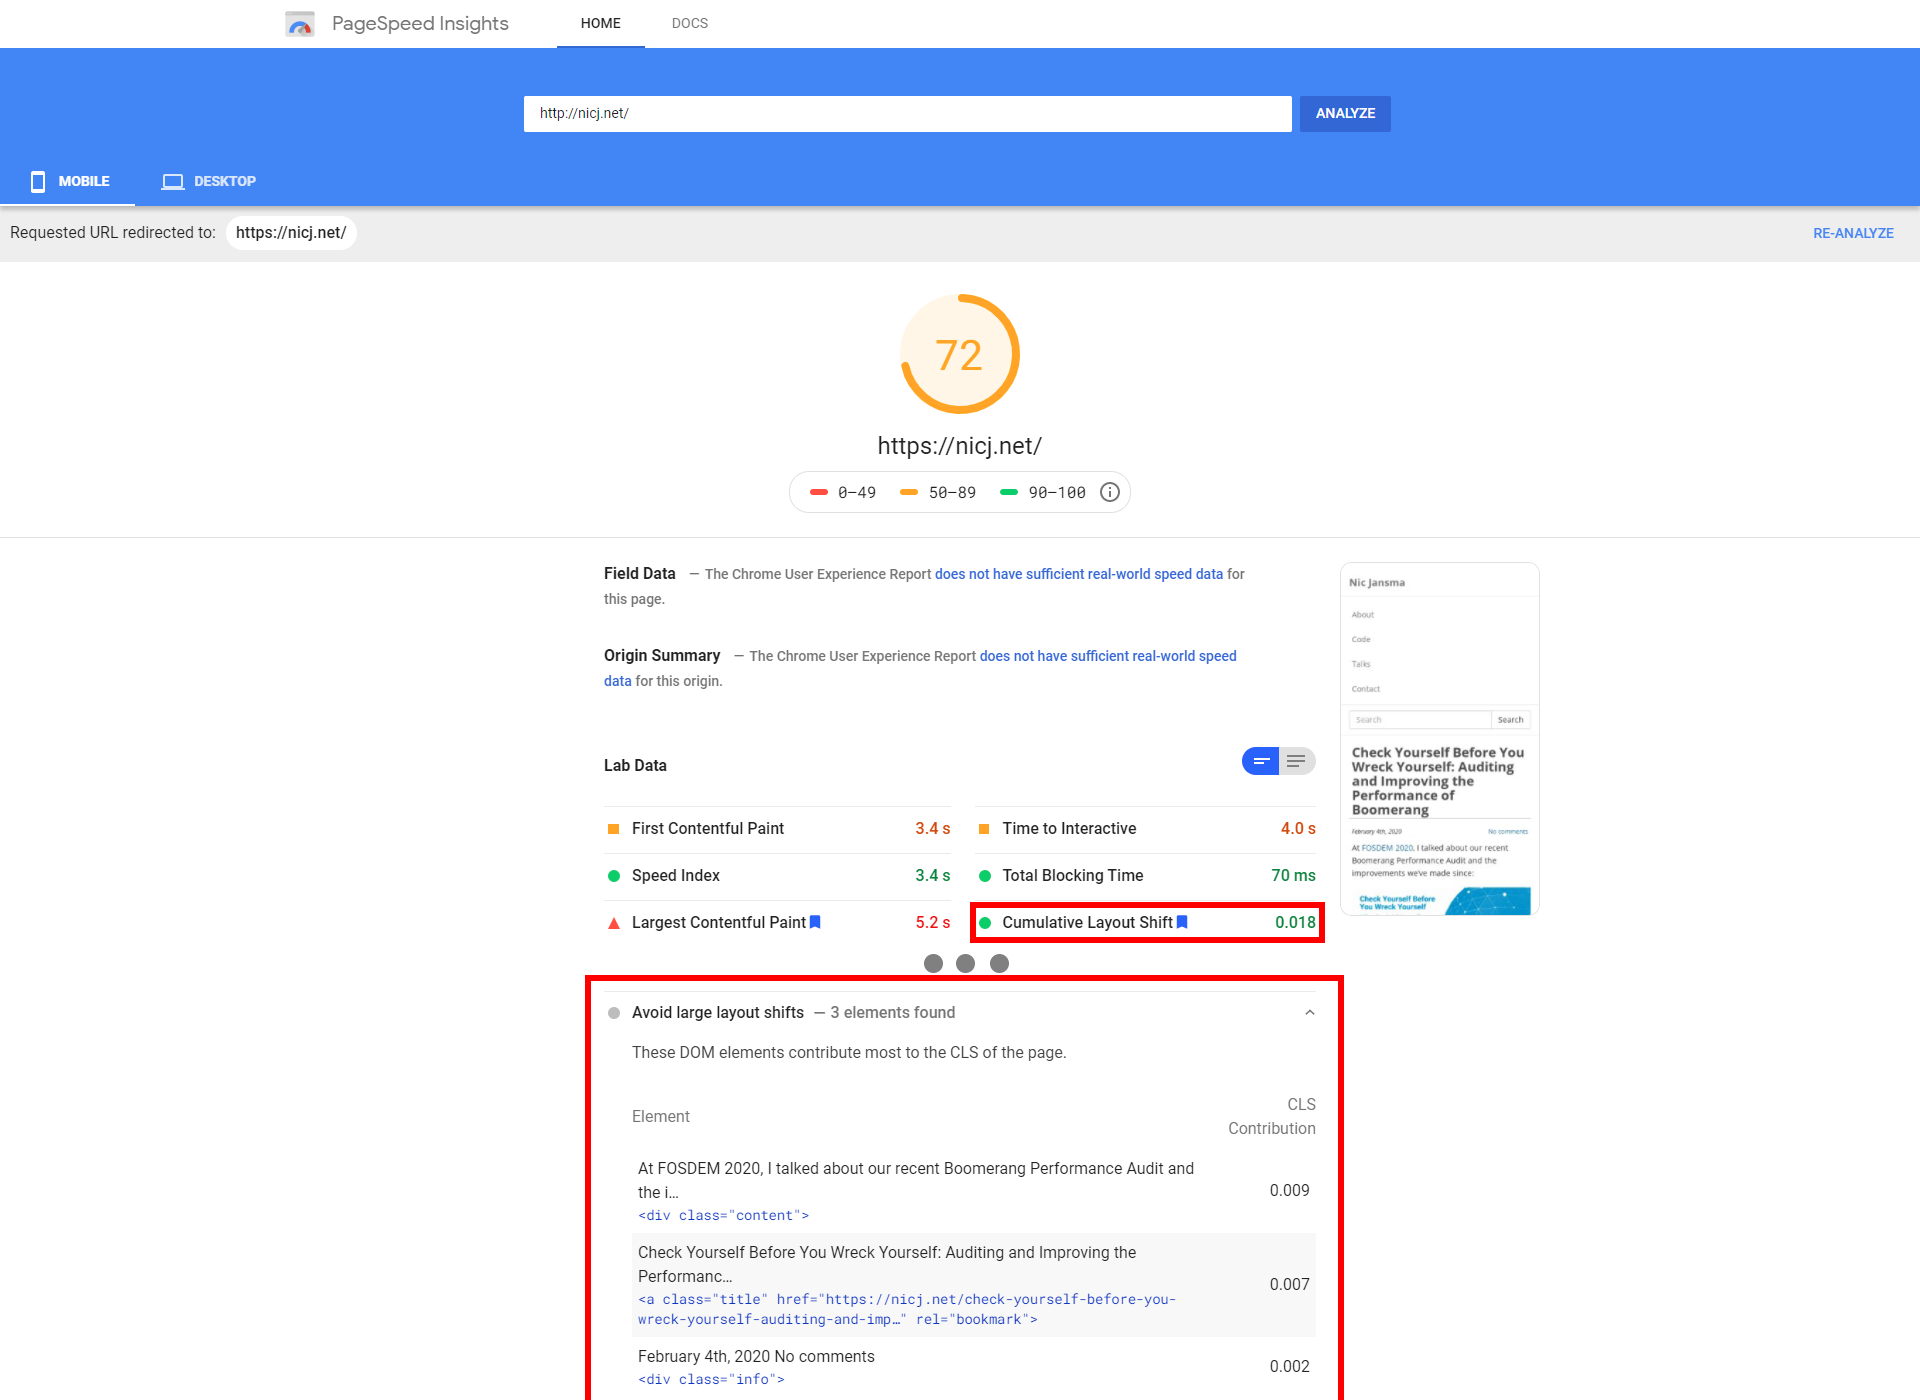
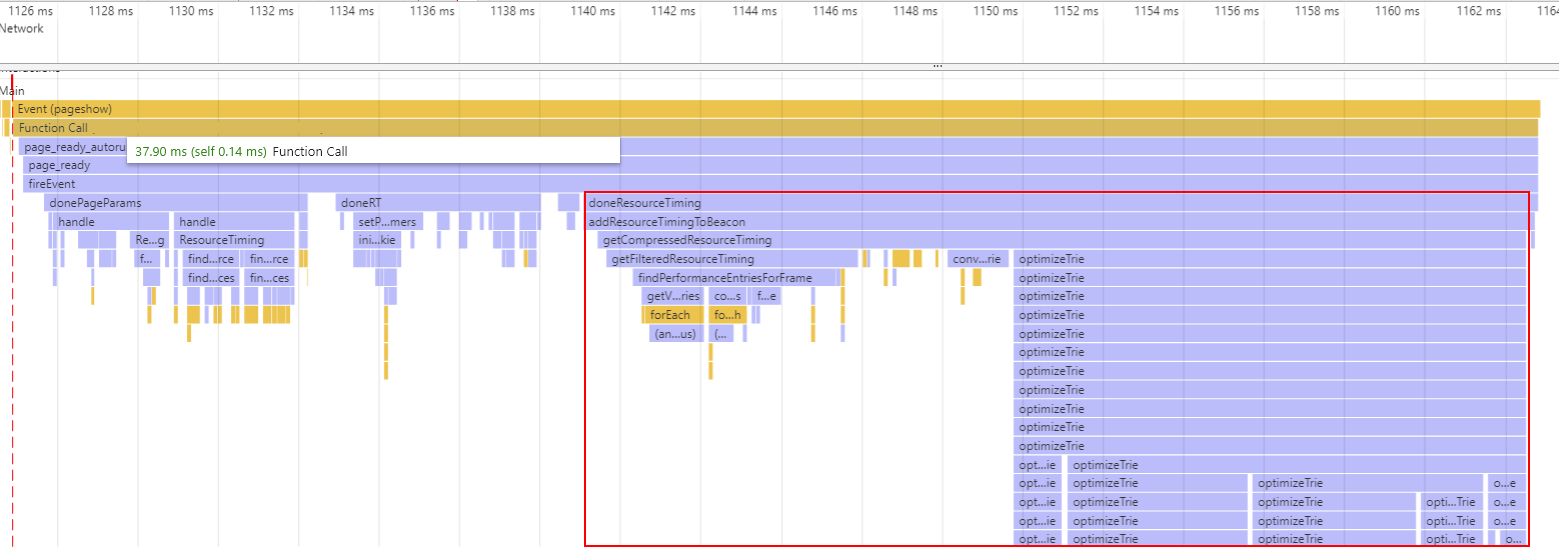
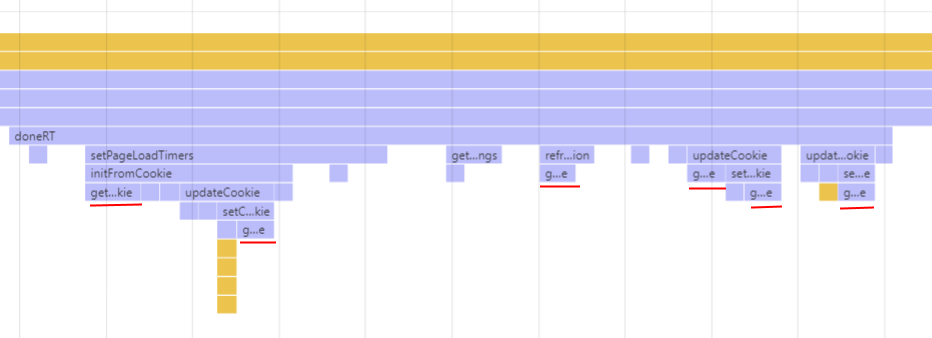
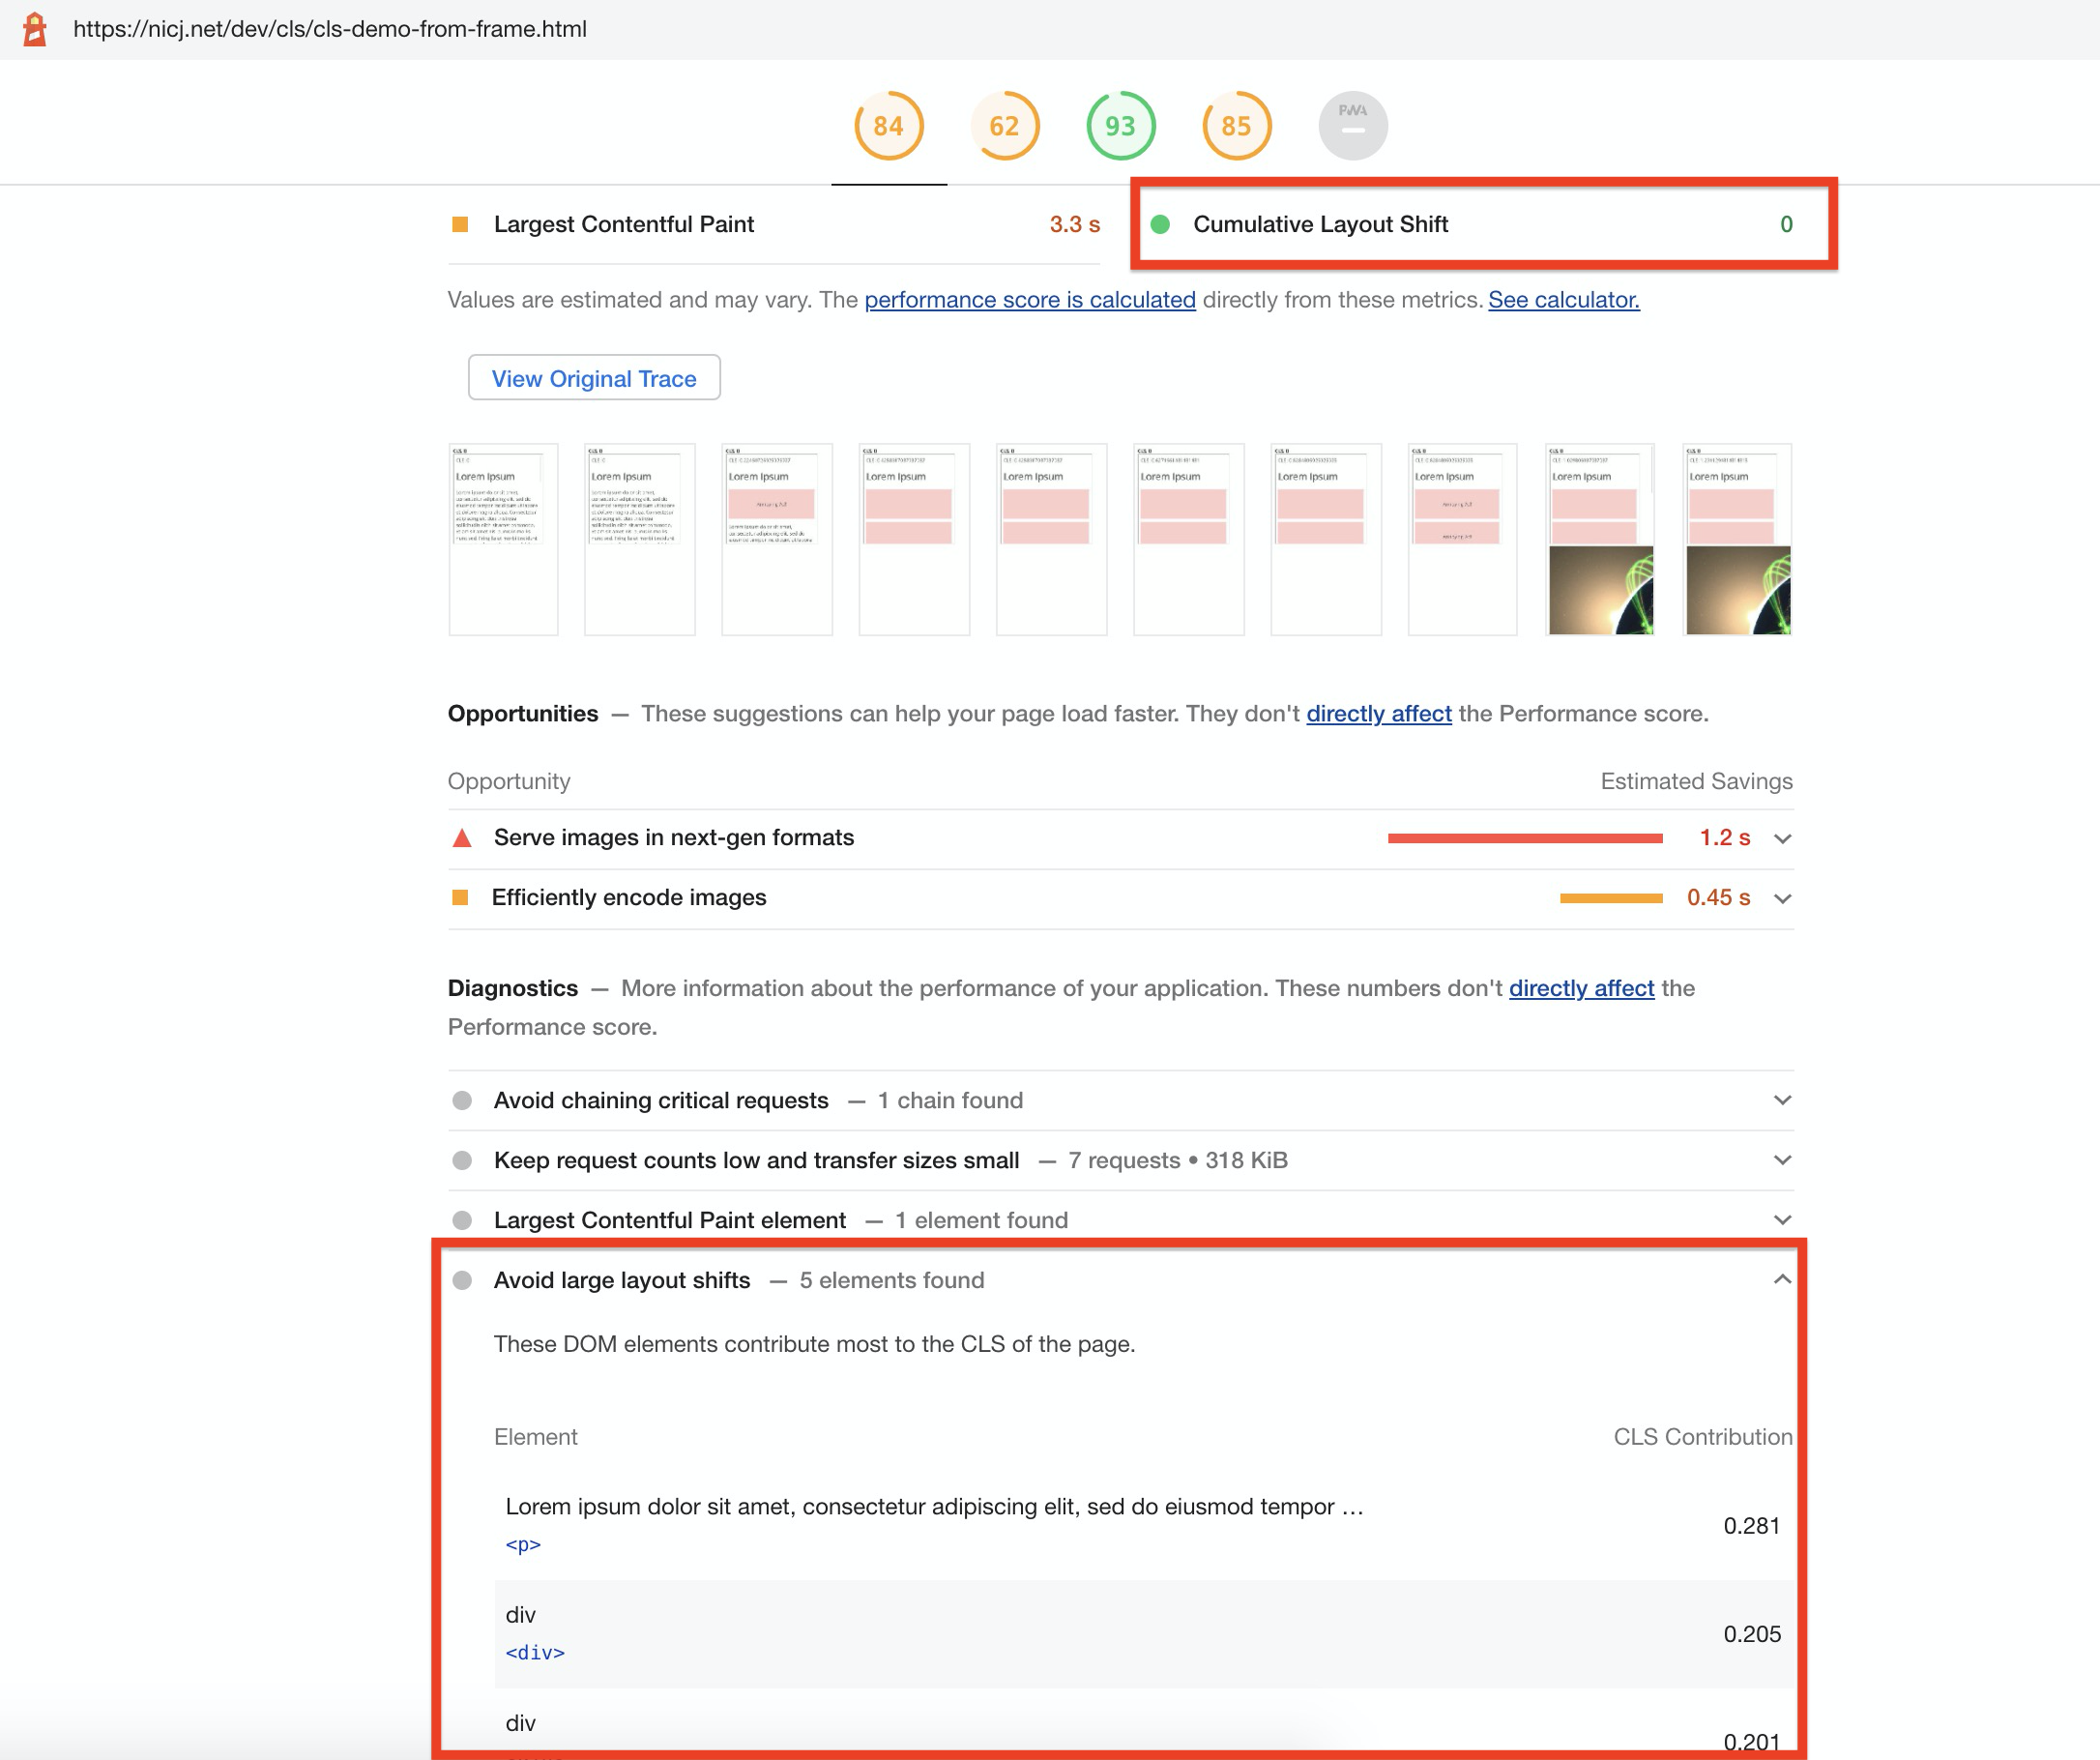
- While Lighthouse reports a CLS of
0.0 for shifts from IFRAMEs, it will still suggest Avoid large layout shifts for any shifts in those frames (bug tracking this), which can be confusing:
- All current RUM tools only track Layout Shifts in the top-level page, not accounting for any shifts from IFRAMEs
- If they wanted to do this, they would need to crawl for all IFRAMEs and register
PerformanceObservers for those
- It’s hard to do this for dynamically added or removed IFRAMEs
- This cannot be done for any cross-origin IFRAMEs due to frame restrictions
- Here’s an issue discussing this discrepancy
- On the other hand, Google’s Chrome User Experience (CrUX) report does factor in IFRAME layout shifts for CLS
As a result, if you have content shifting in IFRAMEs today, those might (or might-not) not be affecting your top-level Cumulative Layout Shift scores, depending on what data you’re looking at.
In the future, if Lighthouse and other synthetic tools are updated to include layout shifts from IFRAMEs, it is likely they will always differ from RUM CLS which cannot easily (or at all) get layout shifts from IFRAMEs.
We should strive to keep RUM CLS as close as possible to synthetic CLS, so I’ve filed an issue to try to get the same IFRAME details in RUM easily.
How to Improve It
This article won’t dive too deeply into how to improve a site’s CLS score, as there is already a lot of great content from other sources, such as Google’s Optimize Cumulative Layout Shift article on web.dev.
However, it’s important to take time to understand and investigate why your CLS score is the way it is before you try to fix or improve anything.
The first step of improving any performance metric is making sure you understand precisely how that metric is being measured. Whether you’re looking at synthetic or RUM data, make sure you understand how it’s being calculated and how much data the CLS value represents.
For example, make sure you know how much of the page’s lifetime layout shifts are being measured for, as it varies by tool.
If you’re looking at a CLS score from a synthetic test like Lighthouse or WebPagetest, you can probably get a trace, or breakdown, of the content that contributed to that score. From there, you can look for opportunities to improve.
Remember, synthetic developer tools often just measure a single test case on your developer machine, and may not be representative of what your users are seeing across devices, browsers, screens and locations! Synthetic monitoring tools are useful for getting repeatable measurements from a lab-like environment, but won’t be representative of your real visitors.
If you have RUM data, see if you can break down CLS by Page Group, Mobile/Desktop, and other dimensions to see which segments of your visitors are having the worst experiences.
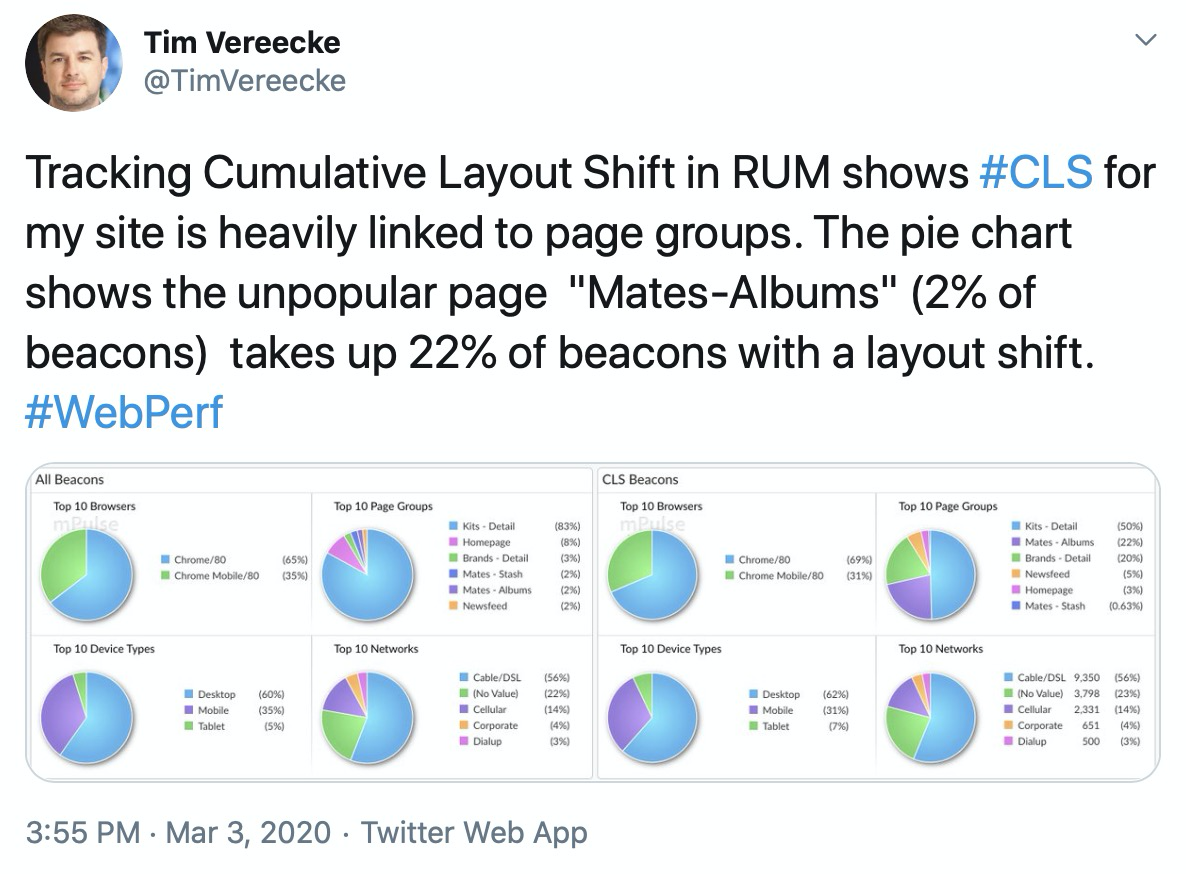
Intuitively, Cumulative Layout Shift scores may differ significantly for each page group (e.g. different types of pages such as Home, Product, or List pages) of a site.
Tim Vereecke confirms this is what he found for his site:
RUM data can also contain attribution that has details about which elements moved for each layout shift.
Once you’ve narrowed down the largest scenarios and population segments that are contributing to your CLS, you can use a local debugger or synthetic testing tools to try to reproduce the layout shifts.
From there, at a high-level, layout shifts occur when content is inserted above or at where the current viewport is.
Many times, this can be caused by:
- Scroll bars needing to be added by additional content (which can reduce the width of the page, which can shift content to the left or down)
- CSS animations
- Use
transform properties instead
- Image sliders
- Make sure you’re using
transforms instead of changing dimension / placement properties
- Ads
- If possible, define dimensions ahead of time
- Images without dimensions
- Content that only gets included or initialized after the user scrolls to it
- Add placeholders with the correct dimensions
- Fonts
- Unstyled fonts being drawn before the final font (which may have slightly different dimensions) can lead to layout shifts
font-display: swap in conjunction with a good matching font fallback can help
More details on the above fixes are on Google’s Optimize Cumulative Layout Shift page.
Taking a video as you load and interact with a page can highlight specific cases where CLS increases, and Chrome Developer Tools has an option to see which regions shifted in real-time.
One note is that a lot of today’s modern performance best practices may potentially have a negative effect on CLS, such as lazy-loading CSS, images, fonts, etc. When those components are loaded asynchronously, it’s possible for them to introduce layout shifts as they need to be drawn with the proper dimensions.
In other cases, websites that are tuning for performance may be exposing themselves to more layout shifts unintentionally. Besides lazy-loading, fast-loading sites optimize for a quick first-paint, to get something on-screen for the visitor’s eyes. As additional content comes in, it may be shifting the page around significantly, even though the user may think it’s possible for them to start interacting with the site.
That’s why it can be important to keep an eye on CLS every time major performance changes are being considered. There are always trade-offs between delivering content quickly and delivering it too quickly, where it will need to be shuffled around before the page has reached its final form.
How to Measure It
CLS can be measured synthetically (in the lab) or for real users (via RUM). Lab measurements may only capture layout shifts from a single or repeated Page Load experience, while RUM measurements will be more reflective of what real users see as they experience and interact with a site.
RUM
Cumulative Layout Shift can be measured via the browser’s Layout Instability API. This experimental API reports individual layout-shift entries to any registered PerformanceObserver on the page.
Each layout-shift entry represents an occurrence where an element in the viewport changes its starting position between two frames. An element simply changing its size or being added to the DOM for the first time won’t necessarily trigger a layout shift, if it doesn’t affect other visible DOM elements in the viewport.
Not all layout shifts are necessarily bad. For instance, if a user is interacting with the page, such as clicking a button in a Single Page App, they may be expecting the viewport to change. Each layout-shift event has a hadRecentInput flag that tells whether there was input within the last 500ms of the shift. If so, that layout shift can probably be excluded from the Cumulative Layout Shift score.
Inputs that trigger hadRecentInput are mousedown, keydown, and pointerdown. Simple mousemove and pointermove events and scrolls are not counted.
How long should layout shifts be added to the Cumulative Layout Shift score? That depends on how much of the user experience you’re trying to measure.
See When does it End? for more details.
Example Code
There are many open-source libraries that capture CLS today, such as Boomerang or the web-vitals library.
See the open-source RUM section for more examples.
If you want to experiment with the raw layout shifts via the Layout Instability API, the first thing is to create a PerformanceObserver:
var clsScore = 0;

try {
  var po = new PerformanceObserver(function(list) {
    var entries = list.getEntries();
    for (var i = 0; i < entries.length; i++) {
      if (!entries[i].hadRecentInput) {
        clsScore += entries[i].value;
      }
    }
  });

  po.observe({type: 'layout-shift', buffered: true});
} catch (e) {
  // not supported
}
buffered:true is used to gather any layout-shifts that occurred before the PerformanceObserver was initialized. This is especially useful for scripts, libraries, or third-party analytics that load asynchronously on the page.
Each callback to the above PerformanceObserver will have a list of entries, via list.getEntries().
Each entry is a LayoutShift object:
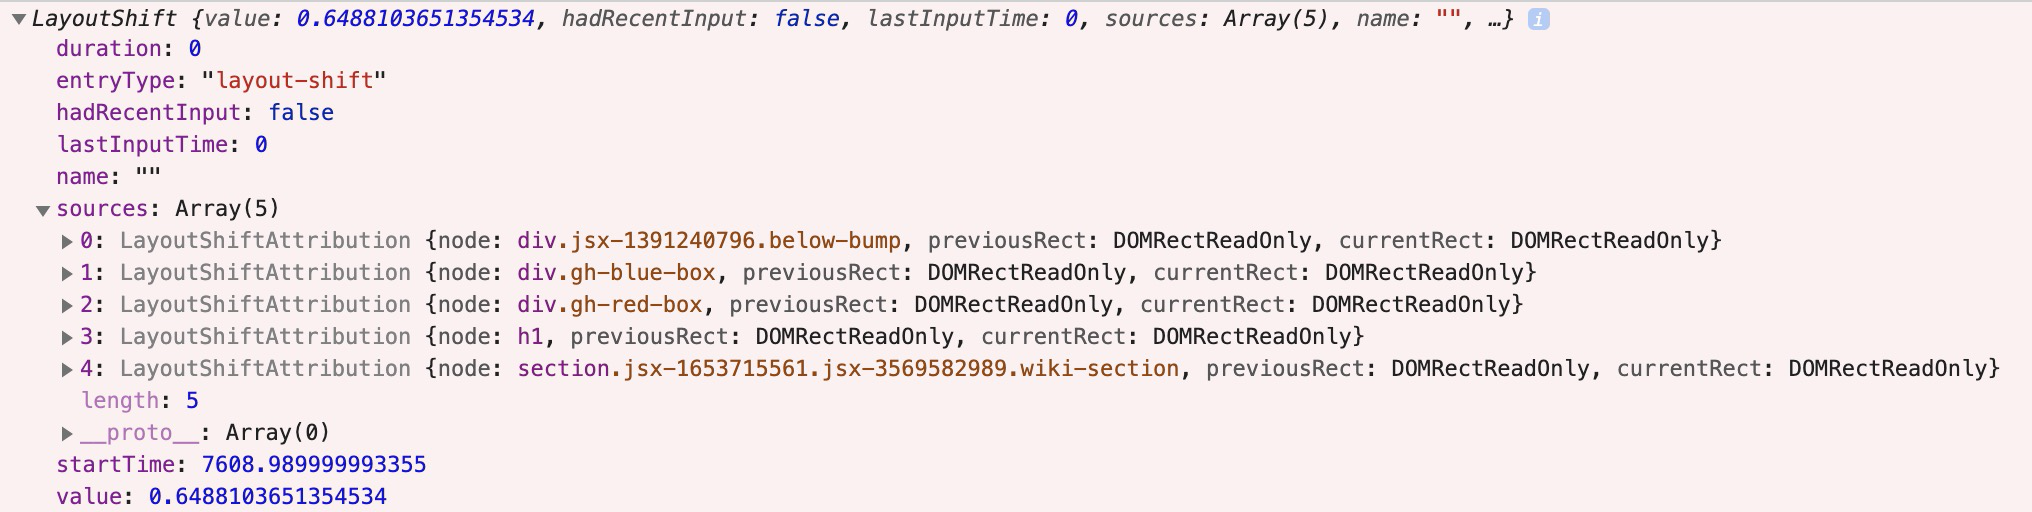
Here are its attributes:
duration will always be 0entryType will always be layout-shifthadRecentInput is whether there was user input in the last 500mslastInputTime is the time of the most recent inputname should be layout-shift (though Chrome appears to currently put the empty string "")sources is a sampling of attribution for what caused the layout shift (see attribution below)startTime is the high resolution timestamp when the shift occurredvalue is the layout shift contribution (see definition above)
If you’re just interested in calculating the Cumulative Layout Score, you can add the value of each layout-shift as long as it doesn’t have hadRecentInput set.
For more details on the shifts, you could capture the sources to see top contributors.
There are a few edge-cases to be aware of, so it’s best to look at one of the example libraries for details.
If you want to browse the web and watch CLS entries as they happen live, you can try this simple script for Tampermonkey, or the Web Vitals Chrome Extension.
Attribution
So, your site has a CLS score of 0.3. Great!? Now what?
You probably want to know why. Besides the raw value that each layout-shift generates, it has a sources attribute that can give an indication of the top elements that shifted.
The sources attribute of the layout-shift entry is sampling of up to five DOM elements whose layout shifts most substantially contributed to the layout shift value:
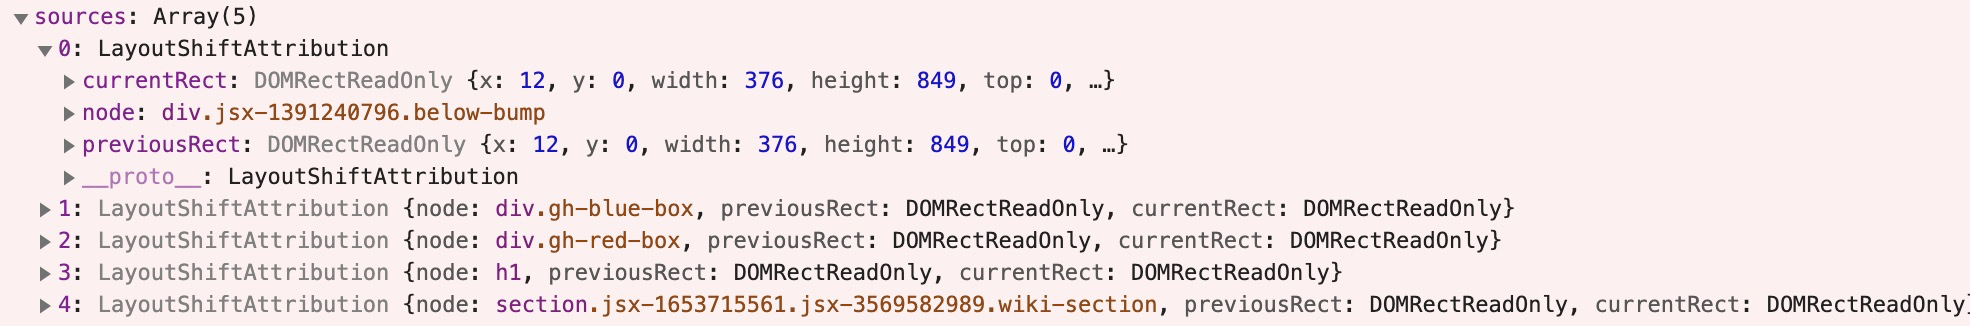
Note sources are the elements that shifted, not necessarily the element(s) that caused the shift. For example, an element that is inserted above the current viewport could cause elements within the viewport to shift (and contribute to the CLS score), though the inserted element itself may not be in the sources list.
Attribution via sources is only available in Chrome 84+.
Fallbacks
Unfortunately, it would be challenging to measure Layout Shifts without the Layout Instability API, which today is only supported in Blink-based browsers.
Theoretically, a polyfill might be able to calculate the placement and dimensions of every element within the viewport every frame and how they change… seems like that would be rather inefficient to do in JavaScript.
Maybe someone will prove me wrong!
For now, it’s best to capture CLS via browsers that support the Layout Instability API and use other spot checks to make sure other browsers have similar layout behavior.
Browser Support
CanIUse.com tracks browser support for the Layout Instability API.
As of 2020-10, only Blink-based browsers support it, which is about 69% of global market share:
- Chrome 77+
- Opera
- Edge 80+ (based on Chromium — no support in EdgeHTML)
Note that Chrome has done a great job documenting any changes they’ve made to the Layout Instability API or CLS measurement.
Based on recent feedback to the Layout Instability GitHub Issues Page it seems that Mozilla engineers are reviewing the specification (but have not yet shown a public commitment to implementing it).
Gotchas
When measuring and reporting on Cumulative Layout Shift, there are a lot of gotchas and caveats to understand:
- Layout Shifts are affected by the viewport and size of the viewport. Only content that is within the viewport is visible. Shifts that happen below the fold will have no effect on Cumulative Layout Shift:

- Layout Shifts may happen more frequently on mobile vs. desktop due to responsive layouts that are more vertical, with a lot of dynamically added content from scrolling. When analyzing CLS data, investigate Desktop and Mobile layouts separately.
- The point at which you “stop” accumulating layout shifts into the Cumulative Layout Shift score matters, and different measurement tools may stop at different points. See the When does it End? section for more details.
- There are bugs (with developer tools) and inconsistencies (between synthetic and RUM) with measuring layout shifts happening in IFRAMEs.
- There are some known canonical cases that might provide high CLS values but still present a good user experience. For example, some types of image carousels (not using
transform) might cause a large shift every time the image changes.
- CLS can’t distinguish elements that don’t paint any content (but have non-zero fixed size), see this discussion.
- Anytime there’s a new performance metric, there will be places it breaks down or doesn’t work well. It’s useful to browse (and possibly subscribe) to the Layout Instability’s Issue Page if you’re interested in this metric.
Open-Source / Free RUM
Cumulative Layout Shift is already supported in many popular open-source JavaScript libraries:
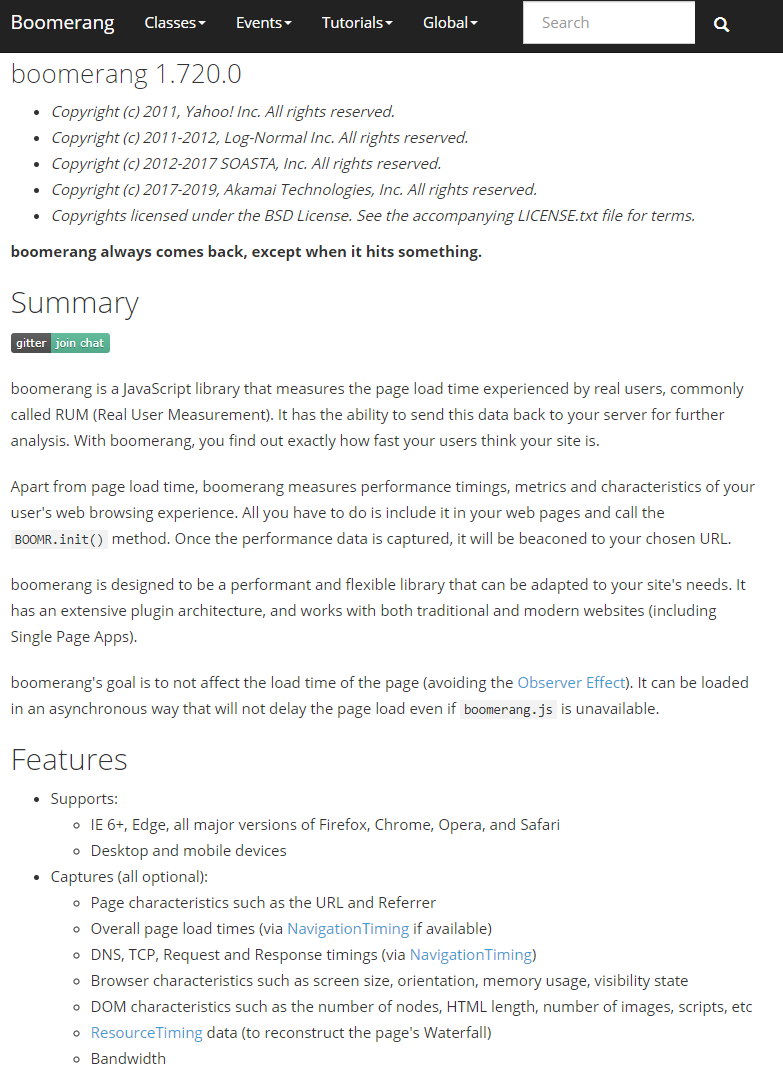
boomerang.js is an open-source performance monitoring JavaScript library. (I am one of its authors).
It has support for Cumulative Layout Shift, which was added as part of the Continuity plugin in version 1.700.0.
CLS is measured up to the point the beacon is sent. For traditional apps, this is right after the onload event. For Single Page Apps (SPAs), CLS is measured up to the SPA Hard beacon is sent, which can include dynamically loaded content. CLS is also measured for each SPA Soft navigation.
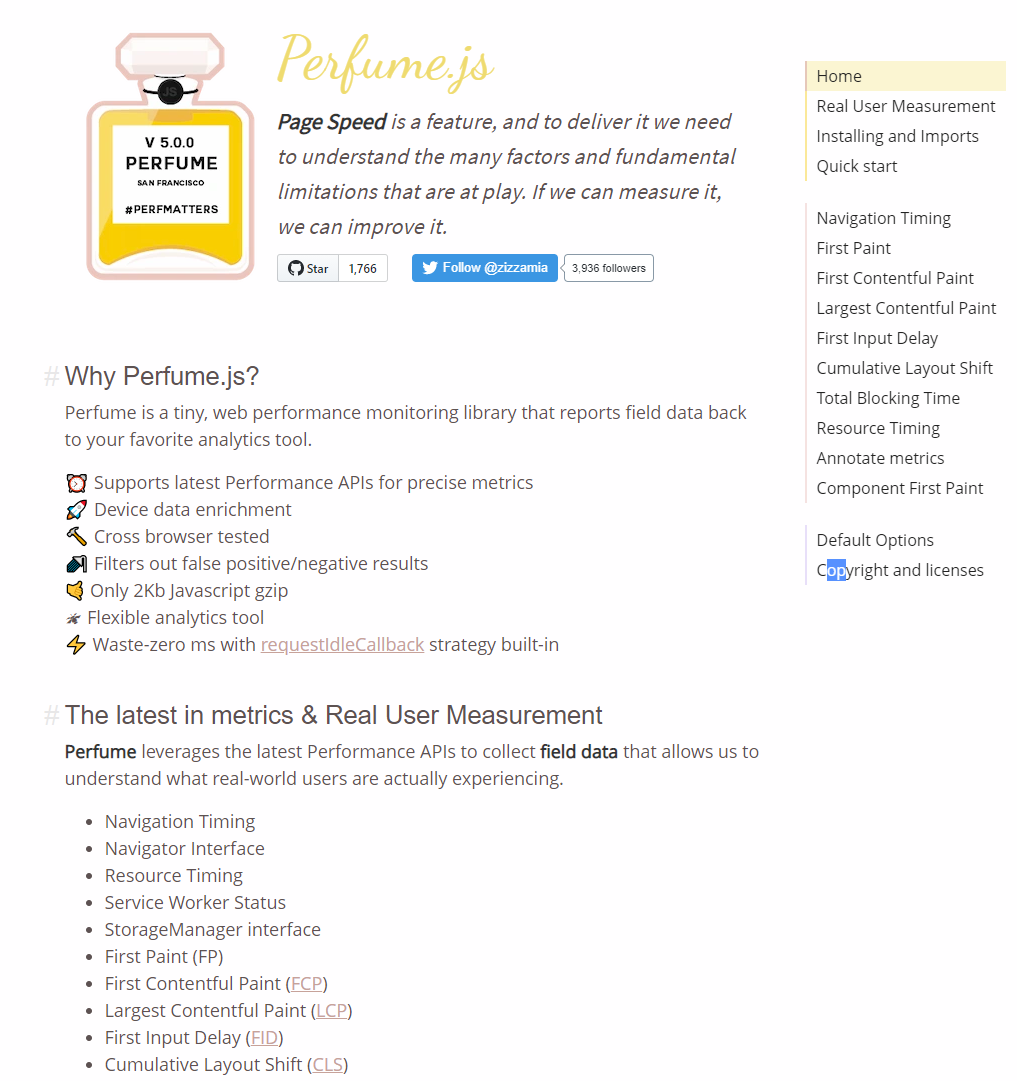
perfume.js is an open-source web performance monitoring JavaScript library that reports field data back to your favorite analytics tool.
Perfume added support for Cumulative Layout Shift in version 4.8.0.
Perfume is measured up to two points: when First Input Delay happens (as cls), and when the page’s lifecycle state changes to hidden (as clsFinal).
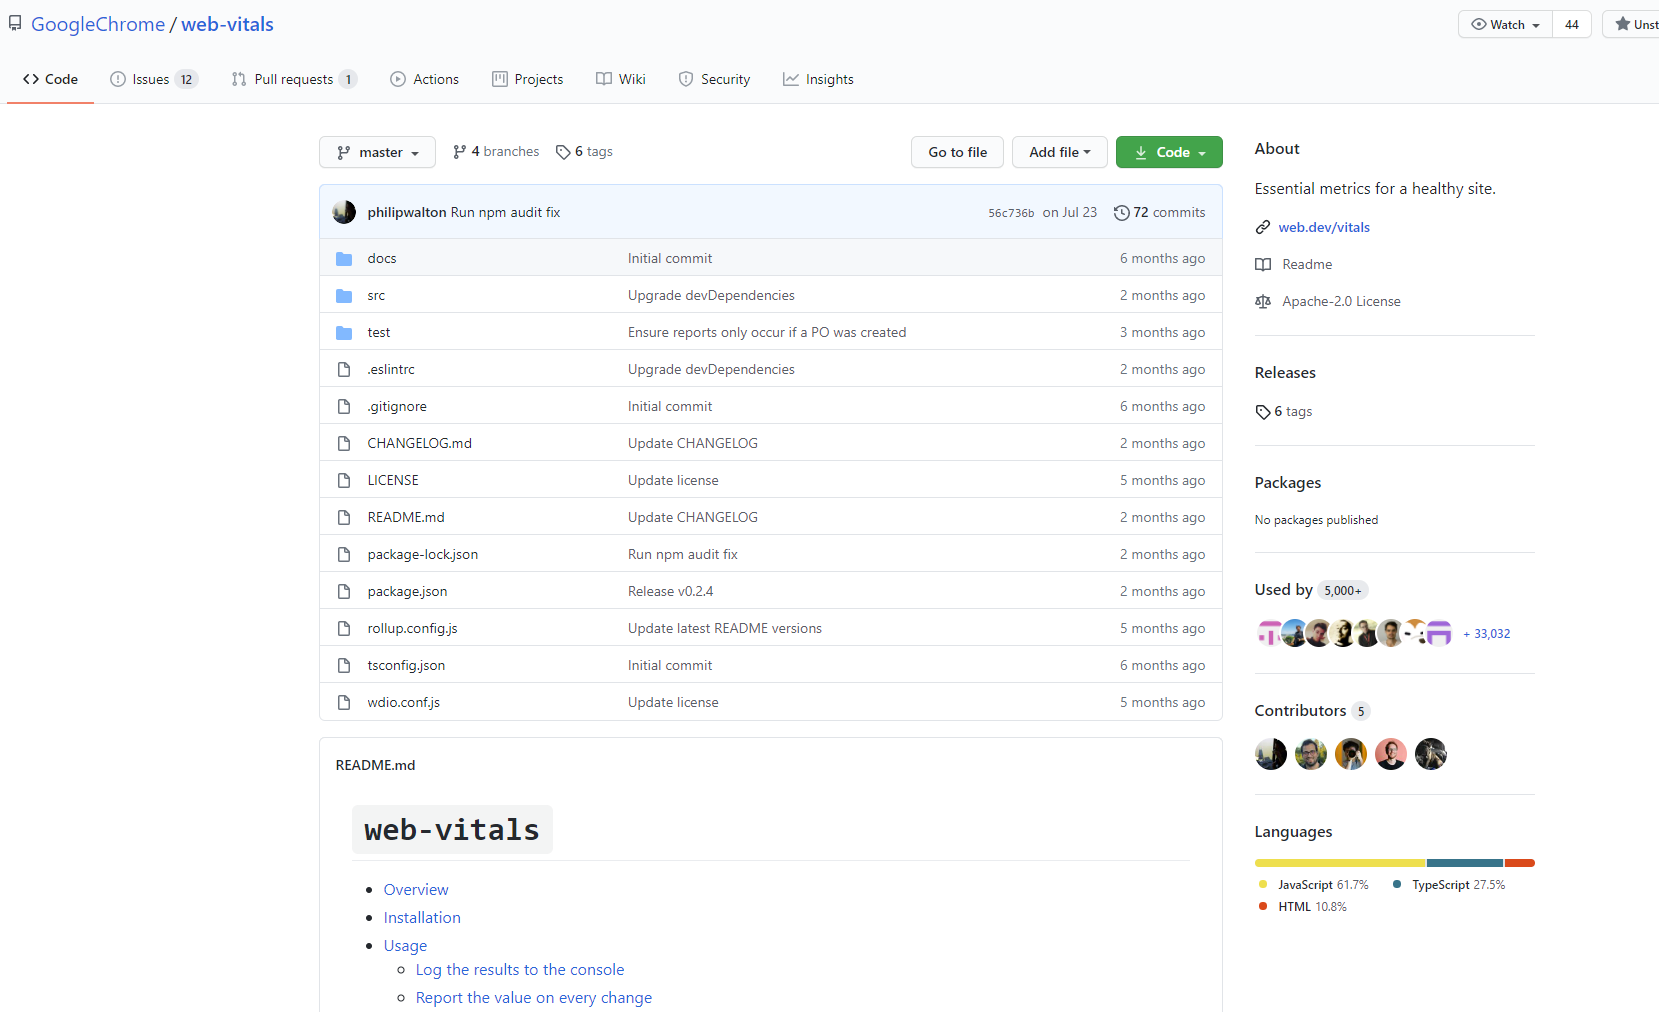
Google’s official web-vitals open-source JavaScript library measures all of Google’s Web Vitals metrics, in a way that accurately matches how they’re measured by Chrome and reported to other Google tools.
web-vitals can measure CLS throughout the page load process, and will also report CLS as the page is being unloaded or backgrounded.
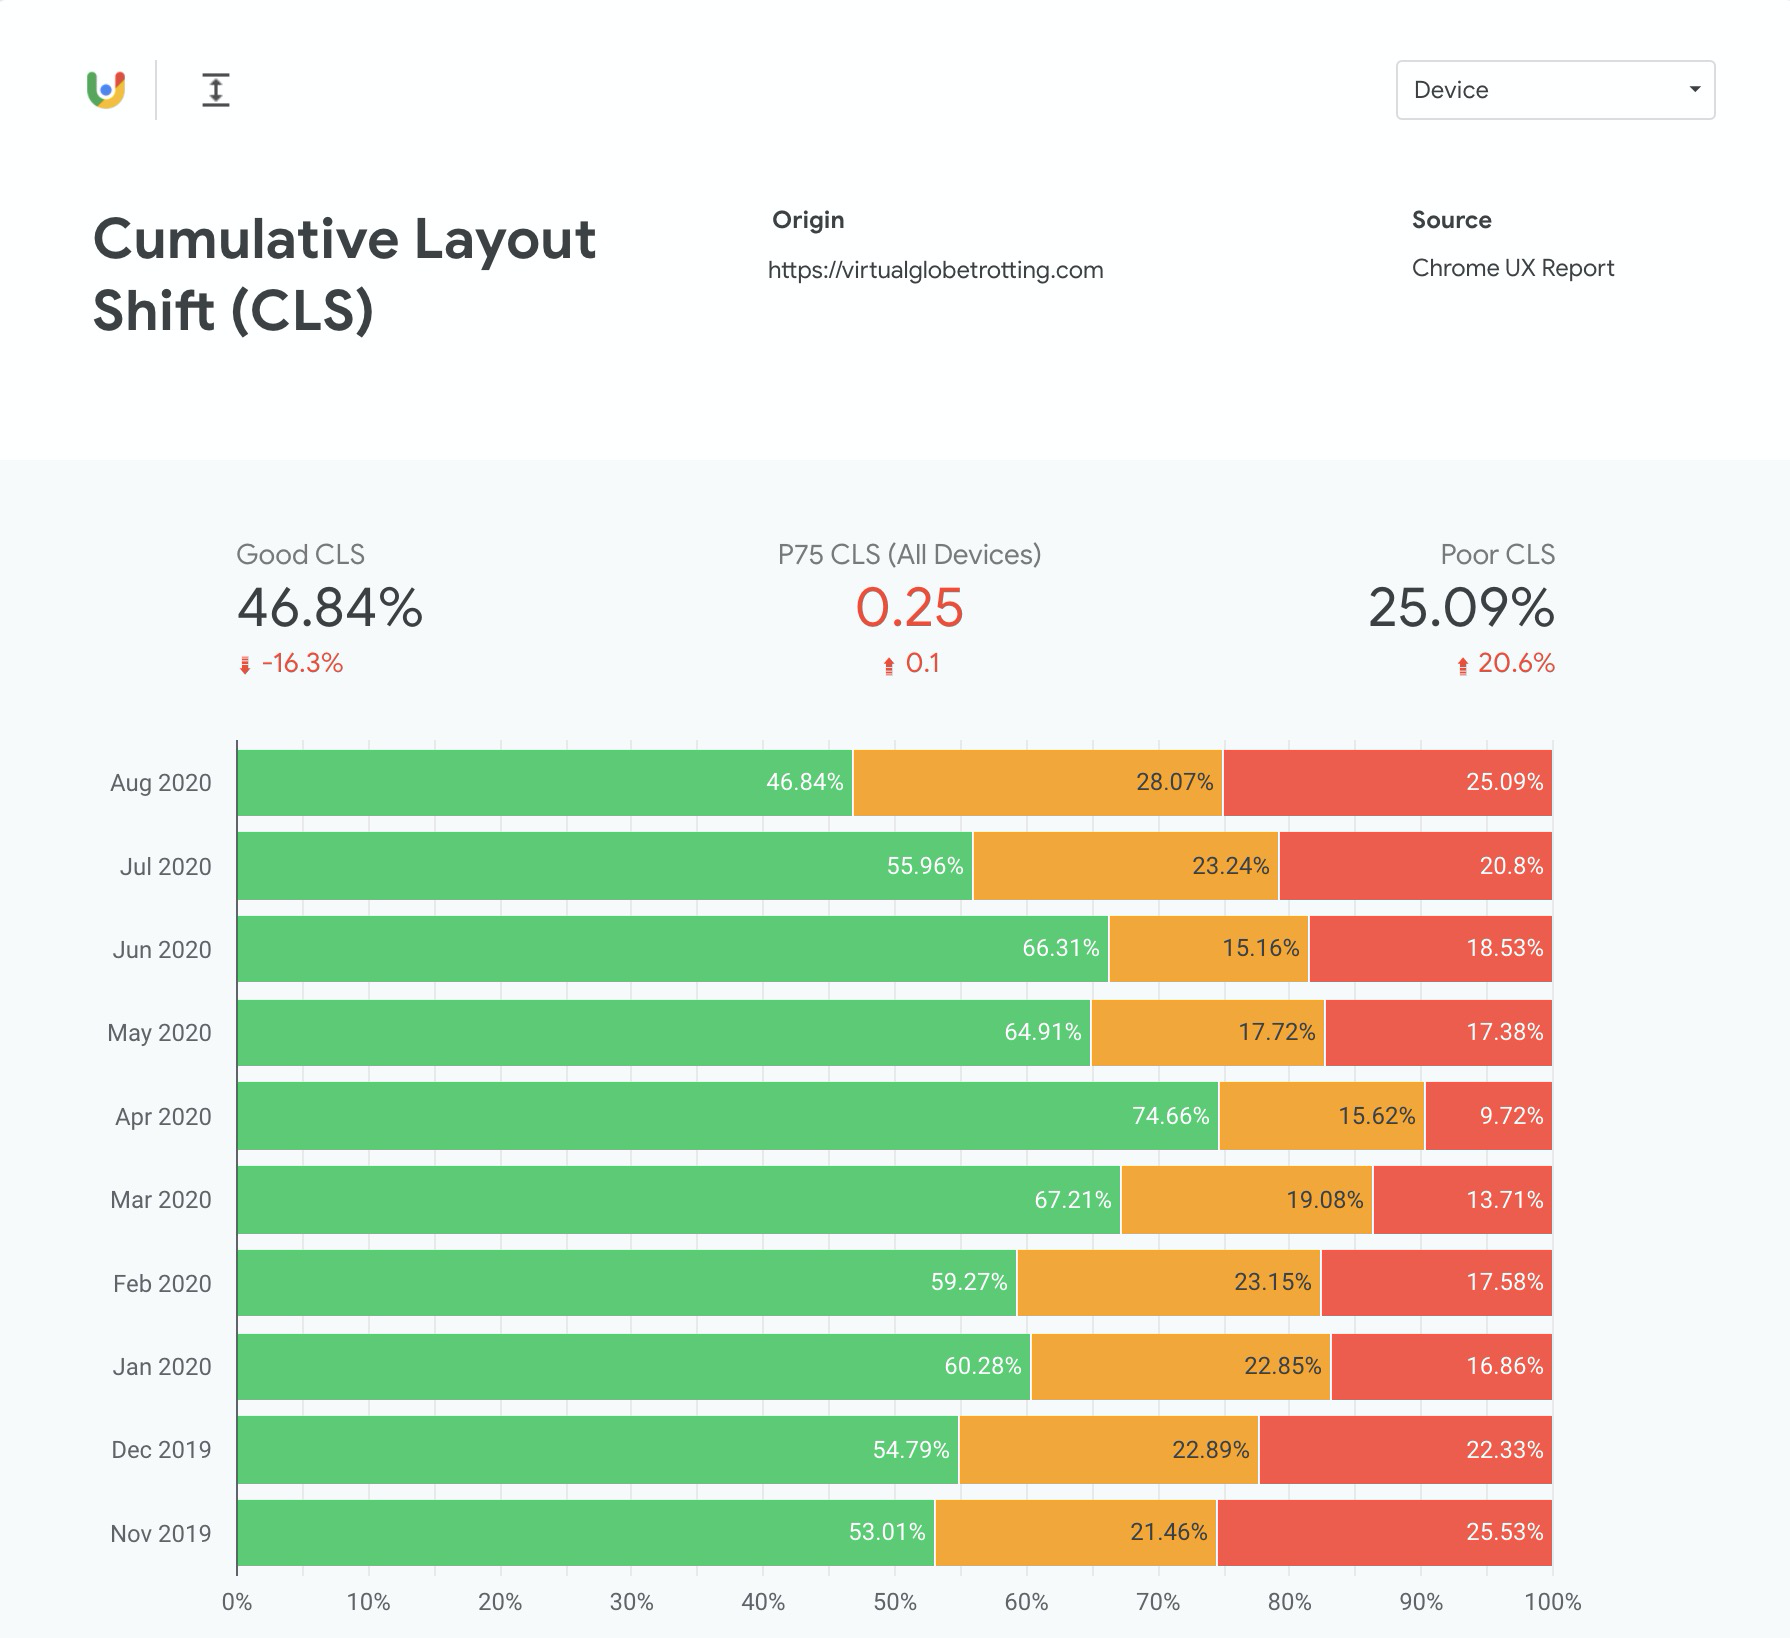
The Chrome User Experience (CrUX) Report provides real-user monitoring (RUM) data for Chrome users as they navigate across the web.
Its data is available via PageSpeed Insights and in raw form via the Public Google Big Query Project. It’s data is also used in Google Search Console’s Core Web Vitals report.
If you’re interested in setting up a CrUX report for your own domain, you can follow this guide.
CrUX always reports on the last 28 days of data.
Commercial RUM
Commercial Real User Monitoring (RUM) providers measure the experiences of real-world page loads. They can aggregate millions (or billions) of page loads into dashboards where you can slice and dice the data.
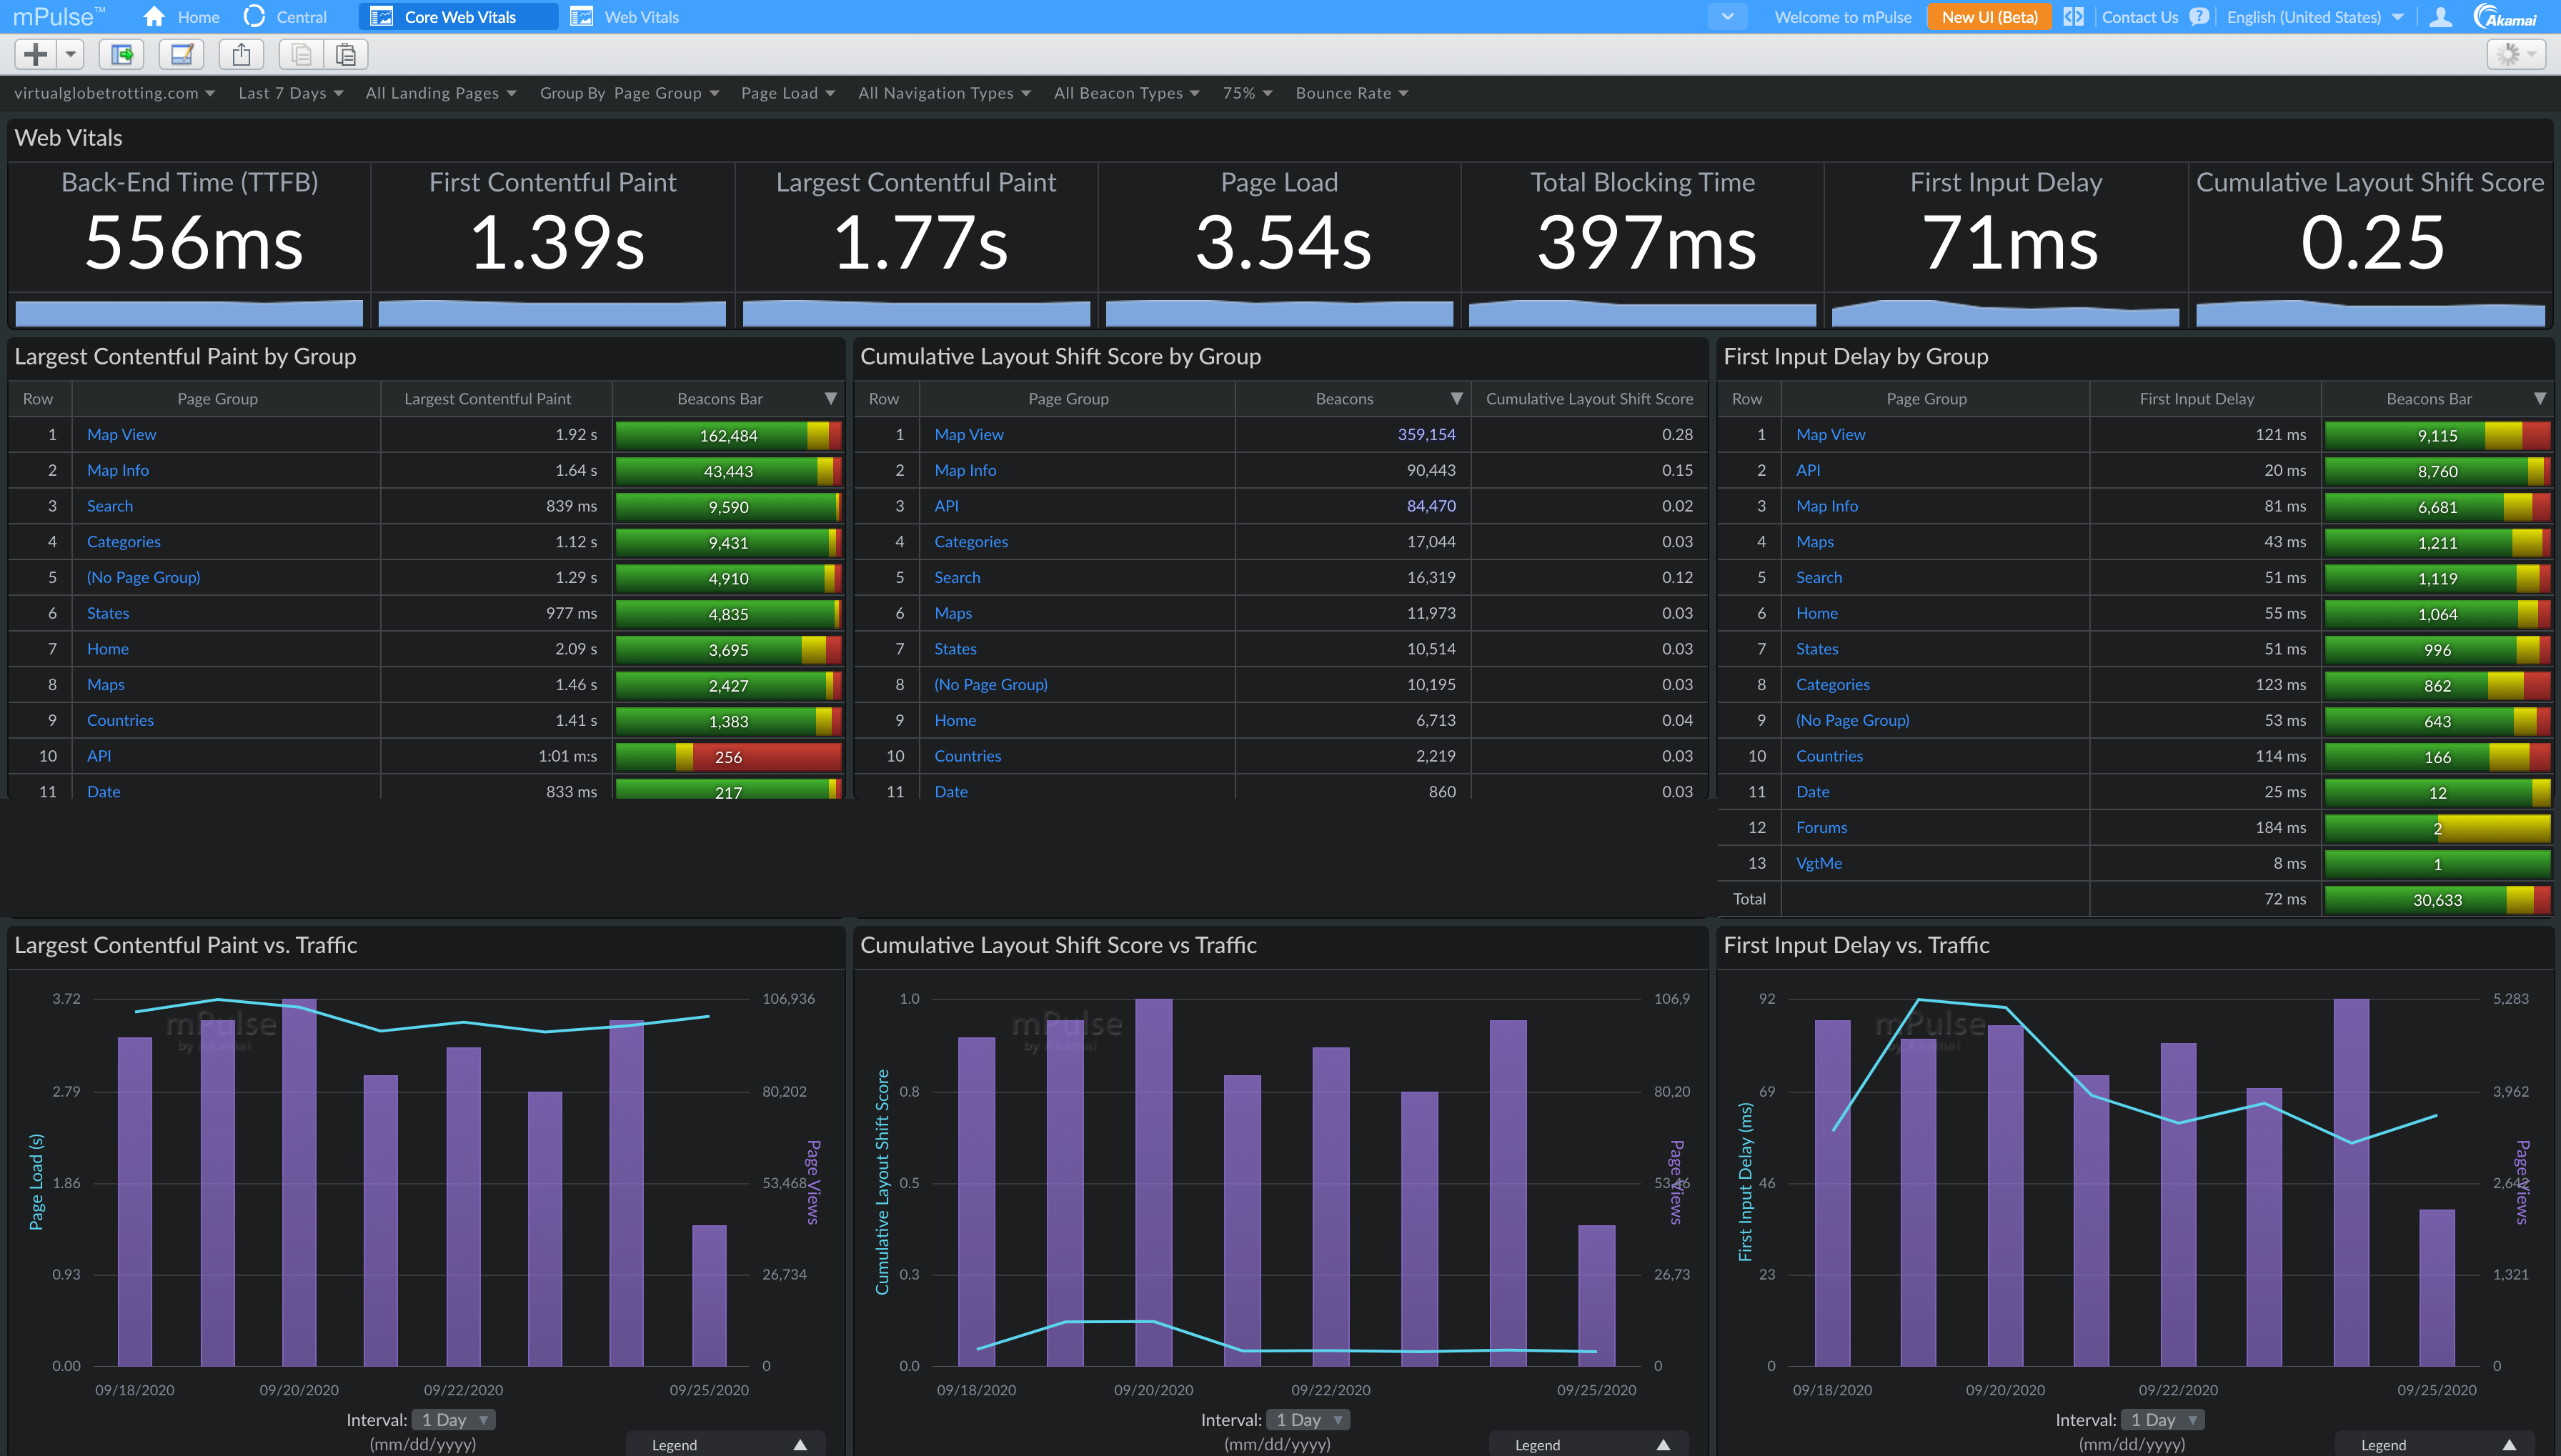
Akamai mPulse (which I work on) has added full support for Cumulative Layout Shift (and other Web Vitals):
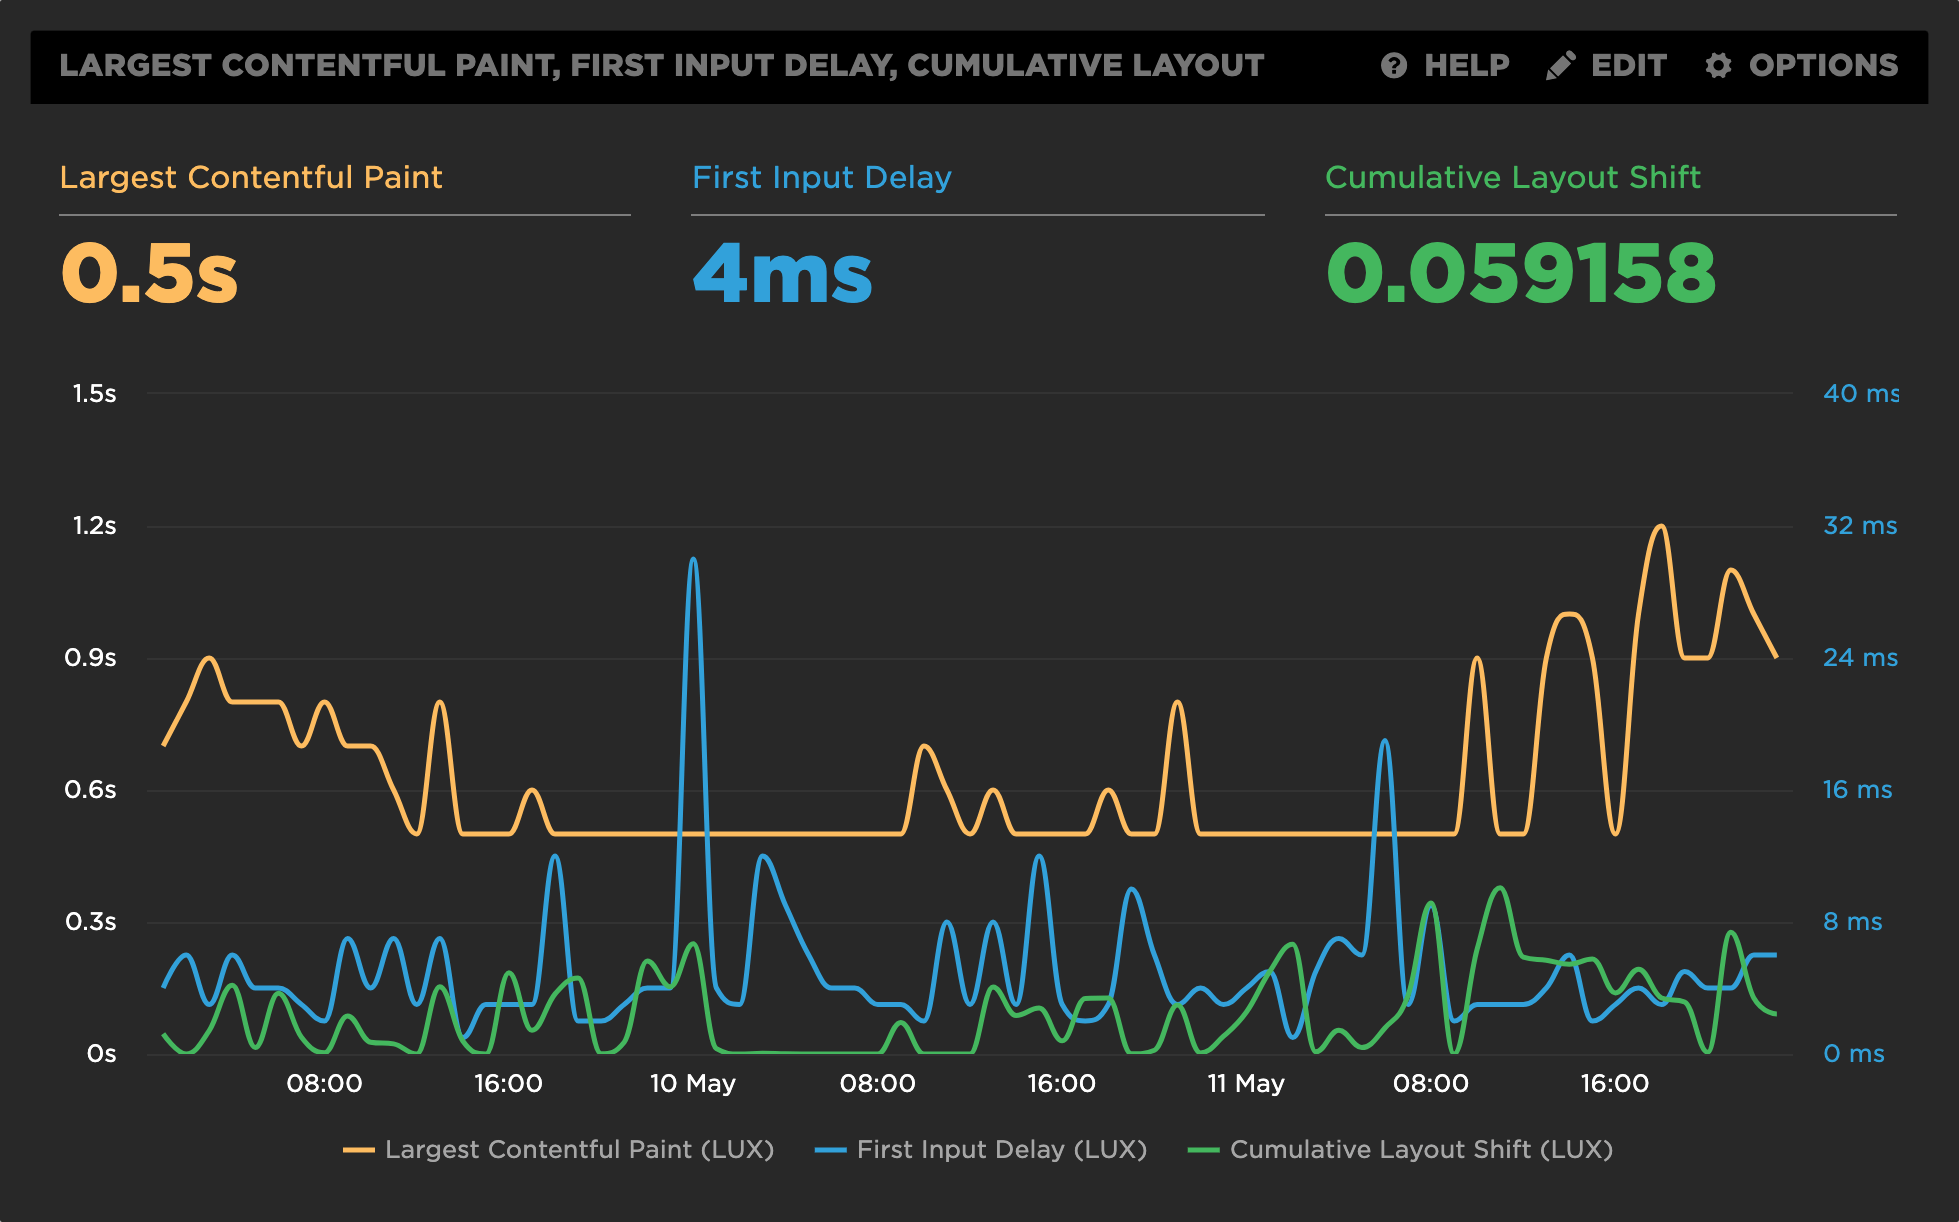
SpeedCurve‘s LUX RUM tool has full support for Web Vitals, including CLS:
New Relic Browser is New Relic’s RUM monitoring, and has added support for Cumulative Layout Shift in Browser Agent v1177.
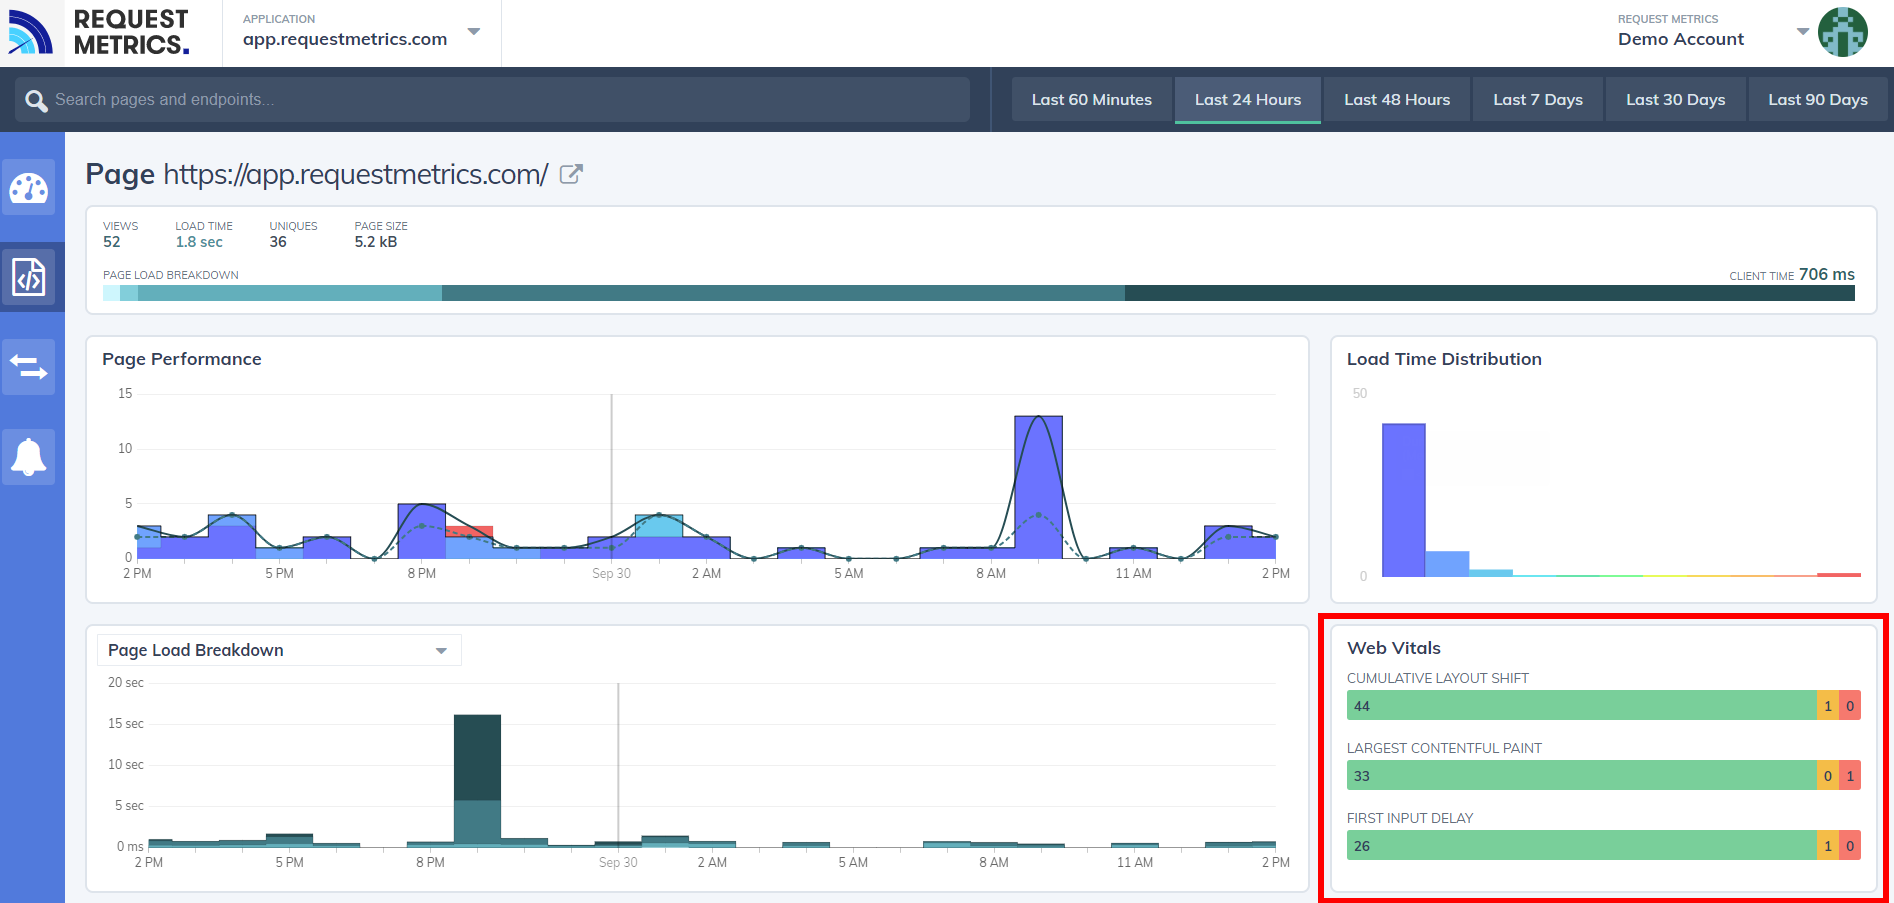
RequestMetrics provides website performance monitoring and has support for Web Vitals:
Synthetic
Synthetic tests are run in a lab-like environment or on developer machines. In general, synthetic tests allow for repeated testing of a URL in a consistent environment.
Synthetic developer tools take traces of individual page loads, and are fantastic for diving into and fixing CLS scores.
Synthetic monitoring tools help measure and monitor a URL (or set of URLs) over time, to ensure performance metrics don’t regress.
Free Synthetic Developer Tools
The following free synthetic developer tools can help you dive into individual URLs to understand what is causing layout shifts and how to fix them.
Chrome Developer Tools (and the Lighthouse browser extension/CLI) provide a wealth of information about Cumulative Layout Shift and the individual layout shifts that go into the score.
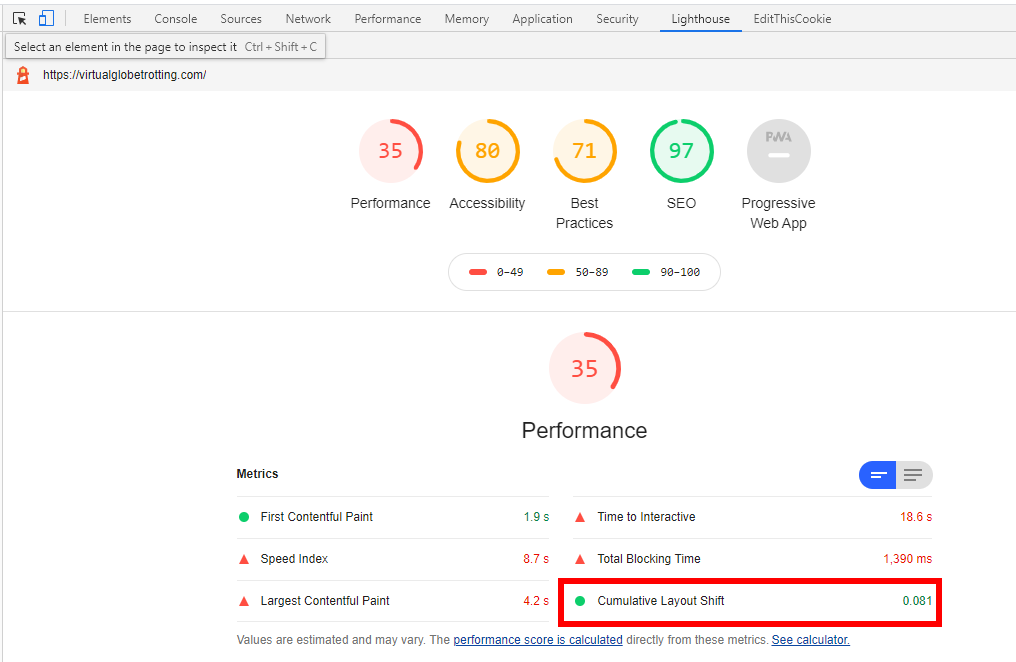
Within the Chrome Developer Tools, you have access to Lighthouse performance audits. Head to the Lighthouse tab, and run a Performance Audit:
In addition to the top-level Cumulative Layout Shift score, you can get a breakdown of the contributing layout shifts:
(Note there’s a bug where IFRAME shifts aren’t accounted for in the score but are shown in the breakdown)
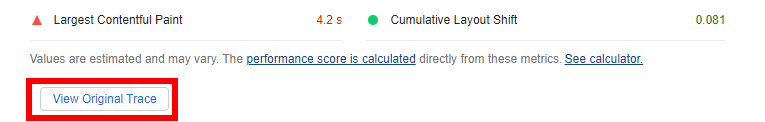
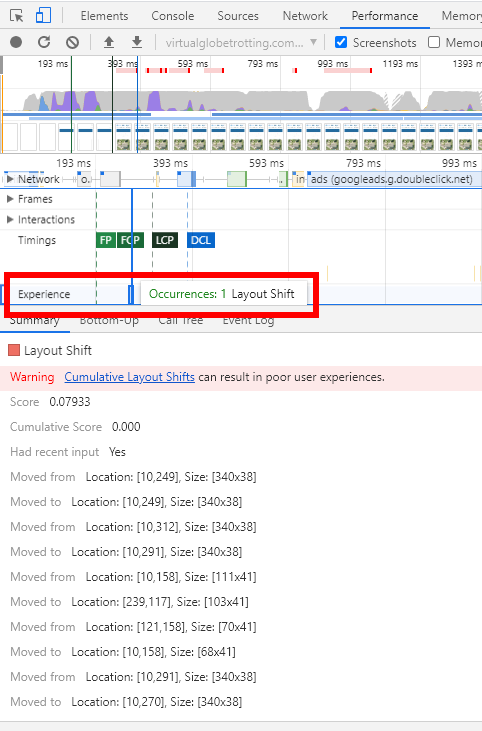
If you click on View Original Trace in the Audit, it will automatically open the Performance tab:
Within the Performance tab, there is now a new Experience row in the timeline that highlights individual layout shifts and their details:
Outside of taking a trace, you can browse while getting visual indicators that layout shifts are happening.
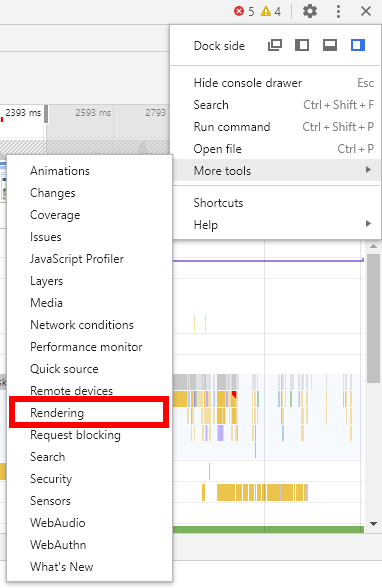
To do this, open the Rendering option in More Tools:
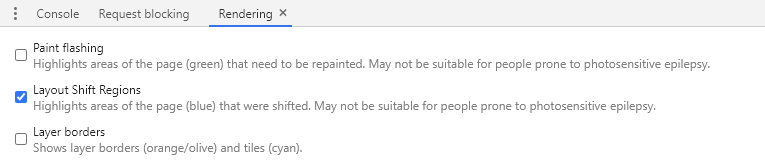
Then enable Layout Shift Regions:
And when you browse, you’ll see light-blue highlights of content that had layout shifts:
All of these tools can be used to help find, fix, and verify layout shifts.
PageSpeed Insights is a free tool from Google. It analyzes the content of a web page, then generates suggestions to make that page faster.
Behind the scenes, it runs Lighthouse as the analysis engine, so you’ll get similar results.
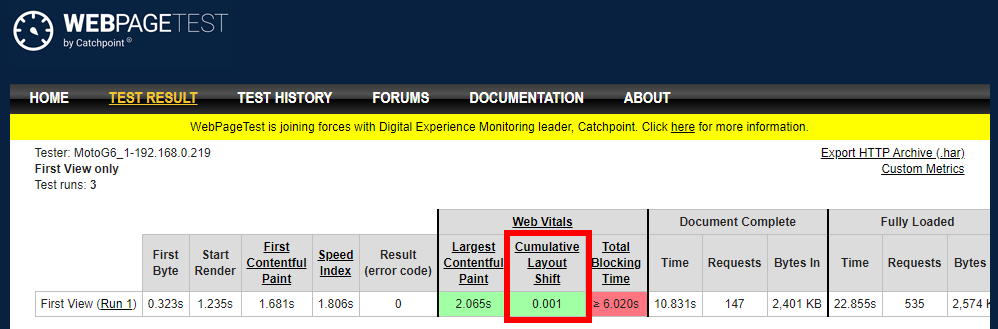
WebPagetest.org, the gold standard in free synthetic performance testing, has a Web Vitals section that calculates CLS (for Chrome browser tests).
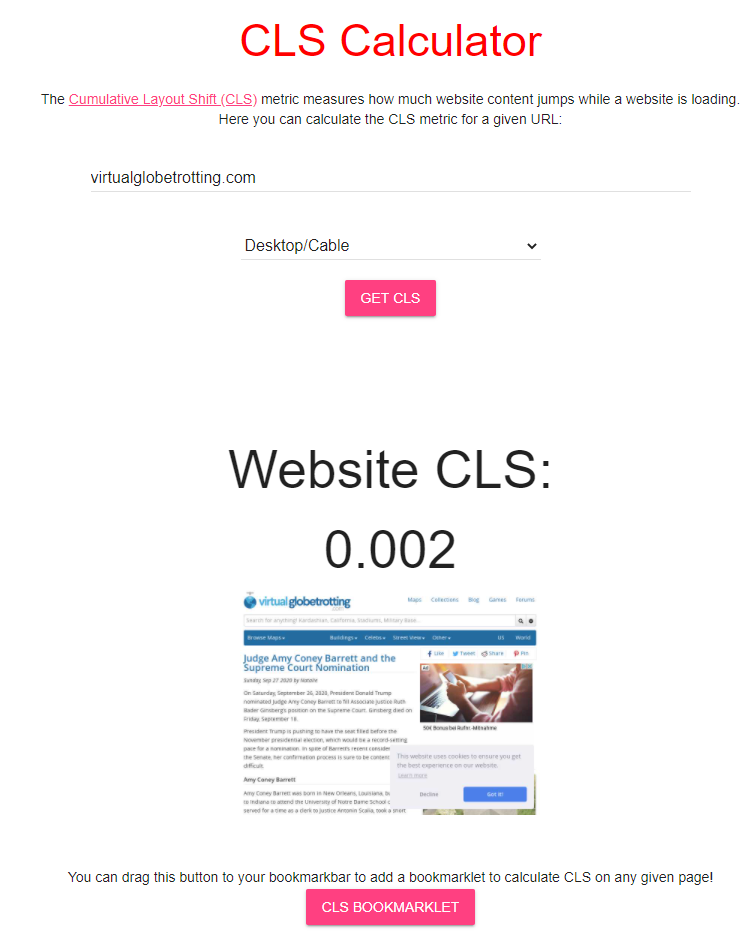
layoutstability.rocks provides a simple form where you can enter a URL to get the CLS of a page:
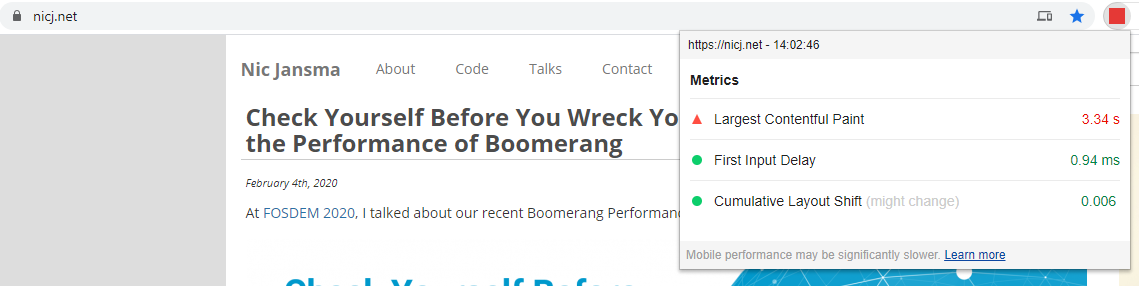
The Web Vitals Chrome Extension shows a page’s Largest Contentful Paint (LCP) in the extension bar, plus a popup with LCP, First Input Delay (FID) and Cumulative Layout Shift.
Commercial Synthetic Monitoring Tools
There are several commercial synthetic performance monitoring solutions that help measure Cumulative Layout Shift over time. Here is a sample of some of the best:
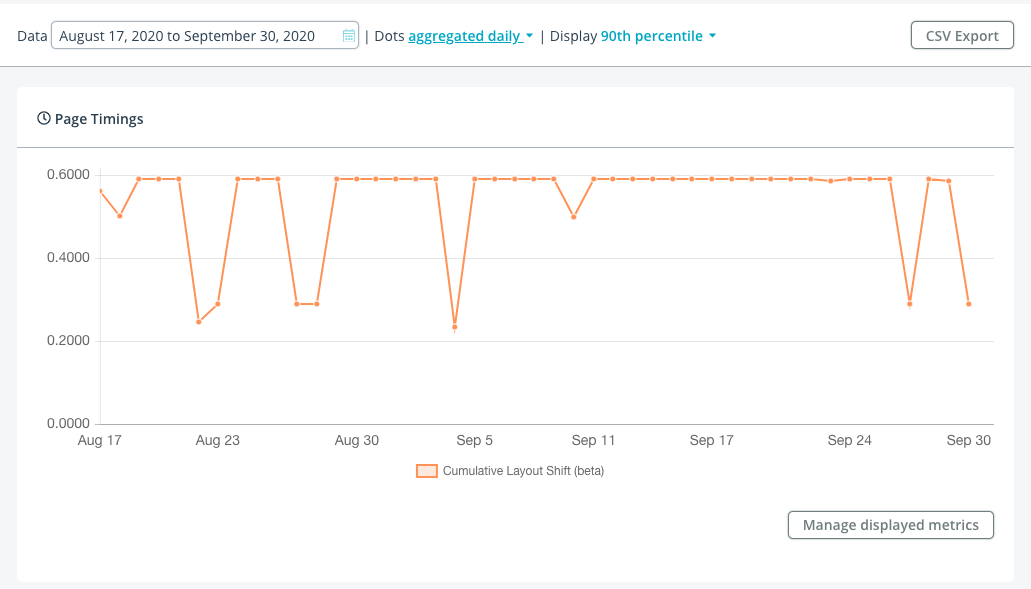
SpeedCurve has full support for Web Vitals, including CLS:
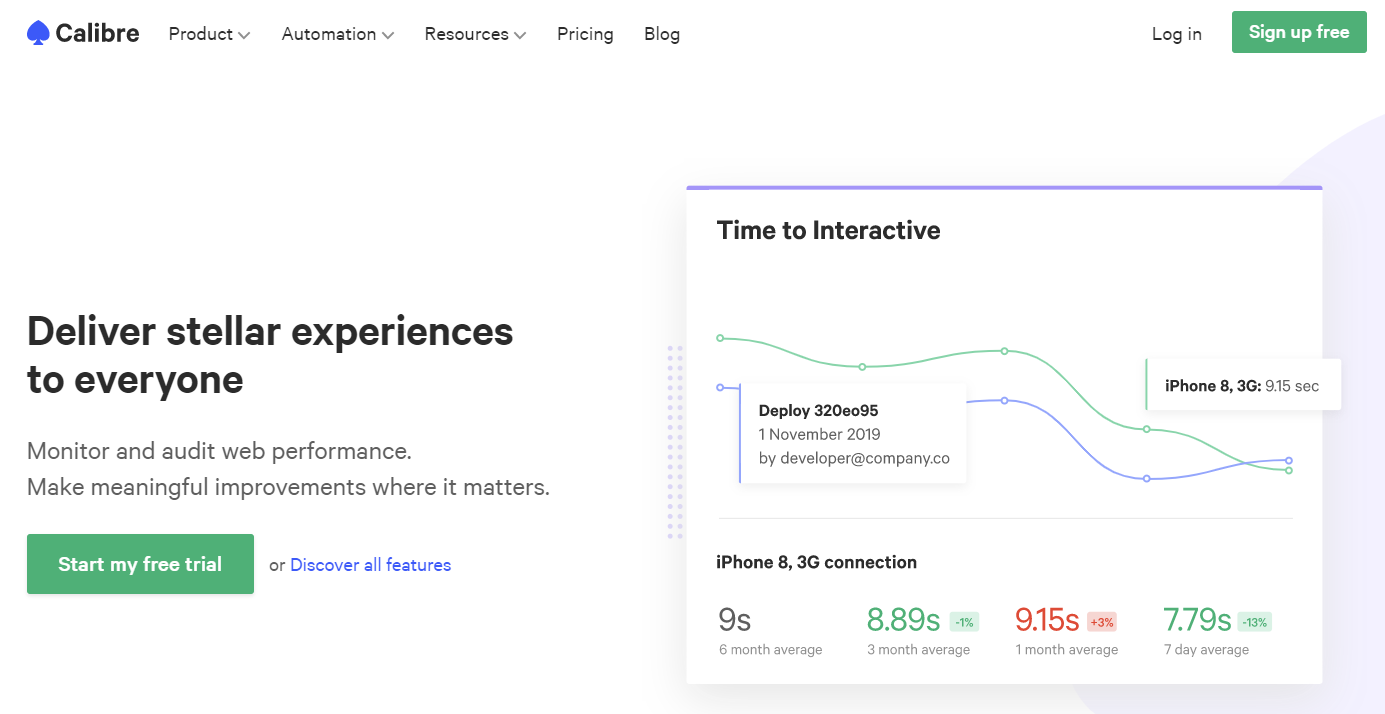
Calibre is a synthetic performance monitoring product, and has full support for Web Vitals, including CLS.
Rigor offers synthetic performance monitoring and supports Web Vitals.
DareBoost is a synthetic performance monitoring and website analysis product, and has recently added support for CLS.
Why does CLS differ between Synthetic and RUM?
(or even between tools?)
CLS scores reported by synthetic tests (such as Lighthouse, WebPagetest or PageSpeed Insights) may be different than CLS scores coming from real-world (RUM) data. RUM libraries (such as boomerang.js or web-vitals.js) may also report different CLS scores than browser data (such as from the Chrome User Experience (CrUX) report).
Here are some reasons why:
- Each tool may measure layout shifts until a different “end” point
- See the When does it End? section for more details
- This is especially important for Single Page Apps. For example, the Chrome User Experience (CrUX) data measures until the visibility state changes (i.e. when the page goes
hidden or unloads), while other RUM tools (like Boomerang) more frequently measure just up to the Page Load event, and each individual in-page Soft Navigation separately
- A single testcase (run) of a synthetic tool (e.g. one Lighthouse run) may report dramatically different results than real-world aggregated data (e.g. RUM or CrUX)
- Aggregated data may be reflective of a specific date or period in time, while other tools may focus on other date ranges. For example:
- CrUX always shows the last 28 days
- mPulse RUM can report any period from last 5 minutes to up to 18 months ago
- Google generally recommends measuring CLS at the 75th percentile across mobile and desktop devices. Make sure your tool has the capability of measuring different percentiles (and not just averages or only the median)
- Some tools throw out, or limit CLS scores over a certain value. For example:
- While today, layout shifts are not counted from IFRAMEs, the spec and synthetic tools suggest they should affect CLS. RUM tools may not be able to easily get layout shifts from IFRAMEs, causing RUM to under-report versus synthetic.
Real World Data
What do Cumulative Layout Shift scores look like in the real world?
I’ve written a companion post to this titled Cumulative Layout Shift in the Real World, which dives into CLS data by looking at data from Akamai mPulse’s RUM.
Head there for insights into how Cumulative Layout Shift scores correlate with business metrics, bounce rates, load times, rage clicks, and more!
What’s Next?
Cumulative Layout Shift is a relatively new metric, and it is still evolving. You can see some of the discussions happening in its GitHub issue tracker as well as through discussions in the Web Performance Working Group.
While it is only supported in Chromium-based browsers today, we hope that it is being considered for other engines as we’ve seen that the metric can provide a good measurement of user experience and correlates with other business metrics.
However, there is still a lot of work to be done to better understand where it’s working, when it doesn’t work, and how we should improve its usefulness over time. As more sites start paying attention to CLS, we will probably learn about its good and bad uses.
Will it be included as part of Google’s Core Vitals metrics next year? We’ll see! They’ve indicated that they’ll evaluate and evolve the primary metrics each year as they gather feedback.
References
Thanks
A few words of thanks…
Thanks to the Boomerang development team (funded by Akamai as part of mPulse), and other mPulse and Akamai employees, and specifically Avinash Shenoy for his work adding CLS support to Boomerang.
The Google engineering team has put a lot of thought and research into Web Vitals, the Layout Shift API and Cumulative Layout Shift scores. Kudos to them for driving for a new performance metric that helps reflect the user experience.
Updates
- 2020-10-21: Updated the IFRAMEs section to note that CrUX does factor in IFRAME layout shifts into their CLS scores