Archive

Author Archive

Cumulative Layout Shift in the Real World

October 9th, 2020

Table of Contents

Introduction

This is a companion post to Cumulative Layout Shift in Practice, which goes over what Cumulative Layout Shift (CLS) is, how it can be measured in lab (synthetic) and real-world (RUM) environments, and why it matters.

This article will review real world Cumulative Layout Shift data, taken by analyzing billions of individual page load experiences collected via Akamai mPulse’s RUM performance analytics. It is written from the point of view of an author of Boomerang and an employee working on mPulse, which measures CLS via the Boomerang JavaScript RUM library.

Real World Data

What do Cumulative Layout Shift scores look like in the real world?

The boomerang.js JavaScript RUM library has support for capturing Cumulative Layout Shift in version 1.700.0+. Boomerang measures CLS up to the Page Load or SPA Page Load event, as well as for each SPA Soft Navigation.

Akamai’s mPulse RUM product uses boomerang.js to gather performance metrics for Akamai’s customers.

As part of their Core Web Vitals, Google recommends a CLS score under 0.1 for a Good experience, and under 0.25 for Needs Improvement. Anything above 0.25 falls under the Poor category. They explain how they came up with these thresholds in a blog post with more details.

Google's Suggested CLS Values

Across the Web

Let’s take a look at a sample of the Cumulative Layout Shift distribution over all mPulse websites. This histogram reflects hundreds of millions of page load experiences captured over a week in September 2020:

CLS all Akamai mPulse websites

We see what looks like a logarithmic distribution with higher occurrences of CLS near 0.00 and a long tail out towards 2.0+. Note all CLS values over 2.0 are limited to 2.0 for these graphs.

Some interesting findings from this dataset:

  • 7.5% of page loads have CLS scores of 0.00 to 0.01 (the most common bucket)
  • 50% of page loads have CLS under 0.10 (the median)
  • 75% of page loads have CLS under 0.28 (what Google recommends to measure at)
  • 90% of page loads have CLS under 0.63
  • 95% of page loads have CLS under 0.93
  • 99% of page loads have CLS under 1.60
  • 0.5% of page loads have CLS over 2.00

There also seems to be a strange spike around 1.00 — I wonder if there’s a common scenario or type of website that shifts all visible content once? I hope to investigate this more later.

The 75th percentile (which Google recommends measuring at) shows a CLS score of 0.28 for these websites — just outside of the Needs Improvement range (0.1 to 0.25), and in to the Poor bucket (0.25 and higher). Luckily the median experience is at 0.10, right at the edge of the threshold for Good experiences (according to Google).

Note that all of the data you see in the chart above (and sections below) will be biased towards the websites mPulse measures, which skews more towards North America and European websites, across retail, financial and other sectors. It is not a representative sample of all websites.

This data may also be biased towards the higher-traffic websites that mPulse measures (it is not normalized by traffic rates).

By Industry

Let’s break down Cumulative Layout Shift by industry.

For these charts, we’re taking a sample of at least 5 websites for each industry, split by the top-level categories of Retail, News and Travel:

CLS Retail
CLS News
CLS Travel

These three graphs highlight how different industries (and for that matter, different websites) may have different page styles, and as a result, different user experiences.

These sample Retail websites show a relatively smooth logarithmic decrease from 0.00 towards 2.00. The 75th percentile user experience is 0.23 — in the Needs Improvement bucket, but better than the other sectors.

These sample News websites look similar to Retail, but also have a few spikes of data around 0.10 (and a smaller one at 1.00). The 75th percentile user experience is at 0.29, and it appears these experiences shift more towards the Poor bucket than Retail.

These sample Travel websites show a much different distribution, with spikes at a lot of different score buckets. These sites have a 75th percentile CLS score of 0.41, which is worse than the other two industries. In fact, this is the only sector with a median (0.29) in the Poor category.

(Obviously, the exact websites that go into each of these samples will have a dramatic effect on the shape of the graphs, but we tried to use similarly sized and traffic’d websites so one particular website doesn’t overly skew the data.)

By Page Group

A Page Group, for a specific website, is a set of pages with a common design or layout. Common Page Groups might be called Home, Product Page, Product List, Cart, etc. for a Retail website.

Each Page Group may be constructed differently, with varying content. While we can’t really compare Page Groups across different websites, it can be interesting to see how dramatically Cumulative Layout Shift scores may differ by Page Group on a single website.

For this example Retail website, we can see CLS scores for two unique Page Groups. The first Page Group shows a majority of Good experiences, while the second Page Group has mainly Poor experiences:

Example CLS Distribution - Page Group 1

Example CLS Distribution - Page Group 2

When looking at CLS for a website, or your website, make sure you understand all of the experiences going into the reported value, and that you have enough data to be able to target and reduce the largest factors of that score.

Desktop vs. Mobile

Breaking down CLS from all mPulse websites by device type shows slightly different curves:

CLS Desktop

CLS Mobile

Desktop CLS scores are skewed more towards 0.00 and logarithmically decrease towards 2.0+, while mobile CLS scores still have a spike around 0.00 but have additional peaks around 0.01 and drop off more slowly towards 1.00.

There’s also a noticeable spike for mobile CLS around 1.0, which we don’t see as pronounced in desktop. Maybe there is a subset of mobile pages or ads or widgets that shift all content at once?

The 75th percentile CLS for mobile (0.39) is notably worse than for desktop (0.23), and are in different ranking buckets (Poor vs. Needs Improvement). Mobile websites are often built differently than desktop layouts, but it’s a shame mobile users see such an increase in layout shifts. Shifting content can be frustrating and cause users to loose their place or mis-click on the wrong content, and those frustrations can be amplified on smaller screens.

vs. Bounce Rate

How does Cumulative Layout Shift affect Bounce Rate?

Bounce Rate is a measure of whether your visitors bounce (leave) after visiting a single page. Any user that visits two or more pages is considered a non-Bounce.

Since the first page will help decide whether the user navigates elsewhere, let’s take a look at Landing Page Cumulative Layout Shift vs. that user’s Bounce Rate (whether they left the site after the first page or not).

The theory is that if a user has a high Cumulative Layout Shift (i.e. negative experience) on the first page, they may be more likely to bounce.

Here’s one example Retail website. CLS (from 0.0 to 2.0 max) is on the X axis, Bounce Rate (as a percentage of users who bounced after one page at that CLS) on the Y axis. The size of the circle is the relative number of data points for that bucket:

Landing Page CLS vs. Bounce Rate Retail 1

We can see correlation (ρ=0.74) between Cumulative Layout Shift and Bounce Rate. There are obviously outliers, but the Poor (> 0.25) CLS scores generally increase Bounce Rate as the CLS increases.

Here’s a second retail website, which seems to show a similar correlation (ρ=0.83) to Bounce Rate:

Landing Page CLS vs. Bounce Rate Retail 2

Let’s look at a different sector of websites. Here’s a News website that shows less of a correlation (ρ=0.53):

Landing Page CLS vs. Bounce Rate News

(note the Y scale has changed)

The lowest CLS scores (Good experiences) show a relatively low Bounce Rate. As soon as the CLS goes out of the range of Good (0.1) towards Needs Improvement (0.25) and beyond, Bounce Rate stays relatively the same.

For this site, why doesn’t the Bounce Rate change much as the CLS increases? Honestly, I’m not sure, though if I had time I could dig into the data. It’s possible the lowest-CLS experiences are pages that entice the user to stay more.

For the retail websites, obviously CLS is just one measure of the user experience, and we just see a correlation with Bounce Rate. Improving CLS alone may not improve bounce rates. It’s probable that some of the lower-bouncing pages have lower CLS because of how they’re designed. Or, those lower-CLS pages are crafted “landing pages” that try to get the visitor to go to more pages on the site.

It’s also possible other factors like ad-blockers are affecting things here — maybe an ad-free non-shifting user experience keeps visitors longer? It would take a bit more research into the specific sites to understand this better.

vs. Session Length

Similar to Bounce Rate, Session Length is a measure of how many pages a visitor accesses over a specific period of time (e.g. 30 minutes).

Here’s the same retailer’s Session Length vs. Landing Page CLS. Like how Bounce Rate increased with CLS, let’s look to see if the Session Length decreases with higher CLS scores:

Landing Page CLS vs. Session Length Retail 1

As expected, the higher the Landing Page Cumulative Layout Shift, the fewer number of pages those visitors go to.

As we saw before with the same News website, lower CLS values seem to give a slightly higher Session Length (e.g. more pages were visited) for Good experiences, but the drop in Session Length isn’t as pronounced for higher CLS scores (the difference between ~1.5 and ~2.0 pages per Session).

Landing Page CLS vs. Session Length Retail 1

Also note this graph is just comparing the Landing Page CLS score — i.e. their first experience on the site — not the subsequent CLS scores from additional pages.

This data just shows a correlation, not causation. When looking at data like this, try to consider what is causing the shifts in the first place. Was it ads? Social widgets? Removing the content that causes the shifts will help multiple aspects of performance, including network activity, runtime tasks, layout shifts, and more.

vs. Page Load Time

Does Cumulative Layout Shift correlate with Page Load times?

Using Boomerang, we can collect Page Load times (for regular and Single Page Apps) as well as the Cumulative Layout Shift score (at the time of the load).

Here’s a plot of hundreds of millions of CLS score buckets versus the median Page Load times:

CLS vs. Page Load Time

There appears to be strong correlation (ρ=0.84) for Cumulative Layout Shift increasing with increased Page Load time.

Intuitively, I would expect this to be the case — the more content that is added to a page (which increases its Load Time), the more likely that content will cause layout shifts.

Again, this is just showing a correlation. Some layout shifts may be caused by simple layout inefficiencies or bugs. Other layout shifts may be directly caused by third-party content, which is also increasing Page Load time.

vs. Rage Clicks

Does Cumulative Layout Shift correlate with Rage Clicks?

Using Boomerang, we can collect Rage Clicks, which are a measure of how commonly a visitor clicks the same area repeatedly. One of the cases where this may happen is when a website stops reacting to user input, and the user repeats the same clicks in the same region.

Here’s a plot of hundreds of millions of CLS score buckets versus average Rage Clicks per page:

CLS vs. Page Load Time

We again see a decent correlation (ρ=0.77) between Cumulative Layout Shifts and Rage Clicks.

There is a strange spike of Rage Clicks around CLS values of ~0.10, and I haven’t had a chance to investigate why. That could be an over-representation of some website that has a lot of CLS values around 0.10 and higher Rage Click occurrences. Or it could be a common design pattern or widget/ad that is causing issues! Something to dig into in the future.

Rage Clicks can frustrate your users, and cause them to bounce. Even if you’re not measuring Rage Clicks directly, your CLS scores may give a hint toward how often it happens. It’s intuitive that the worst CLS scores (over 1.0) have a strong correlation with users (mis)clicking, if content is shifting around a lot.

What’s Next

Cumulative Layout Shift is still a relatively new metric for websites to measure. At mPulse, we capture billions of performance metrics a day, and there are still are a lot of aspects of CLS that we haven’t dug into yet. Over time, I hope to share more insights and graphs around CLS (and other performance metrics) in this post or others.

Being a relatively new metric, there is still a lot of opportunity to understand how closely CLS reflects the user experience. From the above data, we see correlations with business and performance metrics, but on its own, CLS scores may just be a side effect of how the rest of the site is built and the third party components or ads you include. If you’re interested in improving your own CLS score, you really need to dig into your own data and use developer tools to find and fix the shifts.

If you want to learn more about CLS in general, you can read the companion post Cumulative Layout Shift in Practice.

If you have any interesting insights into your own CLS data, please share below!

Cumulative Layout Shift in Practice

October 9th, 2020

Table of Contents

Introduction

Cumulative Layout Shift (CLS) is a user experience metric that measures how unstable content is for your visitors. Layout shifts occur when page content moves after being presented to the user. These unexpected shifts can lead to a frustrating visual and user experience, such as misplaced clicks or rendered content being scrolled out of view.

Trying to read or interact with a page that has a high CLS can be a frustrating experience! A common example of layout shifts occurs when reading an article on a mobile device, and you see your content jumping up or down as ads are dynamically inserted when you scroll:

Layout Shifts while reading content

Cumulative Layout Shift is a measure of how much content shifts on a page, and is one of Google’s Core Web Vitals metrics, so there has been a lot of attention on it lately. It will soon be used as a signal in Google’s Search Engine Optimization (SEO) rankings, meaning lower CLS scores may give higher search rankings.

As of September 2020, Cumulative Layout Shift is part of a draft specification of the Web Platform Incubator Community Group (WICG), and not yet a part of the W3C Standards track. It is only supported in Blink-based browsers (Chrome, Opera, Edge) at the moment.

This article will review what Cumulative Layout Shift is, how it can be measured in lab (synthetic) and real-world (RUM) environments, and why it matters. A companion post dives into what CLS looks like in the real world by looking at mPulse RUM data.

This article is written from the point of view of an author of Boomerang and an employee working on Akamai’s mPulse RUM product, which measures CLS via the Boomerang JavaScript RUM library.

What is Cumulative Layout Shift?

Cumulative Layout Shift is a score that starts at 0.0 (for no unexpected shifts) and grows incrementally for each unexpected layout shift that happens on the page.

The score is unitless and unbound — theoretically, you could see CLS scores over 1.0 or 10.0 or 100.0 on highly shifting pages. In the real world, 99.5% of CLS scores are under 2.0.

As part of their Core Web Vitals, Google recommends a CLS score under 0.10 for a Good experience, and under 0.25 for Needs Improvement. Anything above 0.25 falls under the Poor category. They explain how they came up with these thresholds in a blog post with more details.

Google's Suggested CLS Values

Note that Google’s recommended CLS value of 0.10 is for the 75th percentile of your users on both mobile and desktop.

For this blog post, we will generally use Google’s recommended thresholds above when talking about Good, Needs Improvement, or Poor categories.

Importantly, just like any performance metric, Cumulative Layout Shift is a distribution of values across your entire site. While individual synthetic tests (like WebPagetest or Lighthouse) may only measure a single (or few) test runs, when looking at your CLS scores from the wild in RUM data, you may have thousands or millions of individual data points. CLS will be different for different page types, visitors, devices, and screens.

Let’s say, through some sort of aggregate data (like mPulse RUM or CrUX), you know that your site has a Cumulative Layout Shift score of 0.31 at the 75th percentile.

Here’s what that distribution could look like:

Example CLS Distribution

The frequency distribution above shows real data (via mPulse) for a retail website over a single day, comprising of 7+ million user experiences. Note that while the 75th percentile is 0.31 (Poor), the median (50th percentile) is 0.16 (Needs Improvement).

The distribution is not normal, and shows that there are a few “groups” of common CLS scores, i.e. around 0.00, 0.10, 0.17 and 1.00. It’s possible those humps represent different subsets of the data, such as different device types or page groups.

For example, let’s breakdown the data into Desktop vs. Mobile:

Example CLS Distribution - Desktop

Example CLS Distribution - Mobile

As you can see, your experience varies by the type of device that you’re on.

Desktop users have a lot of CLS scores between 0.0 and 0.4, with a small bump around 1.0.

Mobile users have some experiences around 0.0, a spike at 0.06-0.10, then a fairly even distribution all the way to 1.0.

Of course, different parts of a website may be constructed differently, with varying content. Reviewing CLS scores for two unique page groups shows a Good experience for the first type of page, and a lot of Poor experiences for the second type of page:

Example CLS Distribution - Page Group 1

Example CLS Distribution - Page Group 2

All of this is to say, when looking at CLS for a website, make sure you understand all of the experiences going into the reported value, and that you have enough data to be able to target and reduce the largest factors of that score.

Why is it important?

Why does Cumulative Layout Shift matter?

CLS is one measurement of the user experience. There are many ways your website can frustrate or delight your users, and CLS is a measurement that may highlight some of those negative experiences.

A bad (high) CLS score may indicate that users are seeing content shift and flow around as they’re trying to interact with your site, which can be frustrating. Users who get frustrated may leave your site, and never come back!

Some of those frustrating experiences may be:

  • Reading an article and having the content jump down below the viewport, causing the visitor to lose their place (see demo at the start of this article)
  • Mis-clicking or clicking the wrong button:
Mis-click demo

See the data below in the real-world data section for how Cumulative Layout Shift correlates with other performance and business metrics, such as Bounce Rate, Session Length, Rage Clicks and more.

In some ways, Cumulative Layout Shift is more of a user experience / web design metric than a web performance metric. It measures what the user sees, not how long something takes.

It’s good for the websites to move away from just measuring network- and DOM-based metrics and towards measuring more of the overall user experience. We need to understand what delights and frustrates our users.

Finally, Google is putting their weight behind the metric and will be using it as a signal in Google’s Search Engine Optimization (SEO) rankings. Search ranking have a direct impact on visitors, and a lot of attention has been going into CLS as a result.

Definition

The Cumulative Layout Shift score is a sum of the impact of each unexpected layout shift that happens to a user over a period of time.

Multiple Layout Shifts

Only shifts of visible content from within in the viewport matter. Content that moves below the fold (or currently scrolled viewport) does not degrade the user experience.

As a visitor loads and interacts with a site, they may encounter these layout shifts. The sum of the “scores” of each individual layout shift results in the Cumulative Layout Shift score.

To calculate the score from an individual layout shift, we need to look at two components of that shift: its impact fraction and distance fraction.

The impact fraction measures how much of the viewport changed from one frame (moment) to the next.

CLS - Impact Fraction

In the above screenshot, the green frame shows the portion of the viewport changing from the previous frame.

The distance fraction measures the greatest distance moved by any of those unstable elements, as a portion of the viewport’s size.

CLS - Distance Fraction

In the above screenshot, the blue arrow shows the distance fraction (from the new Ads/Widgets coming in).

Multiplied together, you get a single layout shift score:

layout shift score = impact fraction * distance fraction

Each layout shift is then accumulated into the Cumulative Layout Shift score over time.

Both HTML Elements (such as images, videos, etc.) as well as text nodes may be affected by layout shifts. Under discussion is whether some types of hidden elements (such as visibility:hidden) would be considered.

For further details, the web.dev article on CLS has a great explanation on how CLS is calculated as well.

When does it End?

The point at which individual layout shifts stop being added to the Cumulative Layout Shift score may differ depending on what you or your tool is measuring.

Tools may measure up to one of the following events:

  • When the browser’s onload event fires
  • For Single Page Apps (SPAs), when all SPA content is loaded
  • For the life of the page (even after the user interacts with the page)

When does CLS end?

If your main concern is just the Page Load experience, you can accumulate layout shifts into the Cumulative Layout Shift score until the browser’s onload event fires (or a similar event for Single Page Apps).

These onload (and SPA “load”) events are measuring until a pre-defined and consistent phase of the page load. Once that phase has been reached (e.g. most/all content is loaded), the Cumulative Layout Shift score accumulated from the start of the navigation through that event is finalized.

This type of “load-limited” Cumulative Layout Shift is often what pure synthetic tools such as Lighthouse or WebPagetest measure, in the absence of any user interactions on the page. RUM tools, such as Boomerang.js also generally send their beacon right after the load events, so will stop their CLS measurements there.

Alternatively, CLS can be measured beyond just the “load” event, continually accumulating as the user interacts on the page. Layout shifts that happen after the result of scrolling (e.g. dynamic ad loads) can be especially frustrating users. It’s worthwhile measuring the page’s entire lifetime CLS if you can. You would generally accumulate layout shifts until something like the visibilitychange event (when the page goes hidden or unloads).

As a result, these “page lifetime” CLS scores will likely be higher than “load-limited” CLS scores. See the RUM vs. Synthetic section for more details on why different tools may report a different CLS.

If your page is a Single Page App (SPA), it’s probably best to “restart” the Cumulative Layout Shift score each time an in-page (“Soft”) SPA navigation starts. This way the score will reflect each view change and will not just keep growing indefinitely as users interacts with the page over time. More details in the SPA section.

Single Page Apps (SPAs)

Measuring the user experience in a Single Page App (SPA) is a unique challenge. SPAs rewrite and may completely change the DOM and visuals as the user navigates throughout a website.

For example, when Boomerang is on a SPA website with SPA monitoring enabled, it takes additional steps to measure the page’s performance and user experience:

  • Instead of waiting for just the onload event to gather performance data, it waits for the dynamic visual content to be fetched. This is called a “SPA Hard Navigation“.
  • Boomerang monitors for state and view changes from the SPA framework as the user clicks around, and tracks the resources fetched as part of a “SPA Soft Navigation”

Both types of SPA navigations can shift content around on the page, potentially causing unexpected layout shifts. The definition of Cumulative Layout Shift actually excludes content changes right after direct user input such as clicks (since those types of changes to the view are intentional and expected by the user), but additional dynamic content (ads, widgets) after the initial shifts may be unexpected and frustrating.

Since the onload event in SPAs doesn’t matter as much, it’s worthwhile to keep accumulating the Cumulative Layout Score beyond just onload. For example, Boomerang in SPA mode measures CLS up to the end of the SPA Hard Navigation (when all dynamic content has loaded), when it sends its beacon.

After the SPA Hard Navigation, it’s also useful to know about the user experience during subsequent Soft Navigations. Resetting the CLS value for each Soft Navigation lets you understand how each individual view change affects the user experience.

CLS with SPA Navigations

Not all measurement tools will be able to split out CLS by Soft Navigation. For example, the Chrome User Experience (CrUX) data measures all layout shifts until the page goes hidden (or unloads), which means the Hard navigation and all Soft navigations are combined and Cumulative Layout Shift is just the sum of all of those experiences.

IFRAMEs

The Layout Instability spec mentions that:

The cumulative layout shift (CLS) score is the sum of every layout shift value that is reported inside a top-level browsing context, plus a fraction (the subframe weighting factor) of each layout shift value that is reported inside any descendant browsing context.

and

The subframe weighting factor for a layout shift value in a child browsing context is the fraction of the top-level viewport that is occupied by the viewport of the child browsing context.

In other words, shifts in IFRAMEs should affect the top-level document’s CLS score.

This seems logical, right? IFRAMEs that are in the viewport also have the chance to shift visible content. End-users don’t necessarily know which content is in a frame versus the top-level page, so IFRAME layout shifts should be able to affect the top-level document’s Cumulative Layout Shift Score.

CLS In IFRAMEs

In the above image, let’s pretend the content in the blue box is in an <iframe> taking approximately 50% of the viewport. If an Annoying Ad pops it, it may cause a Layout Shift with a value of 0.10 within the IFRAME itself. That layout shift could theoretically affect its’ parent’s Cumulative Layout Shift as well. Since the IFRAME is 50% of the viewport of its parent, the parent’s Cumulative Layout Shift core would increase by 0.05.

Here’s the complication:

  • While the Layout Instability spec proposes this behavior, as of October 2020, IFRAME layout shifts do not affect the Cumulative Layout Shift scores in most current synthetic and RUM tools
  • Chrome Lighthouse (in browser Developer Tools, as well as powering PageSpeed Insights and WebPagetest’s CLS scores) does not currently track Layout Shifts in frames.
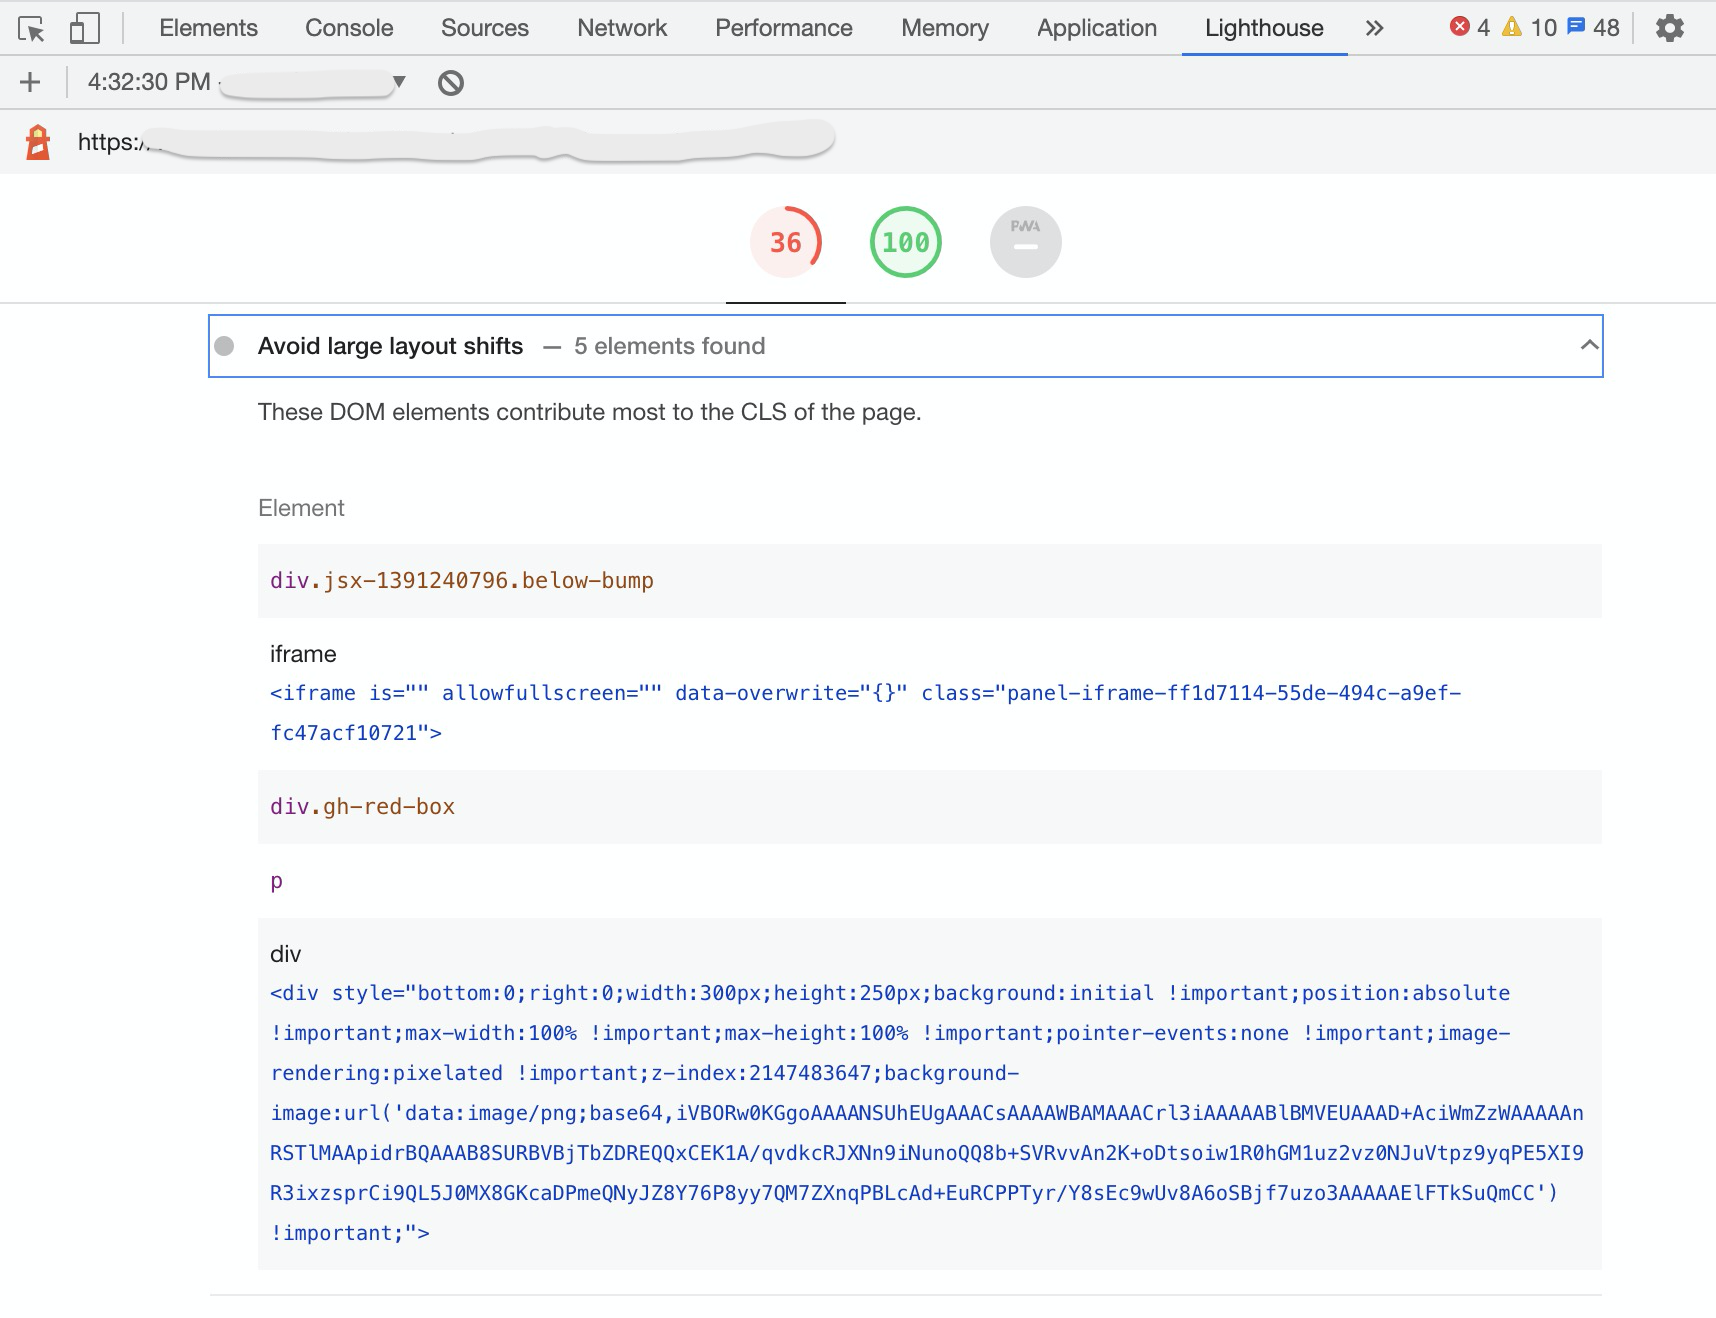
    • While Lighthouse reports a CLS of 0.0 for shifts from IFRAMEs, it will still suggest Avoid large layout shifts for any shifts in those frames (bug tracking this), which can be confusing:
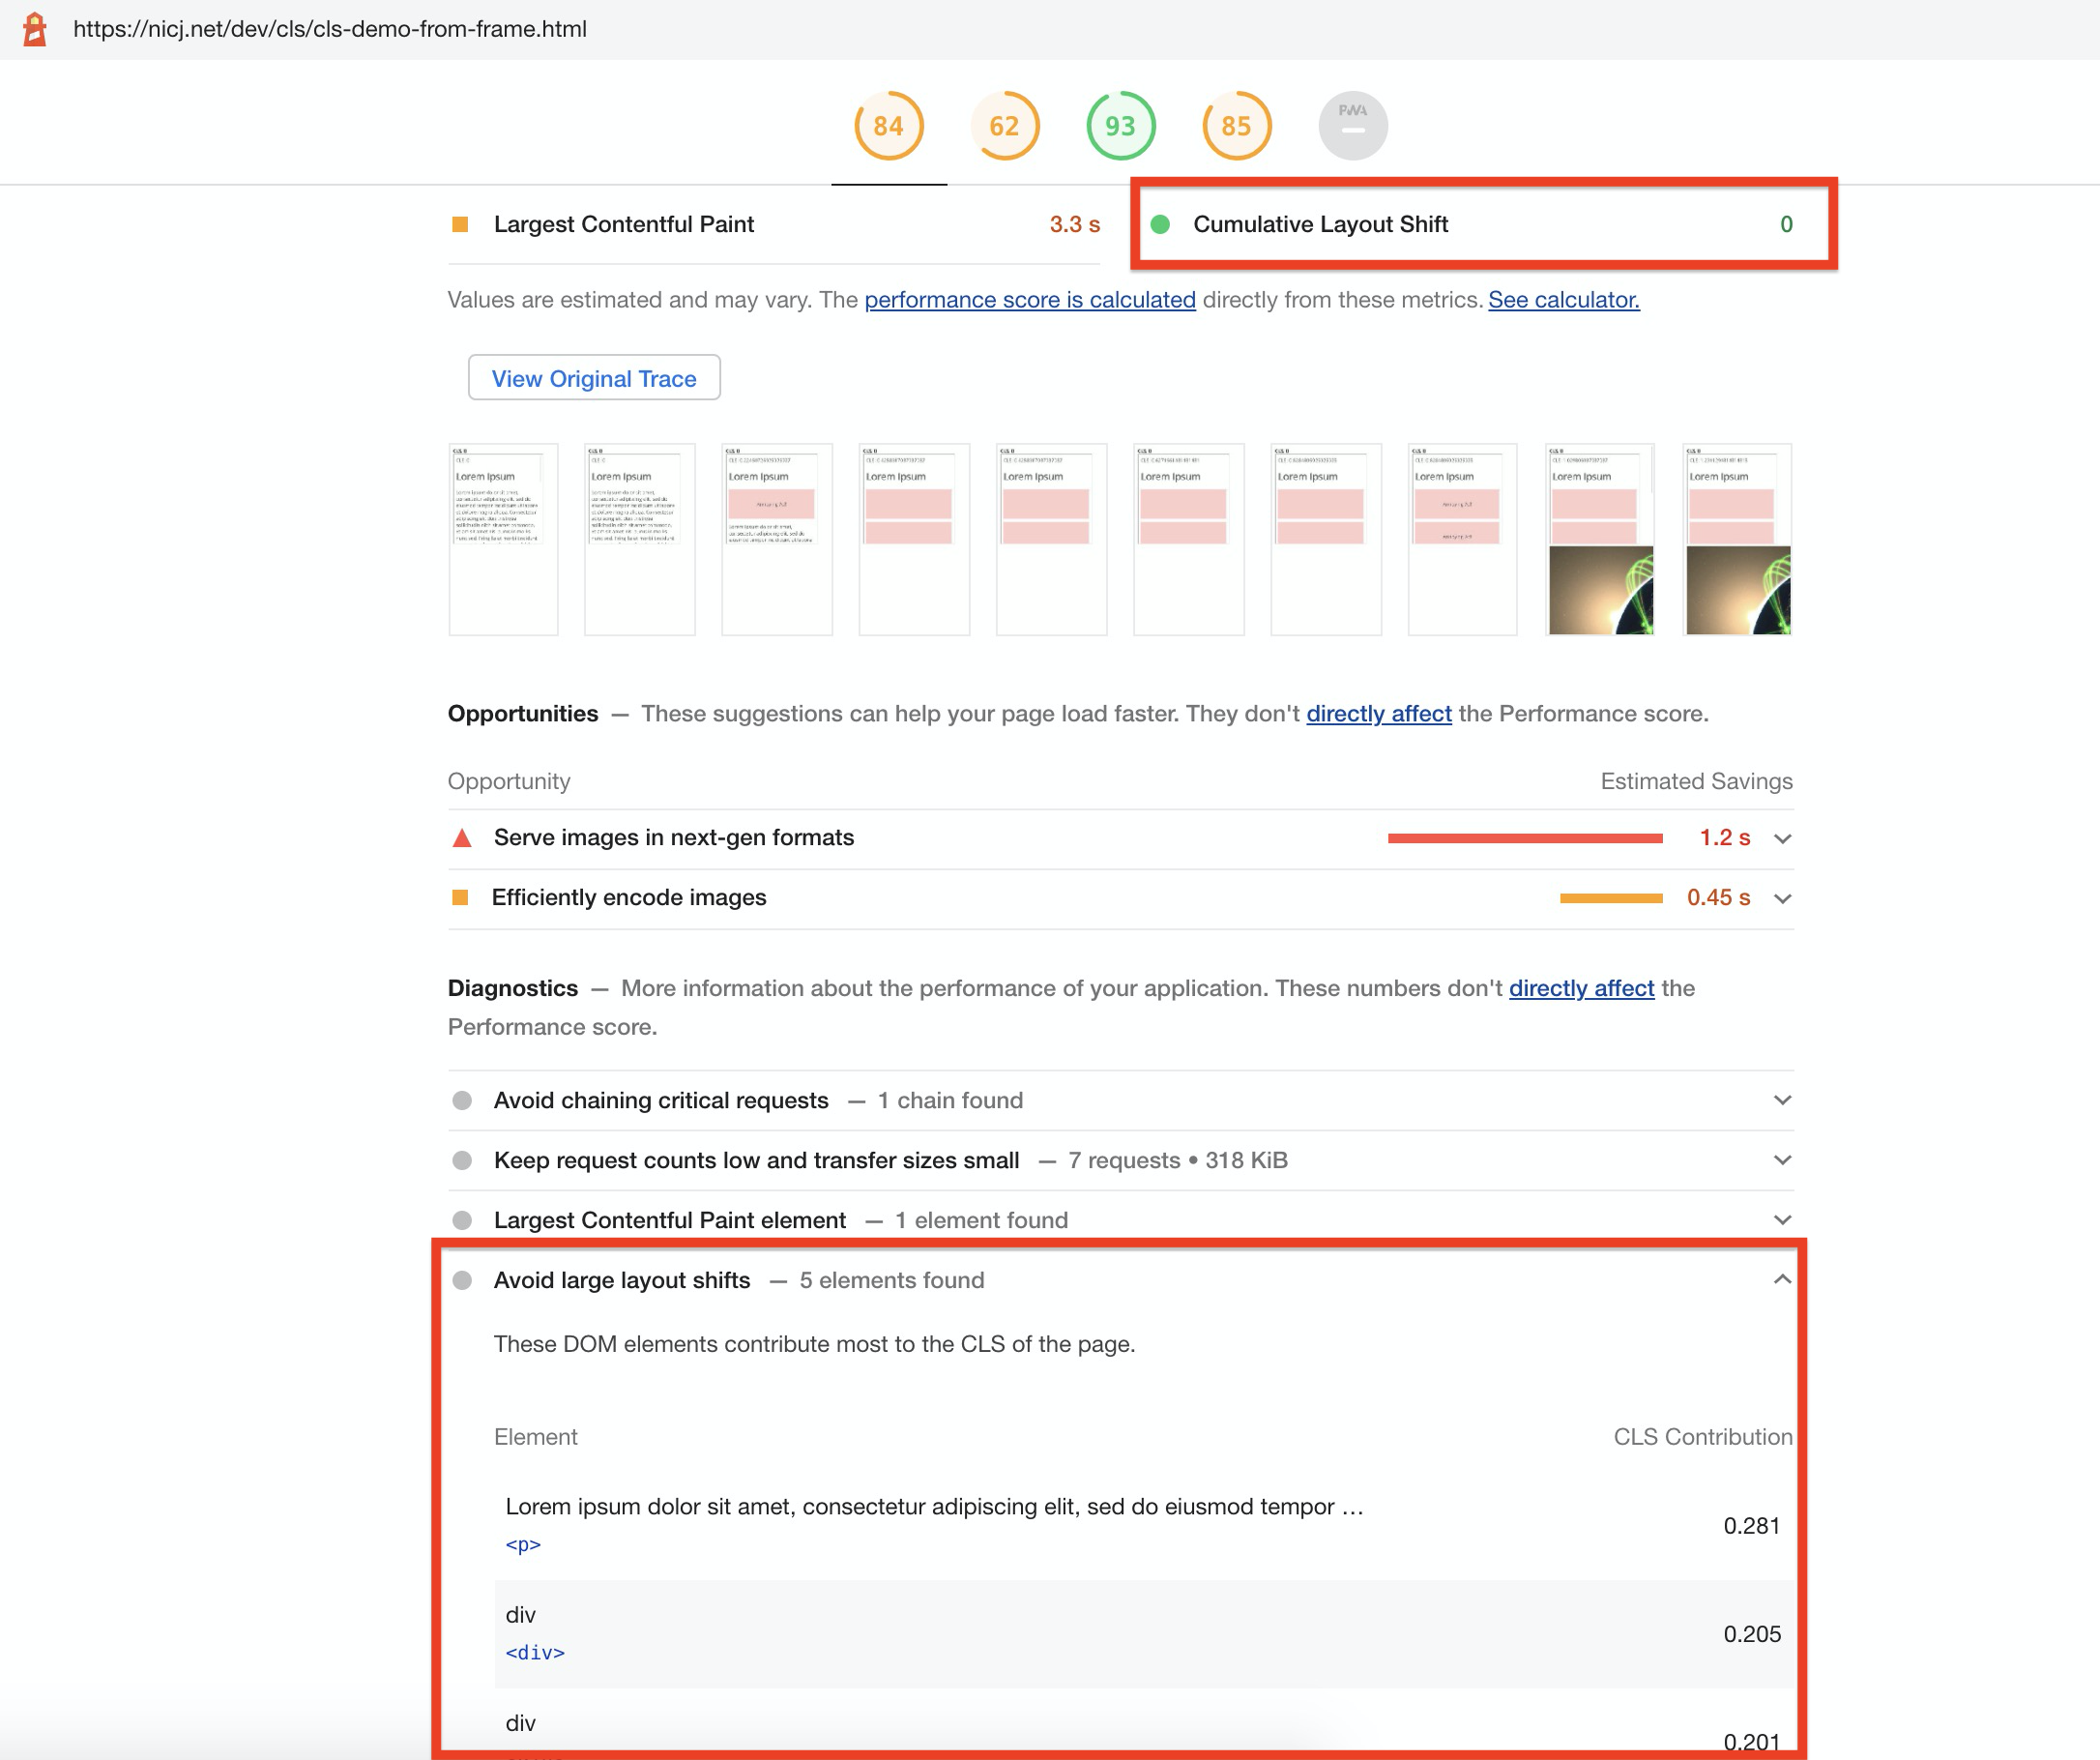
CLS in IFRAMEs in Dev Tools
  • All current RUM tools only track Layout Shifts in the top-level page, not accounting for any shifts from IFRAMEs
    • If they wanted to do this, they would need to crawl for all IFRAMEs and register PerformanceObservers for those
    • It’s hard to do this for dynamically added or removed IFRAMEs
    • This cannot be done for any cross-origin IFRAMEs due to frame restrictions
    • Here’s an issue discussing this discrepancy
  • On the other hand, Google’s Chrome User Experience (CrUX) report does factor in IFRAME layout shifts for CLS

As a result, if you have content shifting in IFRAMEs today, those might (or might-not) not be affecting your top-level Cumulative Layout Shift scores, depending on what data you’re looking at.

In the future, if Lighthouse and other synthetic tools are updated to include layout shifts from IFRAMEs, it is likely they will always differ from RUM CLS which cannot easily (or at all) get layout shifts from IFRAMEs.

We should strive to keep RUM CLS as close as possible to synthetic CLS, so I’ve filed an issue to try to get the same IFRAME details in RUM easily.

How to Improve It

This article won’t dive too deeply into how to improve a site’s CLS score, as there is already a lot of great content from other sources, such as Google’s Optimize Cumulative Layout Shift article on web.dev.

However, it’s important to take time to understand and investigate why your CLS score is the way it is before you try to fix or improve anything.

The first step of improving any performance metric is making sure you understand precisely how that metric is being measured. Whether you’re looking at synthetic or RUM data, make sure you understand how it’s being calculated and how much data the CLS value represents.

For example, make sure you know how much of the page’s lifetime layout shifts are being measured for, as it varies by tool.

If you’re looking at a CLS score from a synthetic test like Lighthouse or WebPagetest, you can probably get a trace, or breakdown, of the content that contributed to that score. From there, you can look for opportunities to improve.

CLS in Lighthouse

Remember, synthetic developer tools often just measure a single test case on your developer machine, and may not be representative of what your users are seeing across devices, browsers, screens and locations! Synthetic monitoring tools are useful for getting repeatable measurements from a lab-like environment, but won’t be representative of your real visitors.

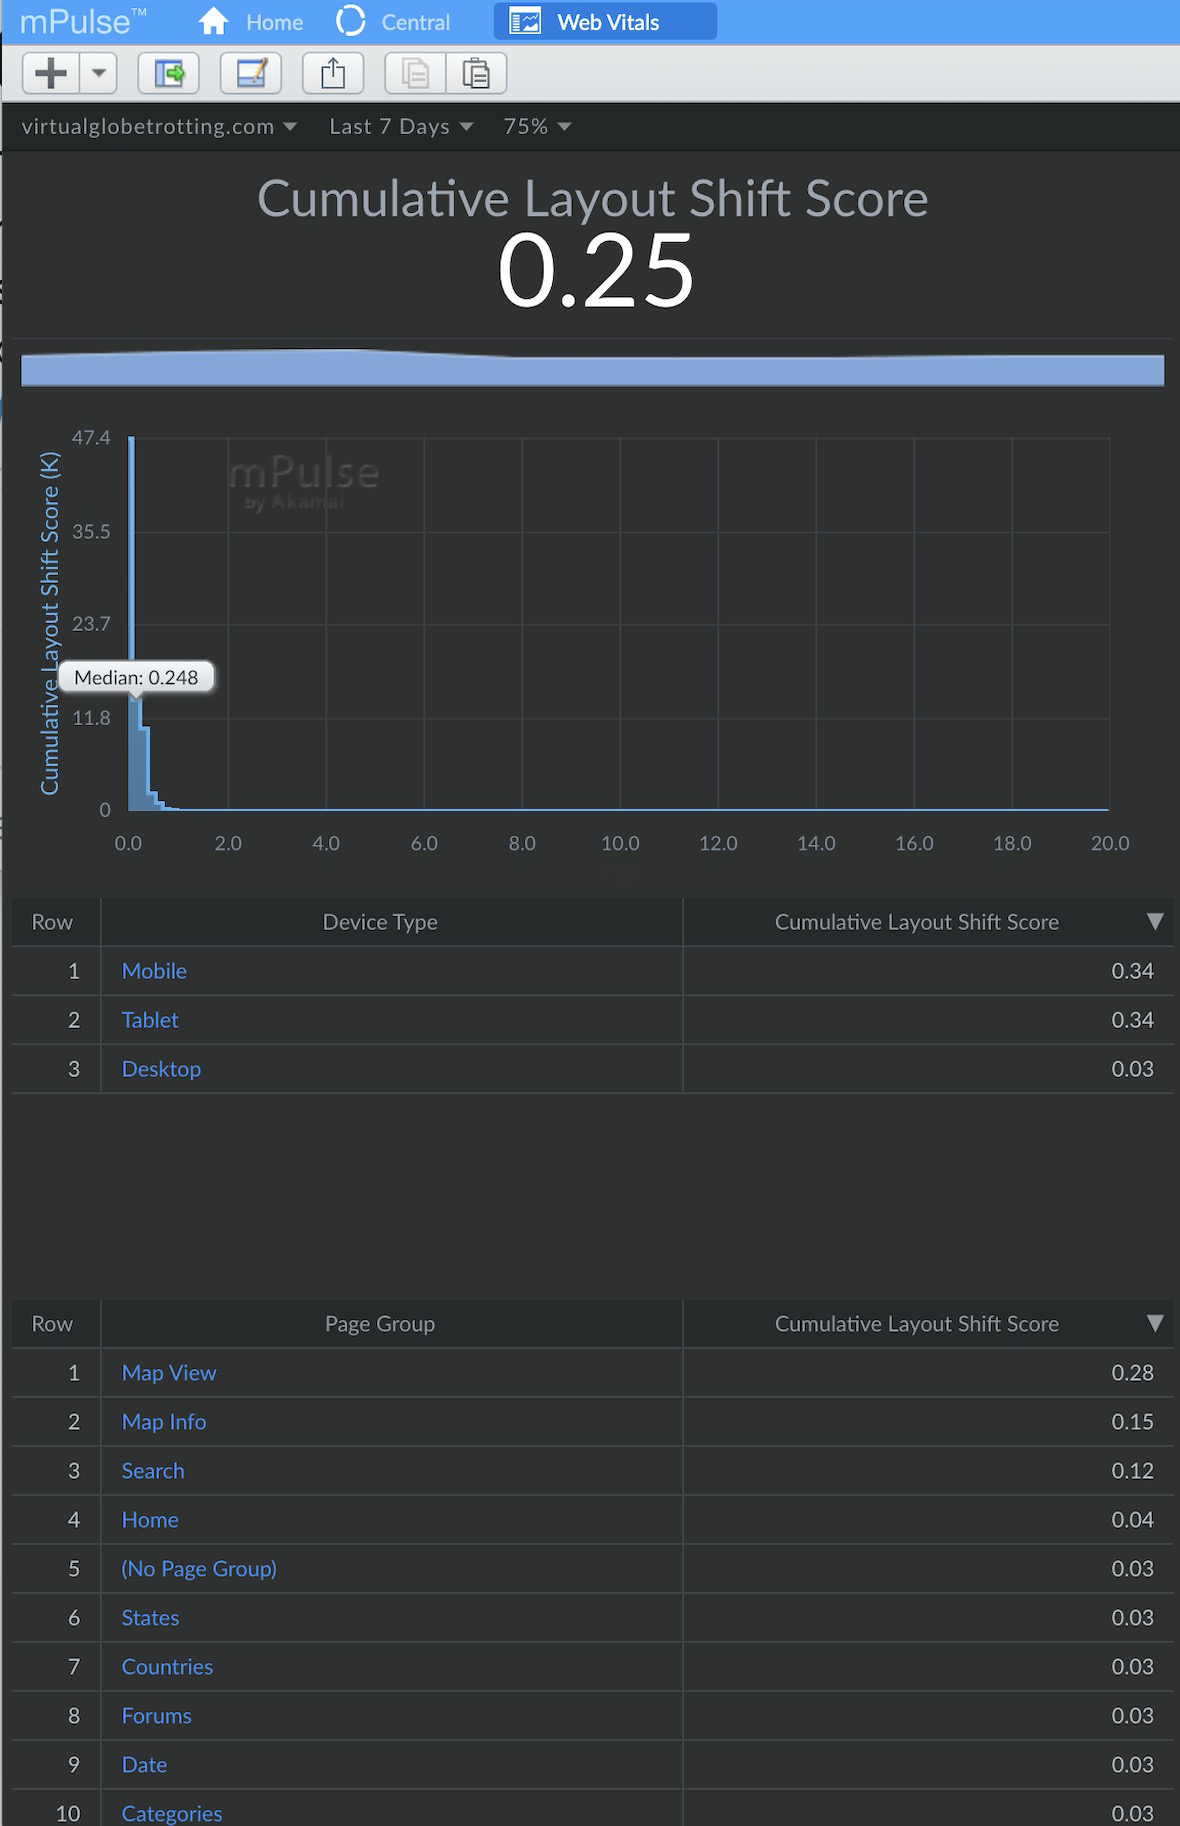
If you have RUM data, see if you can break down CLS by Page Group, Mobile/Desktop, and other dimensions to see which segments of your visitors are having the worst experiences.

CLS in RUM

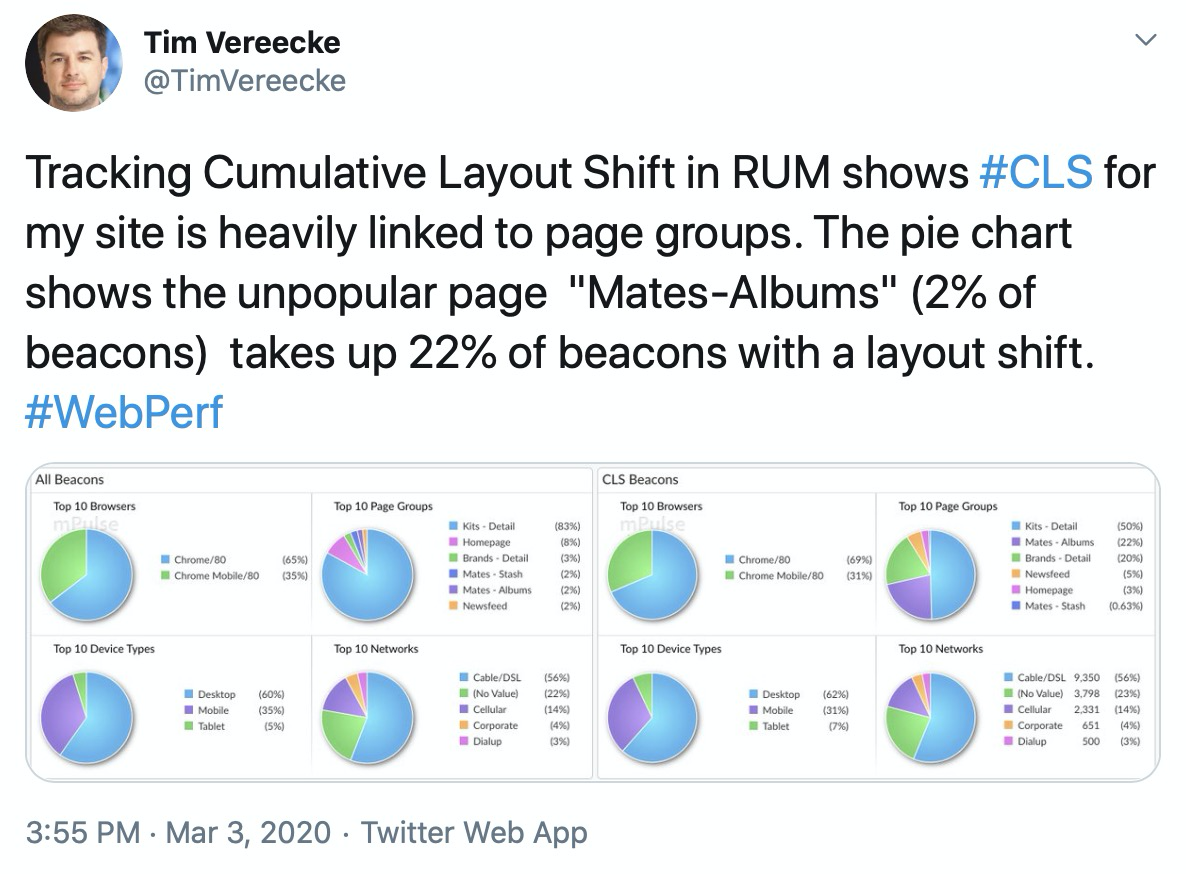
Intuitively, Cumulative Layout Shift scores may differ significantly for each page group (e.g. different types of pages such as Home, Product, or List pages) of a site.

Tim Vereecke confirms this is what he found for his site:

RUM Data Tweet

RUM data can also contain attribution that has details about which elements moved for each layout shift.

Once you’ve narrowed down the largest scenarios and population segments that are contributing to your CLS, you can use a local debugger or synthetic testing tools to try to reproduce the layout shifts.

From there, at a high-level, layout shifts occur when content is inserted above or at where the current viewport is.

Many times, this can be caused by:

  • Scroll bars needing to be added by additional content (which can reduce the width of the page, which can shift content to the left or down)
  • CSS animations
    • Use transform properties instead
  • Image sliders
    • Make sure you’re using transforms instead of changing dimension / placement properties
  • Ads
    • If possible, define dimensions ahead of time
  • Images without dimensions
  • Content that only gets included or initialized after the user scrolls to it
    • Add placeholders with the correct dimensions
  • Fonts
    • Unstyled fonts being drawn before the final font (which may have slightly different dimensions) can lead to layout shifts
    • font-display: swap in conjunction with a good matching font fallback can help

More details on the above fixes are on Google’s Optimize Cumulative Layout Shift page.

Taking a video as you load and interact with a page can highlight specific cases where CLS increases, and Chrome Developer Tools has an option to see which regions shifted in real-time.

One note is that a lot of today’s modern performance best practices may potentially have a negative effect on CLS, such as lazy-loading CSS, images, fonts, etc. When those components are loaded asynchronously, it’s possible for them to introduce layout shifts as they need to be drawn with the proper dimensions.

In other cases, websites that are tuning for performance may be exposing themselves to more layout shifts unintentionally. Besides lazy-loading, fast-loading sites optimize for a quick first-paint, to get something on-screen for the visitor’s eyes. As additional content comes in, it may be shifting the page around significantly, even though the user may think it’s possible for them to start interacting with the site.

That’s why it can be important to keep an eye on CLS every time major performance changes are being considered. There are always trade-offs between delivering content quickly and delivering it too quickly, where it will need to be shuffled around before the page has reached its final form.

How to Measure It

CLS can be measured synthetically (in the lab) or for real users (via RUM). Lab measurements may only capture layout shifts from a single or repeated Page Load experience, while RUM measurements will be more reflective of what real users see as they experience and interact with a site.

RUM

Cumulative Layout Shift can be measured via the browser’s Layout Instability API. This experimental API reports individual layout-shift entries to any registered PerformanceObserver on the page.

Each layout-shift entry represents an occurrence where an element in the viewport changes its starting position between two frames. An element simply changing its size or being added to the DOM for the first time won’t necessarily trigger a layout shift, if it doesn’t affect other visible DOM elements in the viewport.

Not all layout shifts are necessarily bad. For instance, if a user is interacting with the page, such as clicking a button in a Single Page App, they may be expecting the viewport to change. Each layout-shift event has a hadRecentInput flag that tells whether there was input within the last 500ms of the shift. If so, that layout shift can probably be excluded from the Cumulative Layout Shift score.

Inputs that trigger hadRecentInput are mousedown, keydown, and pointerdown. Simple mousemove and pointermove events and scrolls are not counted.

How long should layout shifts be added to the Cumulative Layout Shift score? That depends on how much of the user experience you’re trying to measure.

See When does it End? for more details.

Example Code

There are many open-source libraries that capture CLS today, such as Boomerang or the web-vitals library.

See the open-source RUM section for more examples.

If you want to experiment with the raw layout shifts via the Layout Instability API, the first thing is to create a PerformanceObserver:

var clsScore = 0;

try {
  var po = new PerformanceObserver(function(list) {
    var entries = list.getEntries();
    for (var i = 0; i < entries.length; i++) {
      if (!entries[i].hadRecentInput) {
        clsScore += entries[i].value;
      }
    }
  });

  po.observe({type: 'layout-shift', buffered: true});
} catch (e) {
  // not supported
}

buffered:true is used to gather any layout-shifts that occurred before the PerformanceObserver was initialized. This is especially useful for scripts, libraries, or third-party analytics that load asynchronously on the page.

Each callback to the above PerformanceObserver will have a list of entries, via list.getEntries().

Each entry is a LayoutShift object:

LayoutShift Object

Here are its attributes:

  • duration will always be 0
  • entryType will always be layout-shift
  • hadRecentInput is whether there was user input in the last 500ms
  • lastInputTime is the time of the most recent input
  • name should be layout-shift (though Chrome appears to currently put the empty string "")
  • sources is a sampling of attribution for what caused the layout shift (see attribution below)
  • startTime is the high resolution timestamp when the shift occurred
  • value is the layout shift contribution (see definition above)

If you’re just interested in calculating the Cumulative Layout Score, you can add the value of each layout-shift as long as it doesn’t have hadRecentInput set.

For more details on the shifts, you could capture the sources to see top contributors.

There are a few edge-cases to be aware of, so it’s best to look at one of the example libraries for details.

If you want to browse the web and watch CLS entries as they happen live, you can try this simple script for Tampermonkey, or the Web Vitals Chrome Extension.

Attribution

So, your site has a CLS score of 0.3. Great!? Now what?

You probably want to know why. Besides the raw value that each layout-shift generates, it has a sources attribute that can give an indication of the top elements that shifted.

The sources attribute of the layout-shift entry is sampling of up to five DOM elements whose layout shifts most substantially contributed to the layout shift value:

LayoutShift Object

Note sources are the elements that shifted, not necessarily the element(s) that caused the shift. For example, an element that is inserted above the current viewport could cause elements within the viewport to shift (and contribute to the CLS score), though the inserted element itself may not be in the sources list.

Attribution via sources is only available in Chrome 84+.

Fallbacks

Unfortunately, it would be challenging to measure Layout Shifts without the Layout Instability API, which today is only supported in Blink-based browsers.

Theoretically, a polyfill might be able to calculate the placement and dimensions of every element within the viewport every frame and how they change… seems like that would be rather inefficient to do in JavaScript.

Maybe someone will prove me wrong!

For now, it’s best to capture CLS via browsers that support the Layout Instability API and use other spot checks to make sure other browsers have similar layout behavior.

Browser Support

CanIUse.com tracks browser support for the Layout Instability API.

As of 2020-10, only Blink-based browsers support it, which is about 69% of global market share:

  • Chrome 77+
  • Opera
  • Edge 80+ (based on Chromium — no support in EdgeHTML)

Note that Chrome has done a great job documenting any changes they’ve made to the Layout Instability API or CLS measurement.

Based on recent feedback to the Layout Instability GitHub Issues Page it seems that Mozilla engineers are reviewing the specification (but have not yet shown a public commitment to implementing it).

Gotchas

When measuring and reporting on Cumulative Layout Shift, there are a lot of gotchas and caveats to understand:

  • Layout Shifts are affected by the viewport and size of the viewport. Only content that is within the viewport is visible. Shifts that happen below the fold will have no effect on Cumulative Layout Shift:
CLS in boomerang.js
  • Layout Shifts may happen more frequently on mobile vs. desktop due to responsive layouts that are more vertical, with a lot of dynamically added content from scrolling. When analyzing CLS data, investigate Desktop and Mobile layouts separately.
  • The point at which you “stop” accumulating layout shifts into the Cumulative Layout Shift score matters, and different measurement tools may stop at different points. See the When does it End? section for more details.
  • There are bugs (with developer tools) and inconsistencies (between synthetic and RUM) with measuring layout shifts happening in IFRAMEs.
  • There are some known canonical cases that might provide high CLS values but still present a good user experience. For example, some types of image carousels (not using transform) might cause a large shift every time the image changes.
  • CLS can’t distinguish elements that don’t paint any content (but have non-zero fixed size), see this discussion.
  • Anytime there’s a new performance metric, there will be places it breaks down or doesn’t work well. It’s useful to browse (and possibly subscribe) to the Layout Instability’s Issue Page if you’re interested in this metric.

Open-Source / Free RUM

Cumulative Layout Shift is already supported in many popular open-source JavaScript libraries:

boomerang.js

boomerang.js is an open-source performance monitoring JavaScript library. (I am one of its authors).

It has support for Cumulative Layout Shift, which was added as part of the Continuity plugin in version 1.700.0.

CLS is measured up to the point the beacon is sent. For traditional apps, this is right after the onload event. For Single Page Apps (SPAs), CLS is measured up to the SPA Hard beacon is sent, which can include dynamically loaded content. CLS is also measured for each SPA Soft navigation.

CLS in boomerang.js
perfume.js

perfume.js is an open-source web performance monitoring JavaScript library that reports field data back to your favorite analytics tool.

Perfume added support for Cumulative Layout Shift in version 4.8.0.

Perfume is measured up to two points: when First Input Delay happens (as cls), and when the page’s lifecycle state changes to hidden (as clsFinal).

CLS in perfume.js
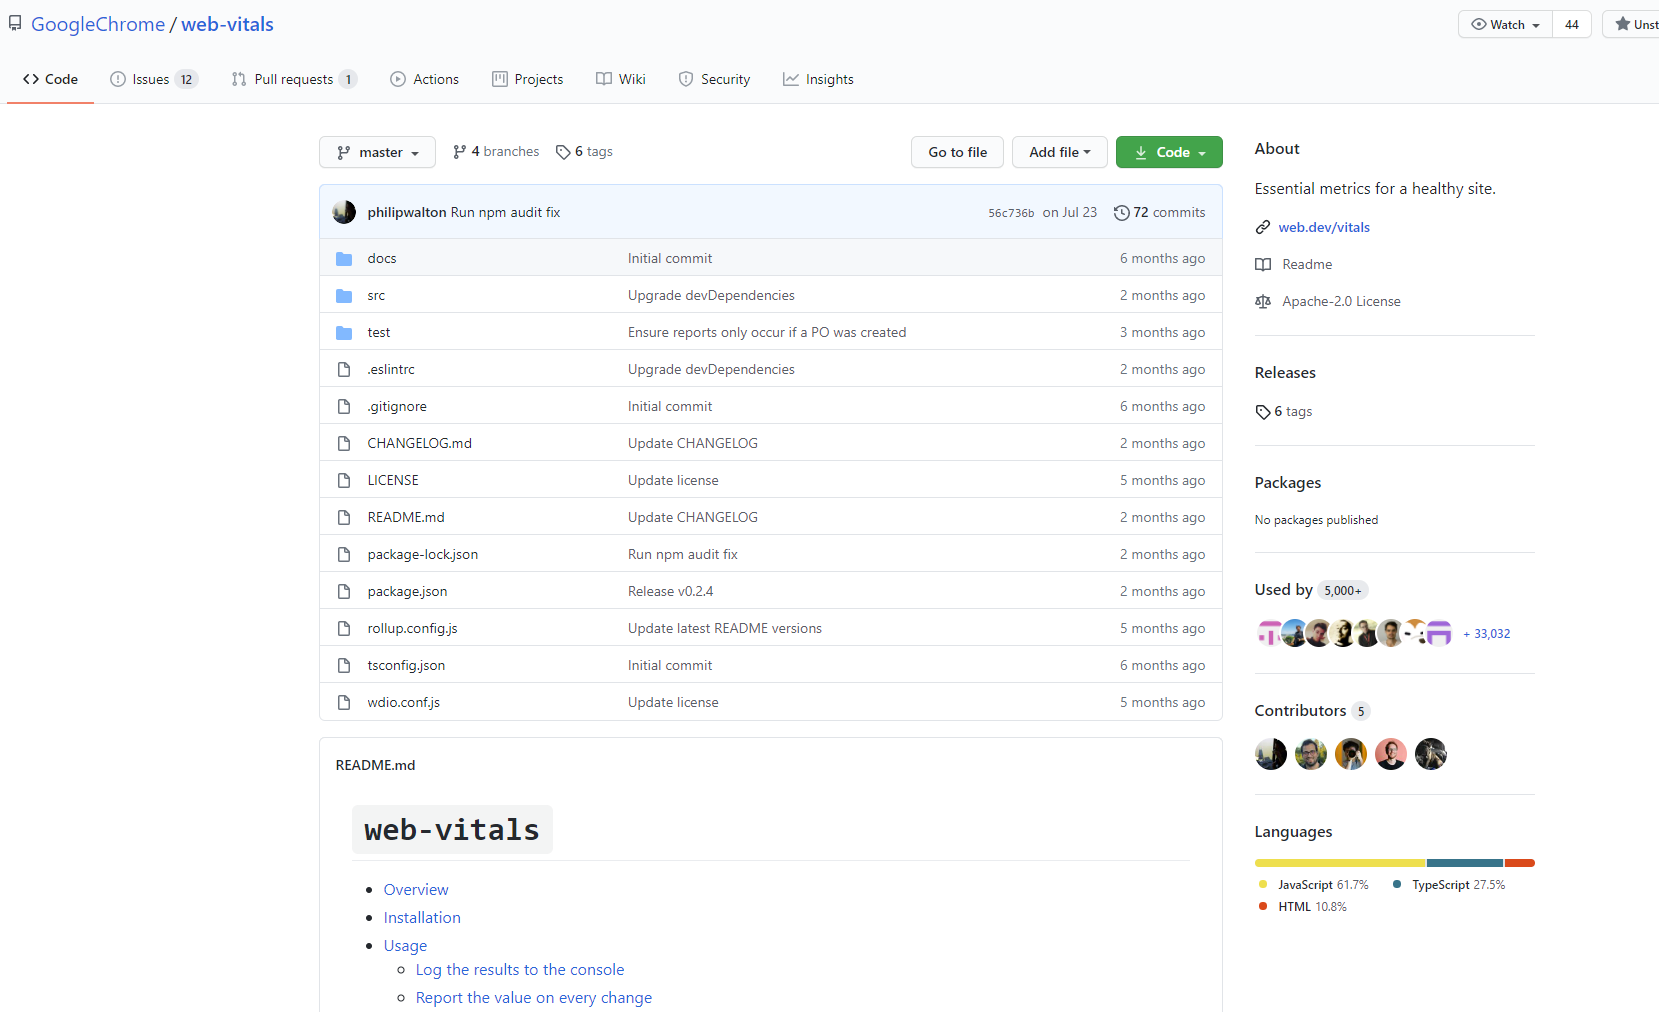
web-vitals from Google

Google’s official web-vitals open-source JavaScript library measures all of Google’s Web Vitals metrics, in a way that accurately matches how they’re measured by Chrome and reported to other Google tools.

web-vitals can measure CLS throughout the page load process, and will also report CLS as the page is being unloaded or backgrounded.

CLS in Web Vitals
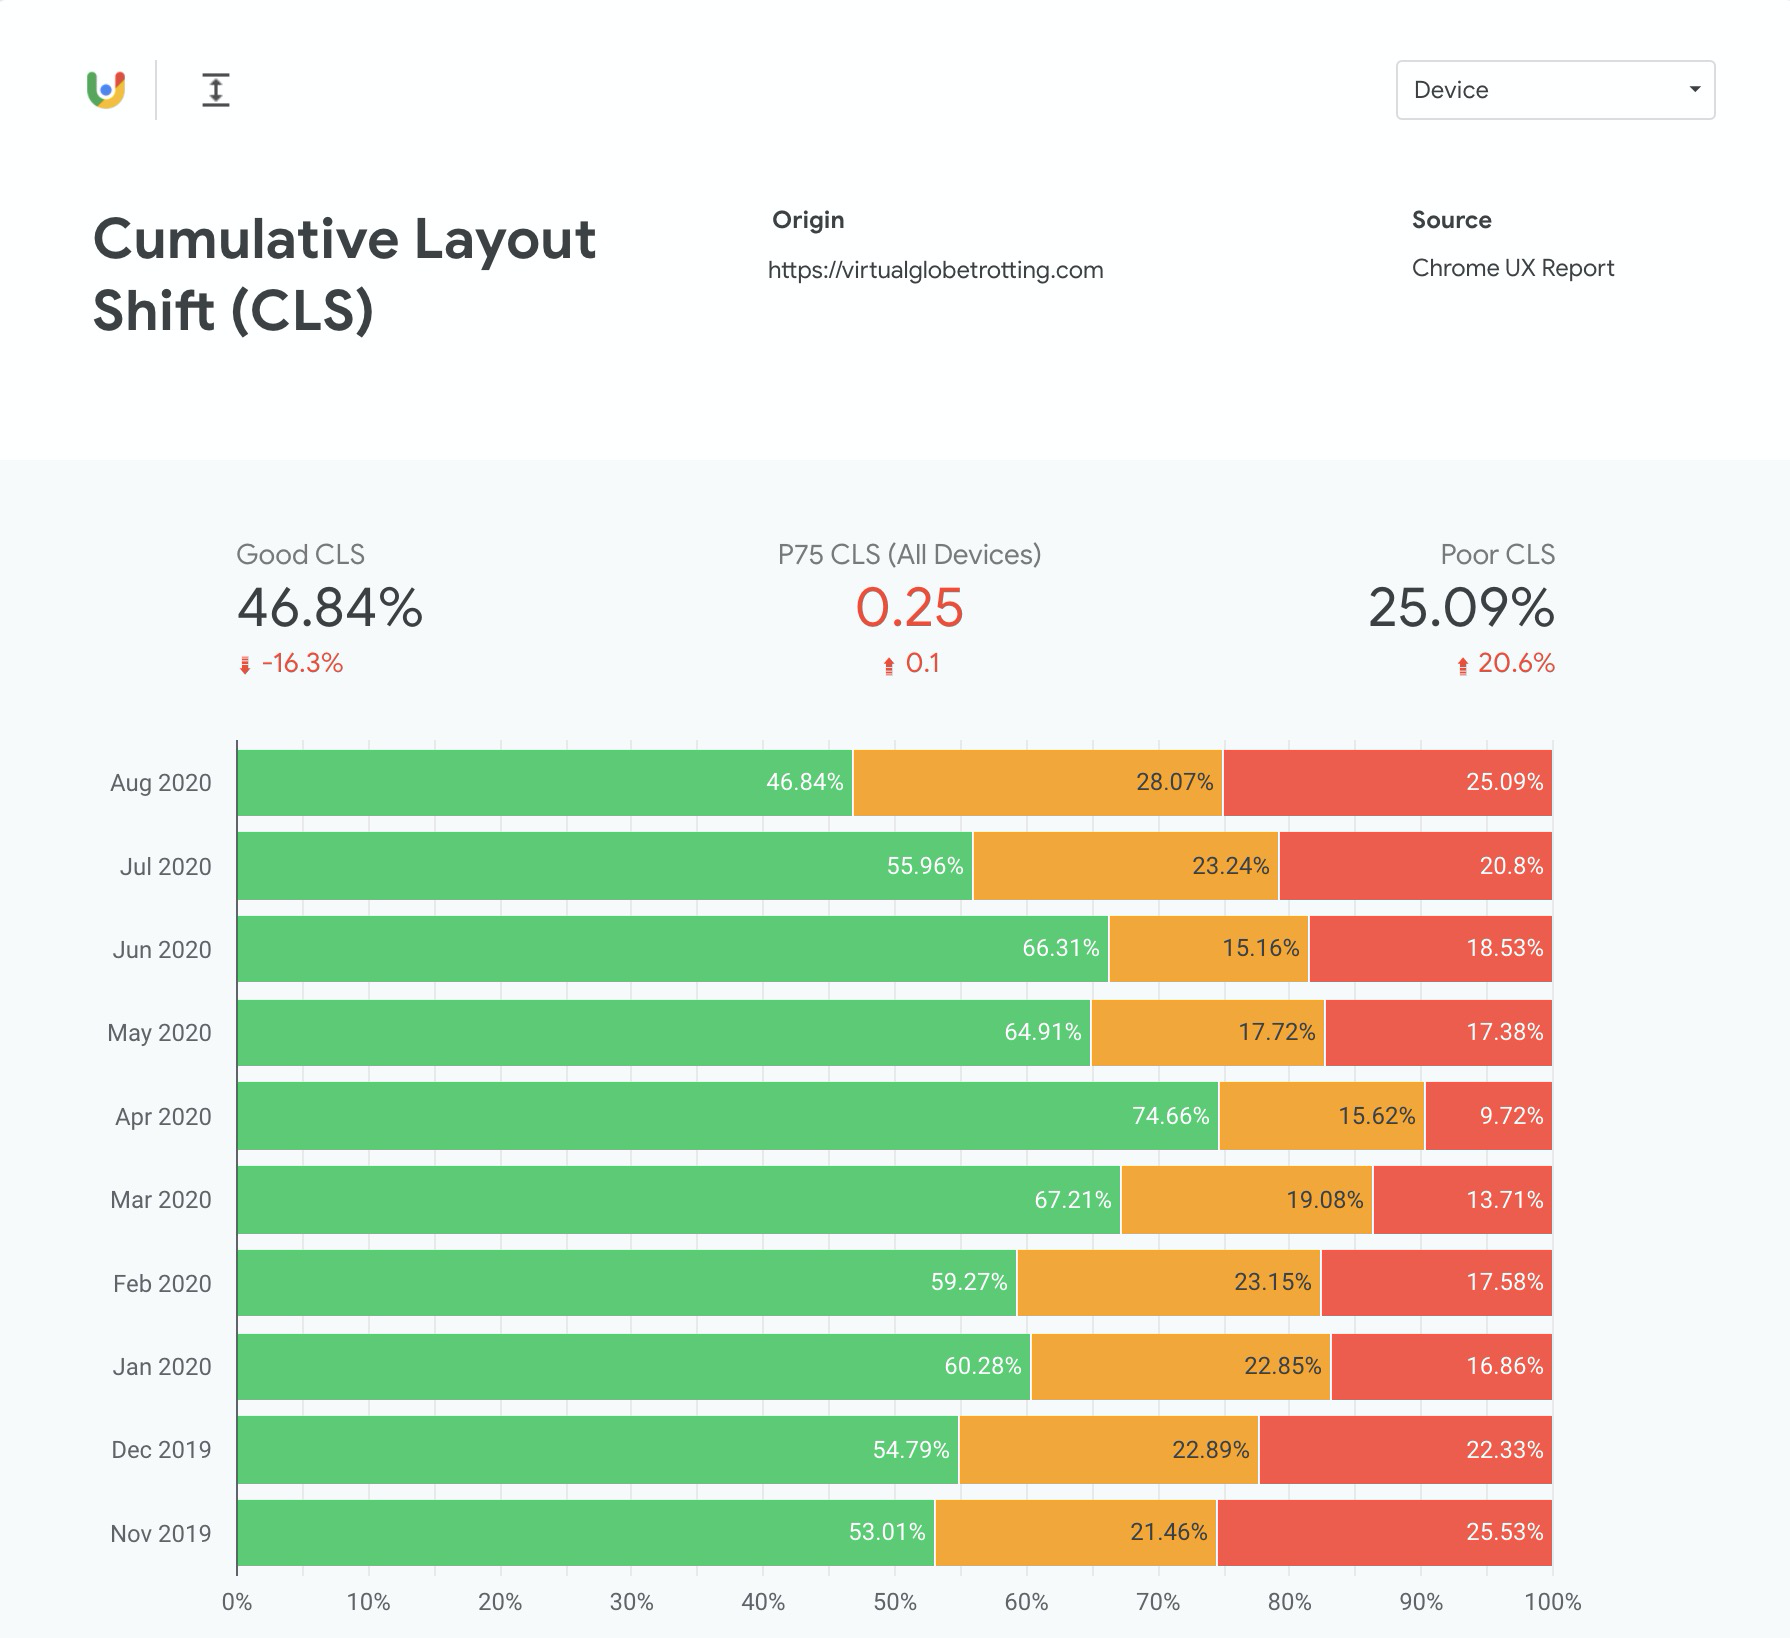
CrUX

The Chrome User Experience (CrUX) Report provides real-user monitoring (RUM) data for Chrome users as they navigate across the web.

Its data is available via PageSpeed Insights and in raw form via the Public Google Big Query Project. It’s data is also used in Google Search Console’s Core Web Vitals report.

If you’re interested in setting up a CrUX report for your own domain, you can follow this guide.

CrUX always reports on the last 28 days of data.

CLS in CrUX

Commercial RUM

Commercial Real User Monitoring (RUM) providers measure the experiences of real-world page loads. They can aggregate millions (or billions) of page loads into dashboards where you can slice and dice the data.

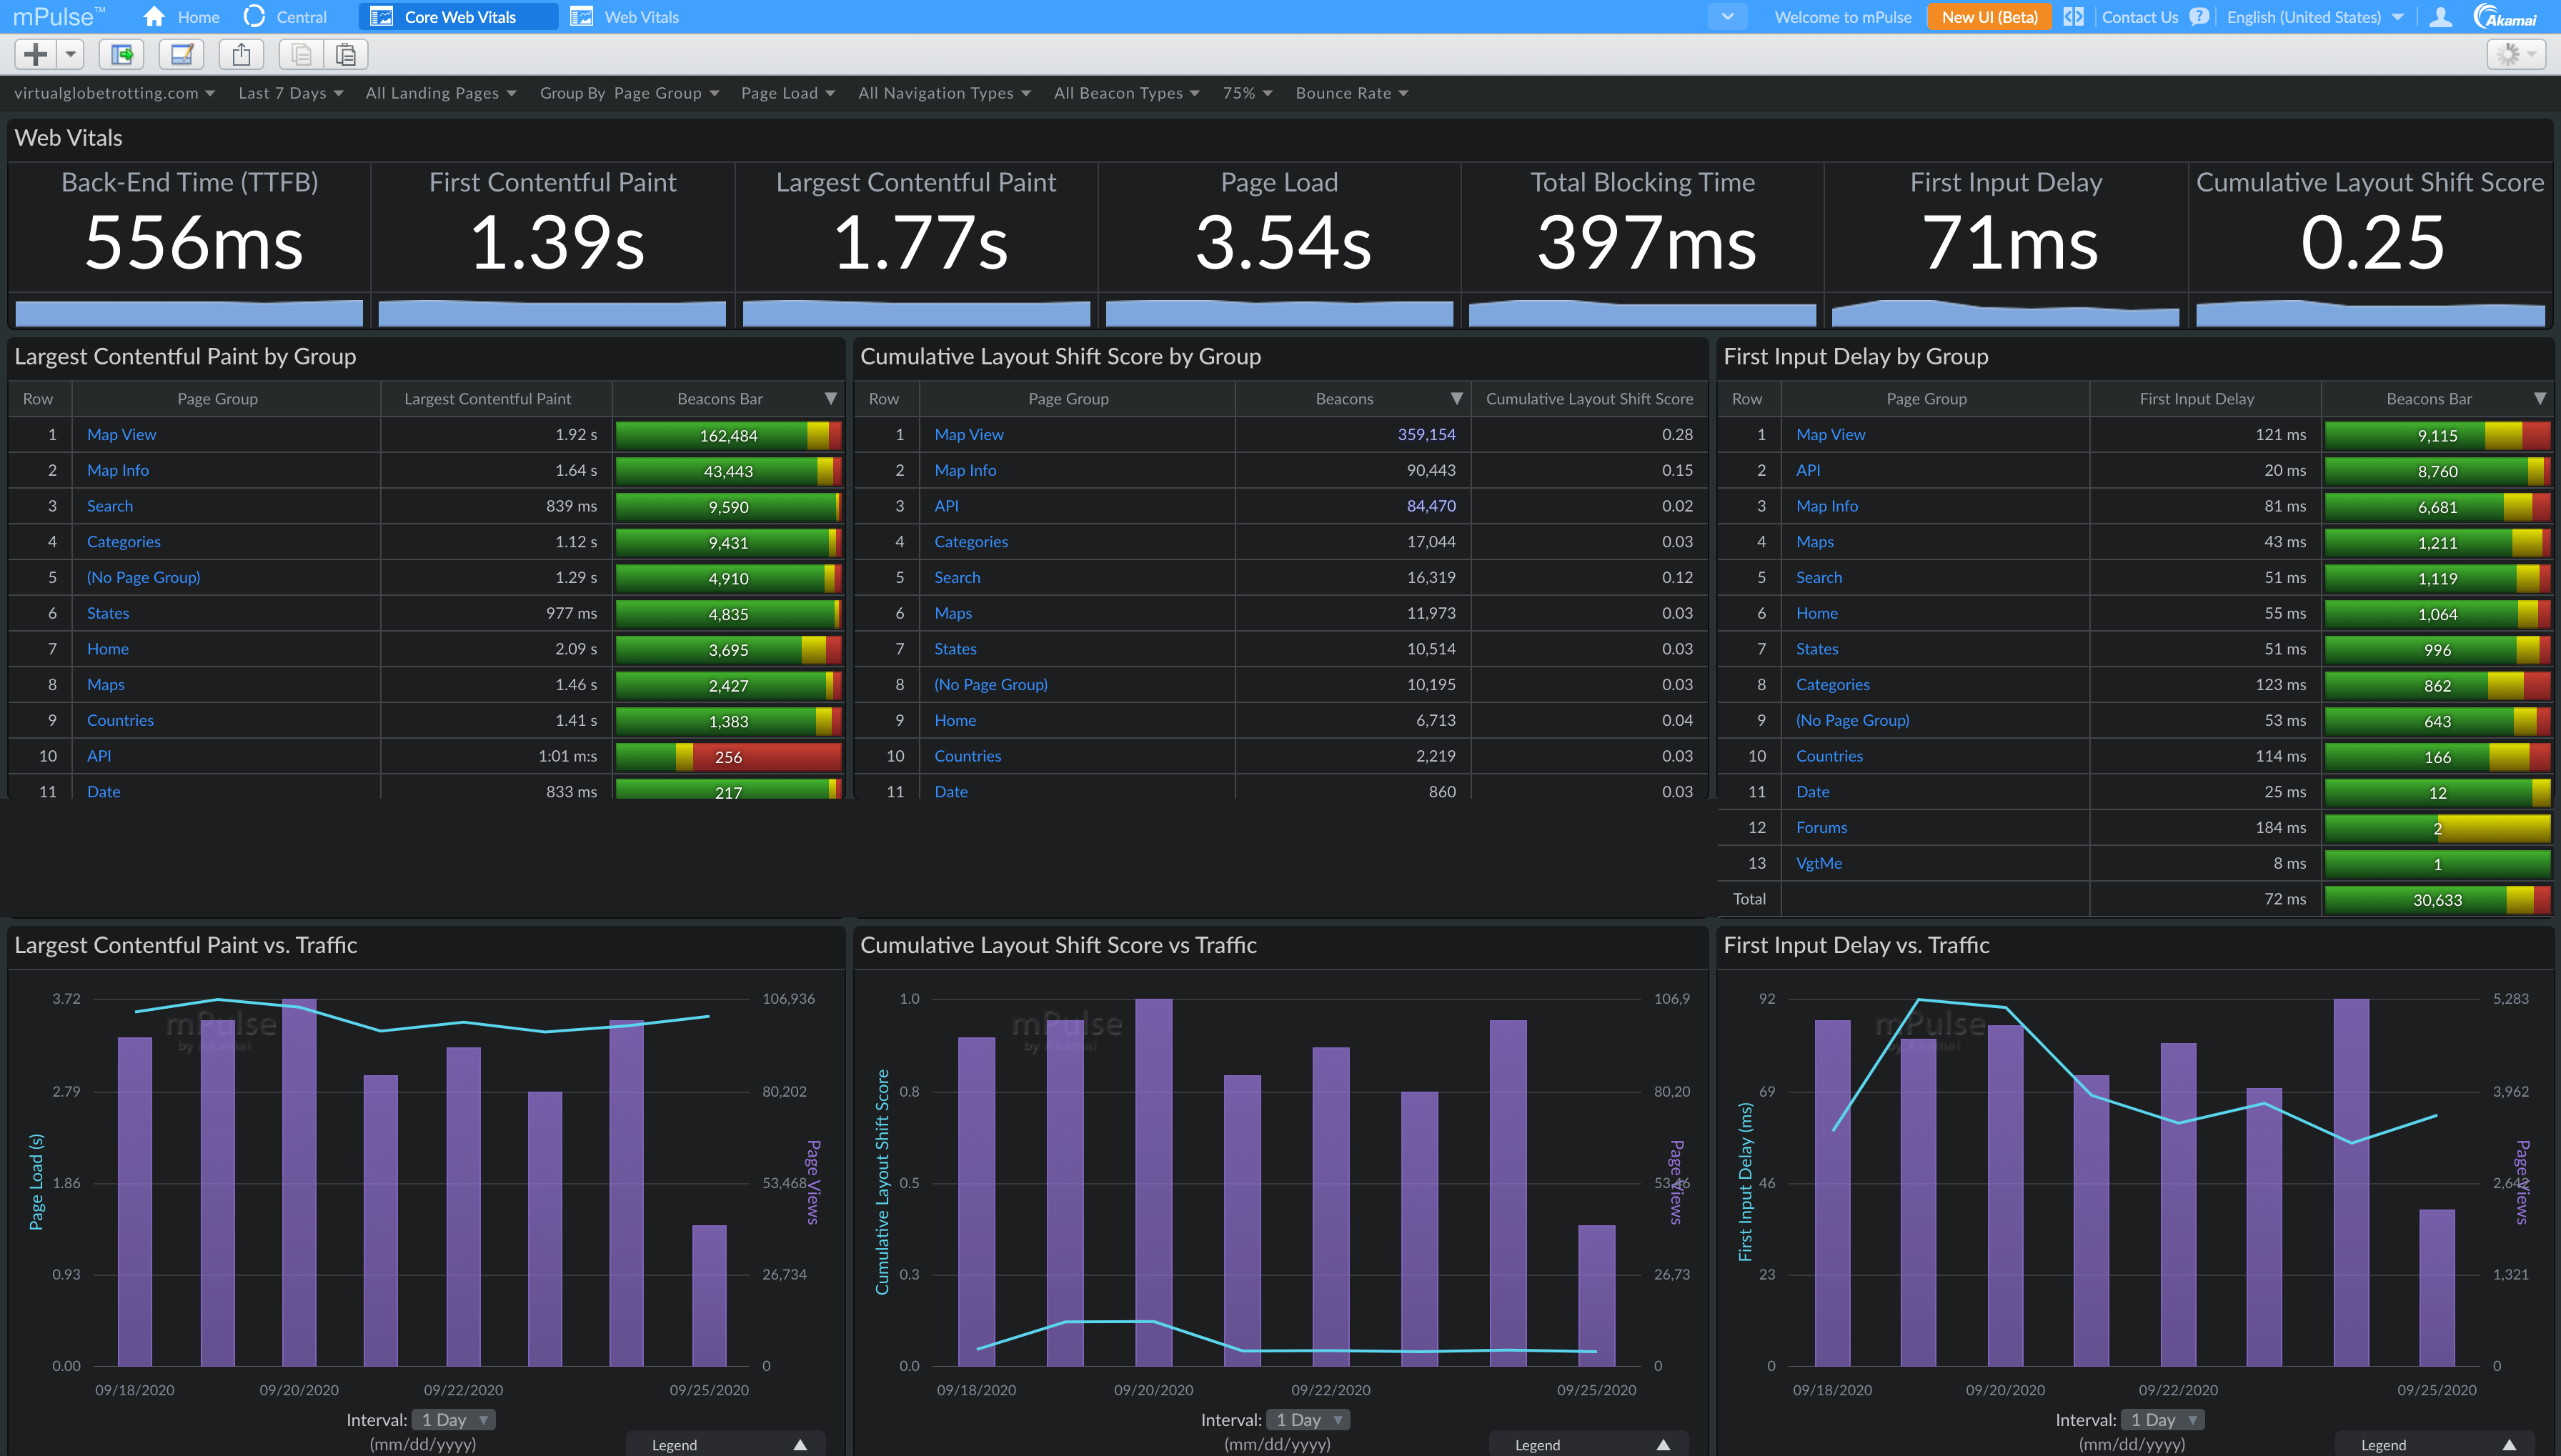
Akamai mPulse

Akamai mPulse (which I work on) has added full support for Cumulative Layout Shift (and other Web Vitals):

CLS in mPulse
SpeedCurve’s LUX

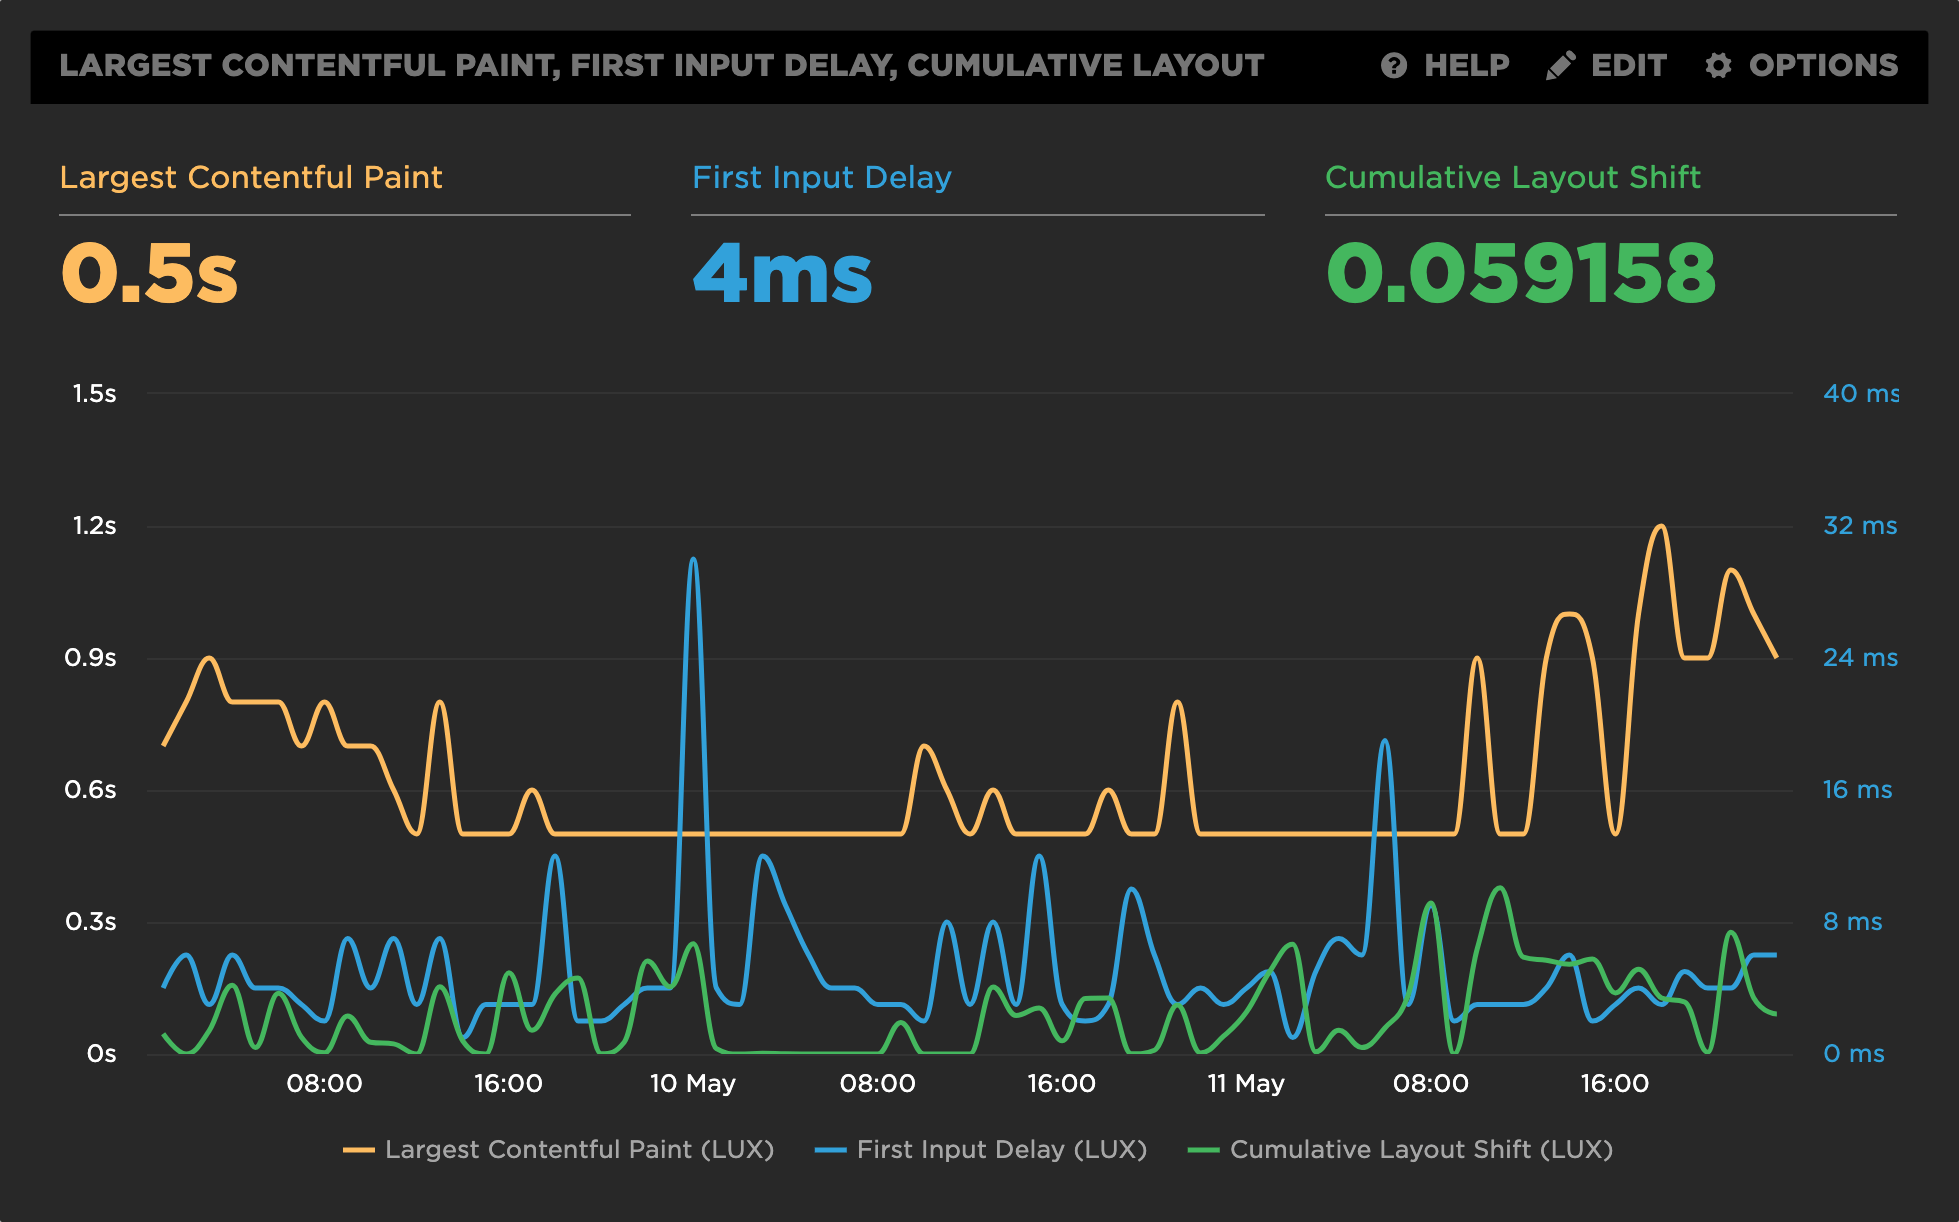
SpeedCurve‘s LUX RUM tool has full support for Web Vitals, including CLS:

CLS in SpeedCurve
New Relic Browser

New Relic Browser is New Relic’s RUM monitoring, and has added support for Cumulative Layout Shift in Browser Agent v1177.

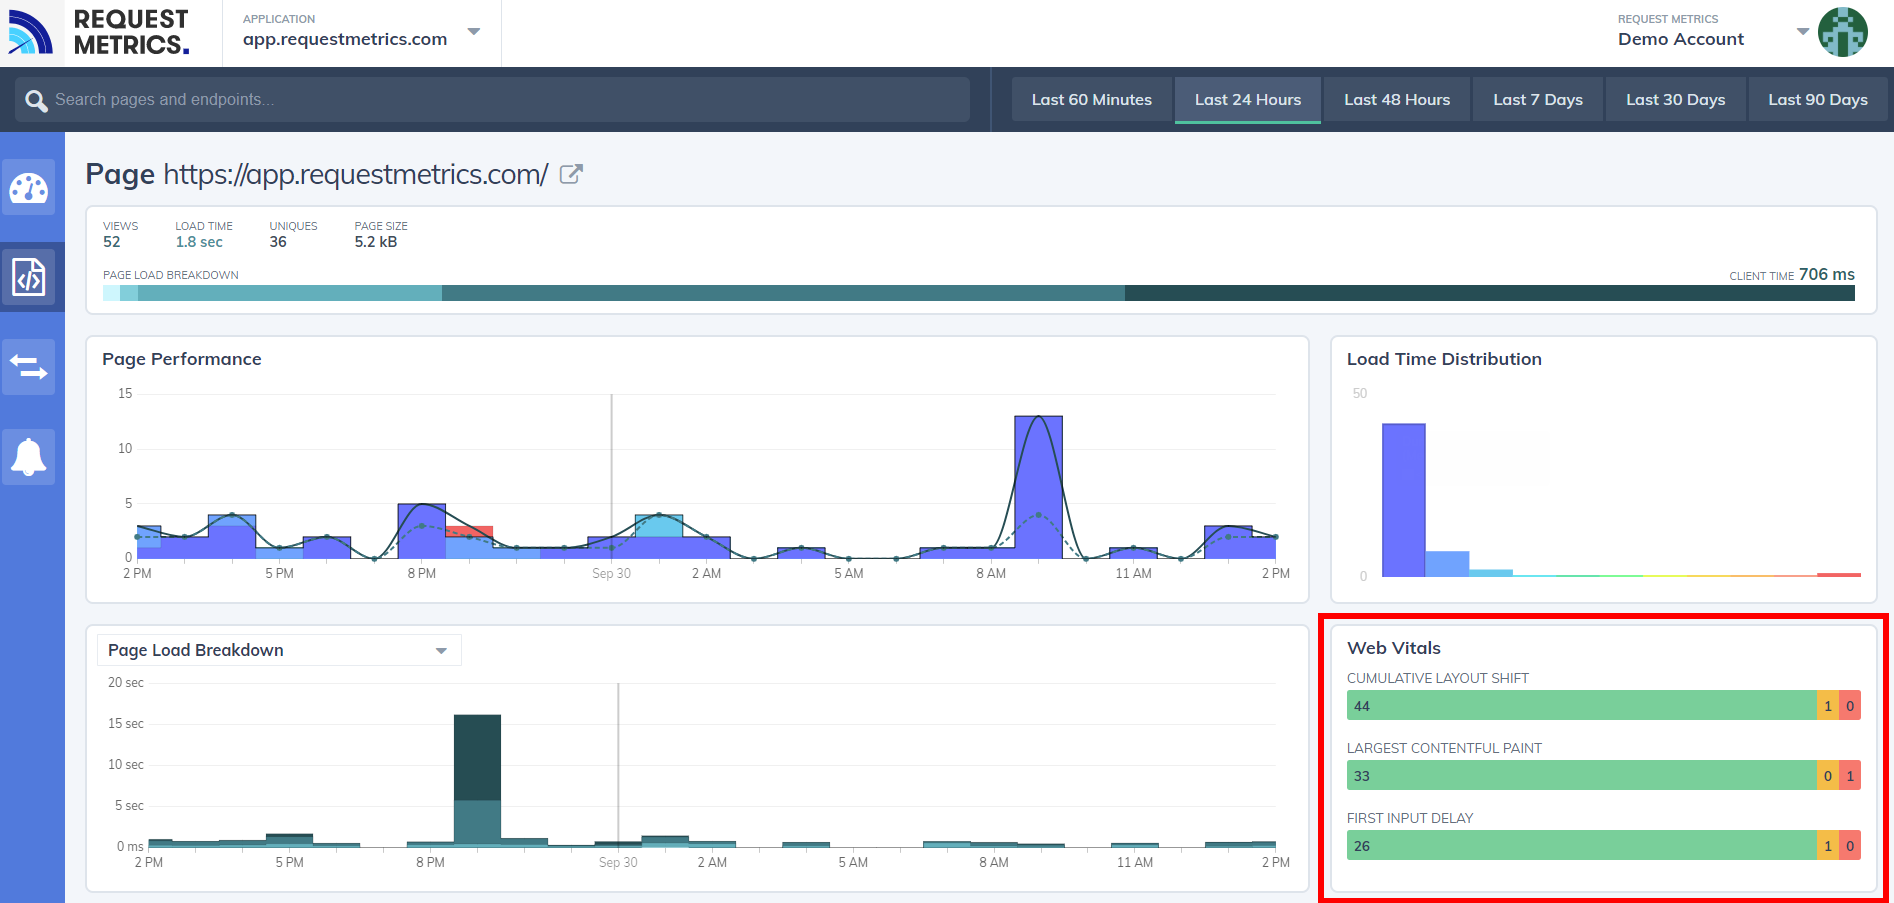
RequestMetrics

RequestMetrics provides website performance monitoring and has support for Web Vitals:

CLS in RequestMetrics

Synthetic

Synthetic tests are run in a lab-like environment or on developer machines. In general, synthetic tests allow for repeated testing of a URL in a consistent environment.

Synthetic developer tools take traces of individual page loads, and are fantastic for diving into and fixing CLS scores.

Synthetic monitoring tools help measure and monitor a URL (or set of URLs) over time, to ensure performance metrics don’t regress.

Free Synthetic Developer Tools

The following free synthetic developer tools can help you dive into individual URLs to understand what is causing layout shifts and how to fix them.

Chrome Developer Tools and Lighthouse

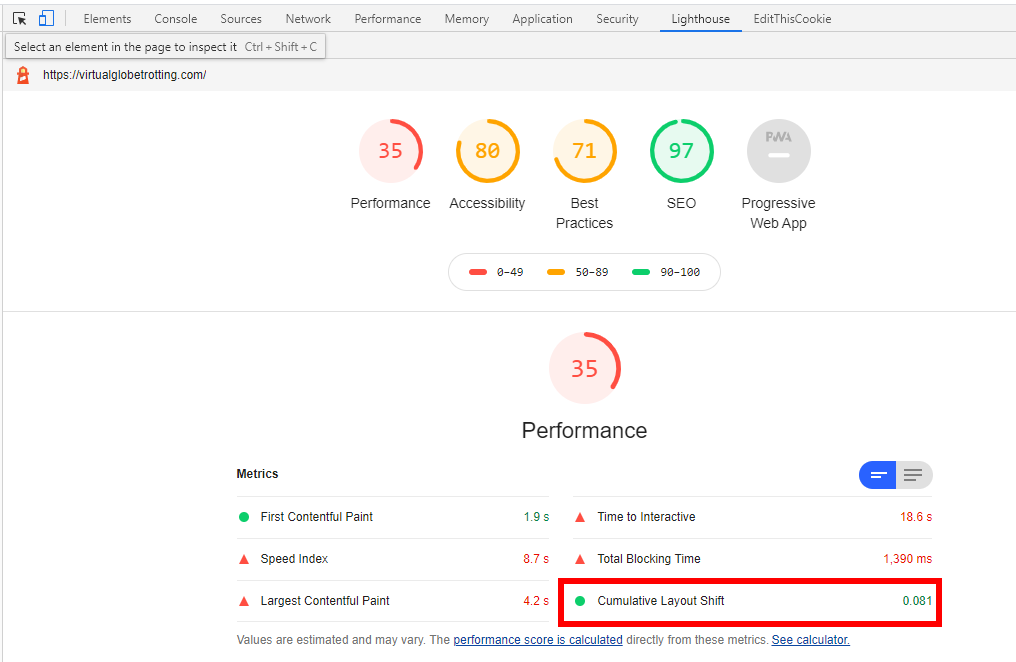
Chrome Developer Tools (and the Lighthouse browser extension/CLI) provide a wealth of information about Cumulative Layout Shift and the individual layout shifts that go into the score.

Within the Chrome Developer Tools, you have access to Lighthouse performance audits. Head to the Lighthouse tab, and run a Performance Audit:

CLS in Chrome Developer Tools

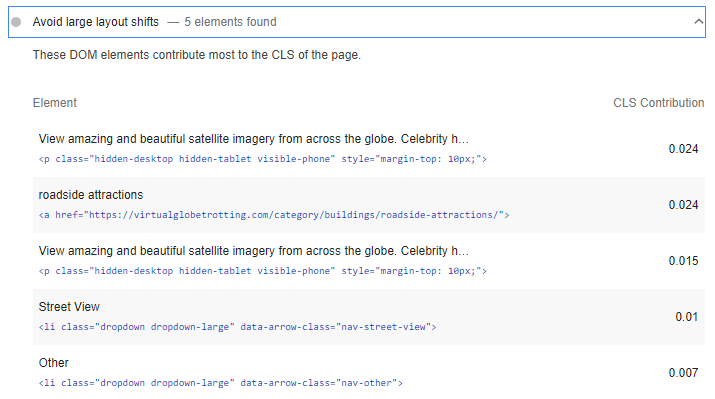
In addition to the top-level Cumulative Layout Shift score, you can get a breakdown of the contributing layout shifts:

CLS in Chrome Developer Tools - Contributions

(Note there’s a bug where IFRAME shifts aren’t accounted for in the score but are shown in the breakdown)

If you click on View Original Trace in the Audit, it will automatically open the Performance tab:

CLS in Chrome Developer Tools - Performance Tab

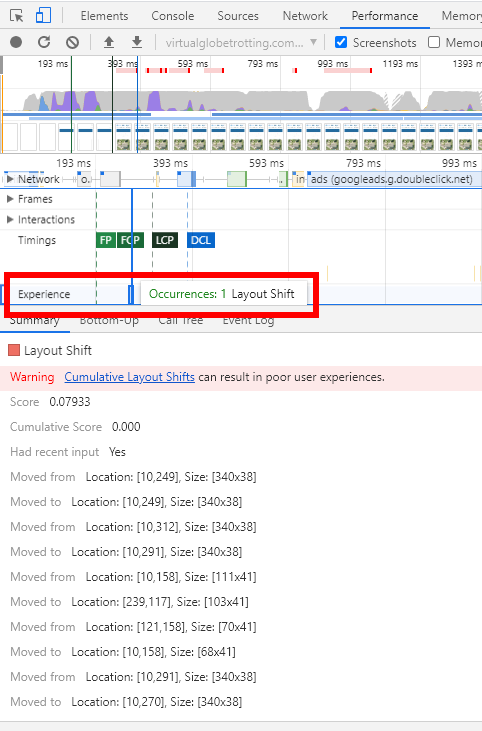
Within the Performance tab, there is now a new Experience row in the timeline that highlights individual layout shifts and their details:

CLS in Chrome Developer Tools - Experience Row

Outside of taking a trace, you can browse while getting visual indicators that layout shifts are happening.

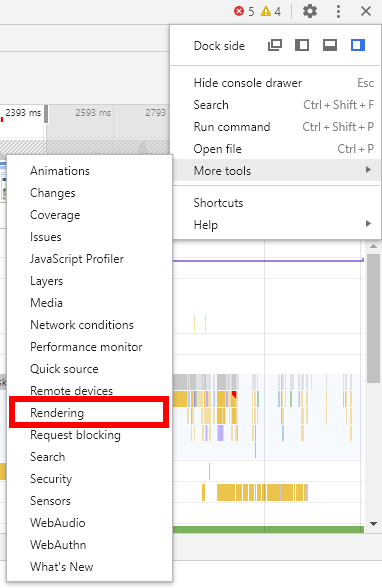
To do this, open the Rendering option in More Tools:

CLS in Chrome Developer Tools - Rendering Options

Then enable Layout Shift Regions:

CLS in Chrome Developer Tools - Layout Shift Regions

And when you browse, you’ll see light-blue highlights of content that had layout shifts:

CLS in Chrome Developer Tools - Highlights

All of these tools can be used to help find, fix, and verify layout shifts.

PageSpeed Insights

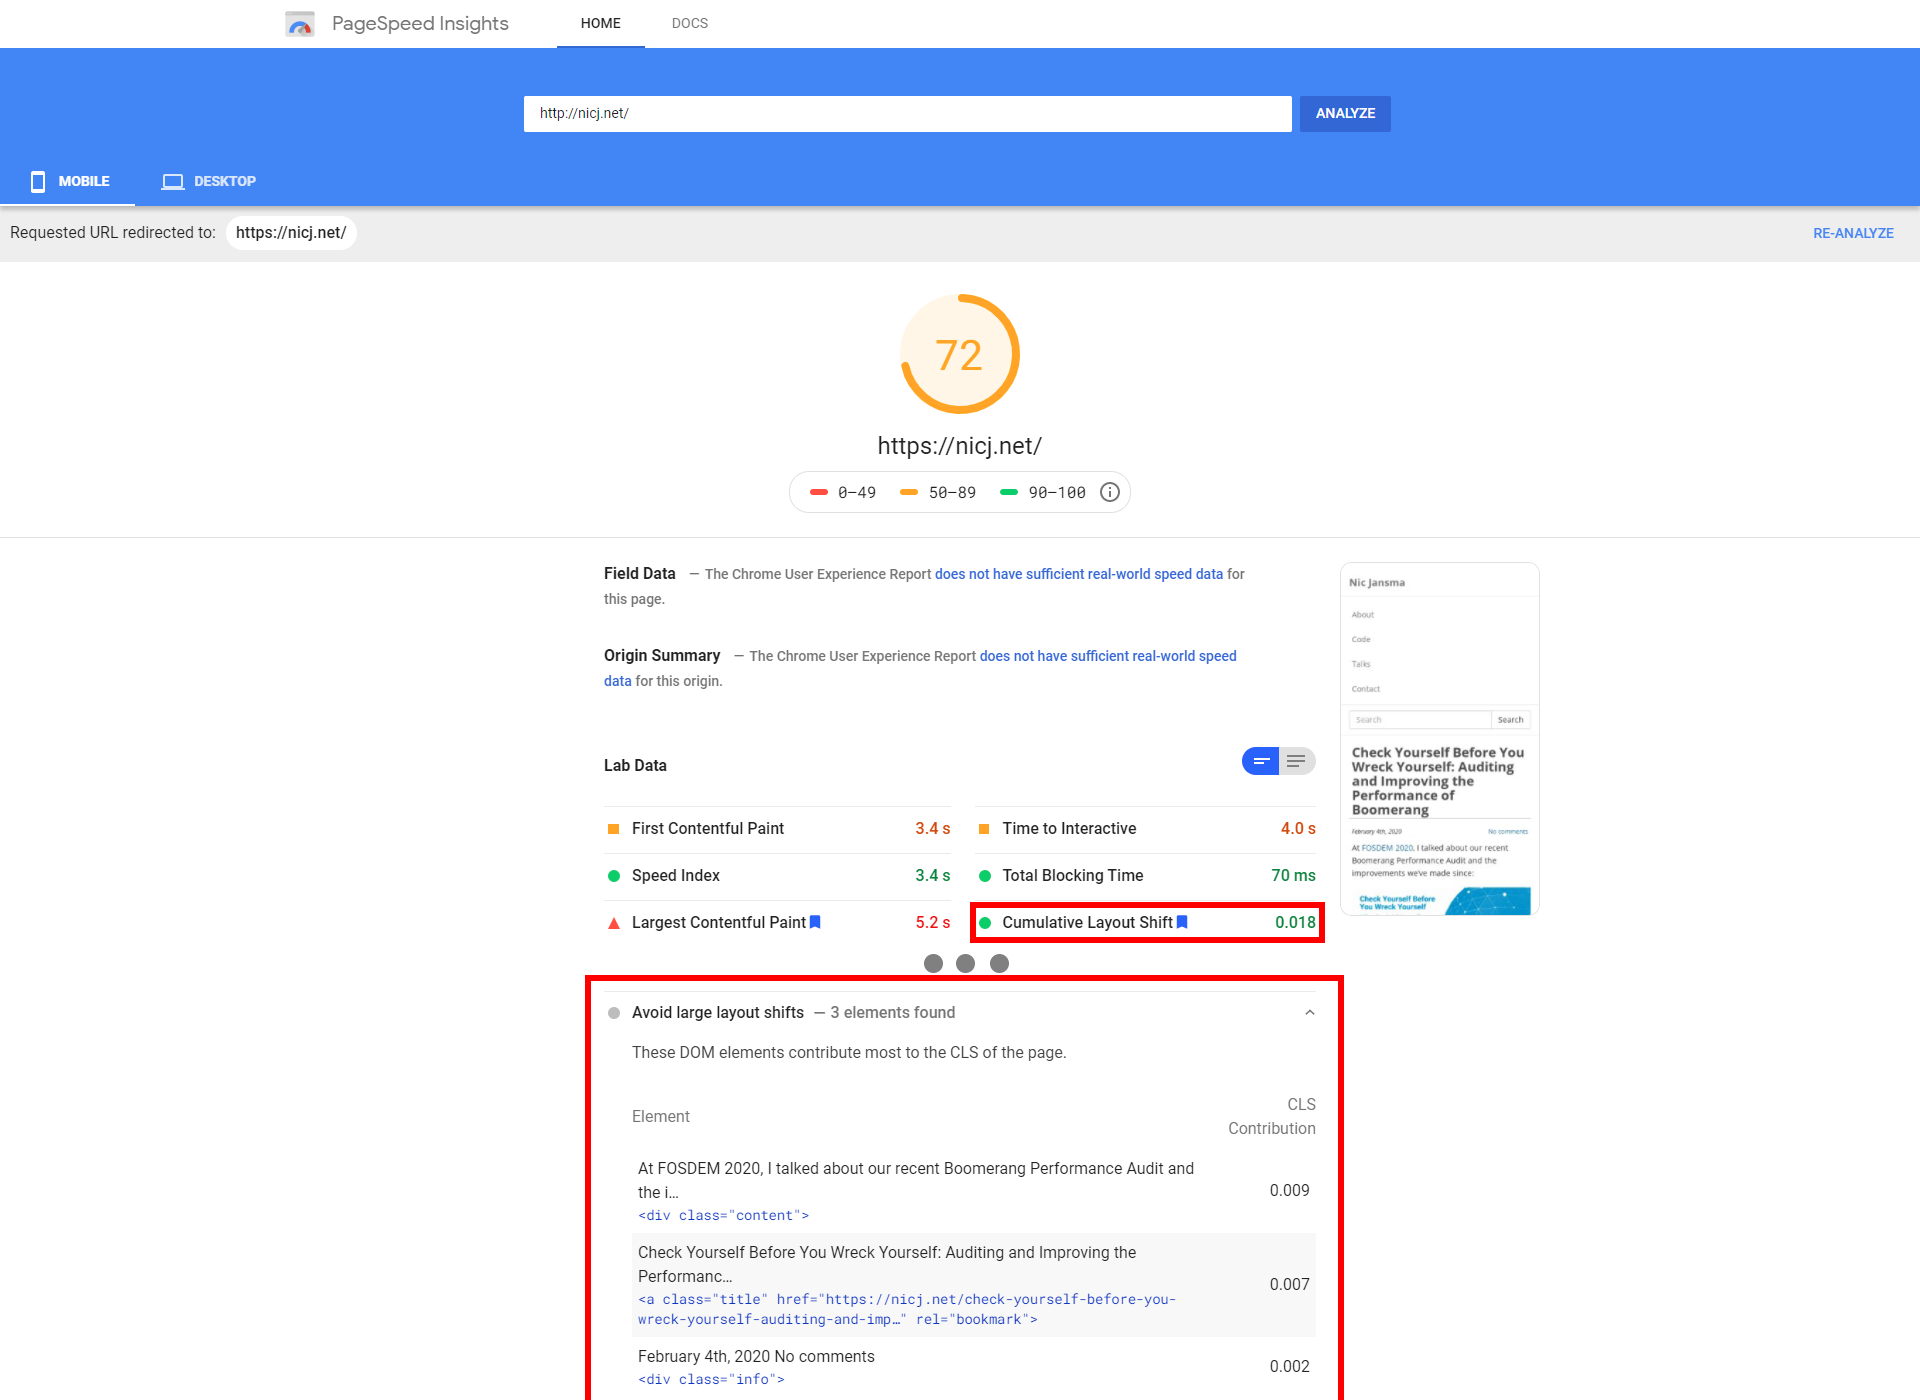
PageSpeed Insights is a free tool from Google. It analyzes the content of a web page, then generates suggestions to make that page faster.

Behind the scenes, it runs Lighthouse as the analysis engine, so you’ll get similar results.

CLS in PageSpeed Insights
WebPagetest

WebPagetest.org, the gold standard in free synthetic performance testing, has a Web Vitals section that calculates CLS (for Chrome browser tests).

CLS in WebPagetest
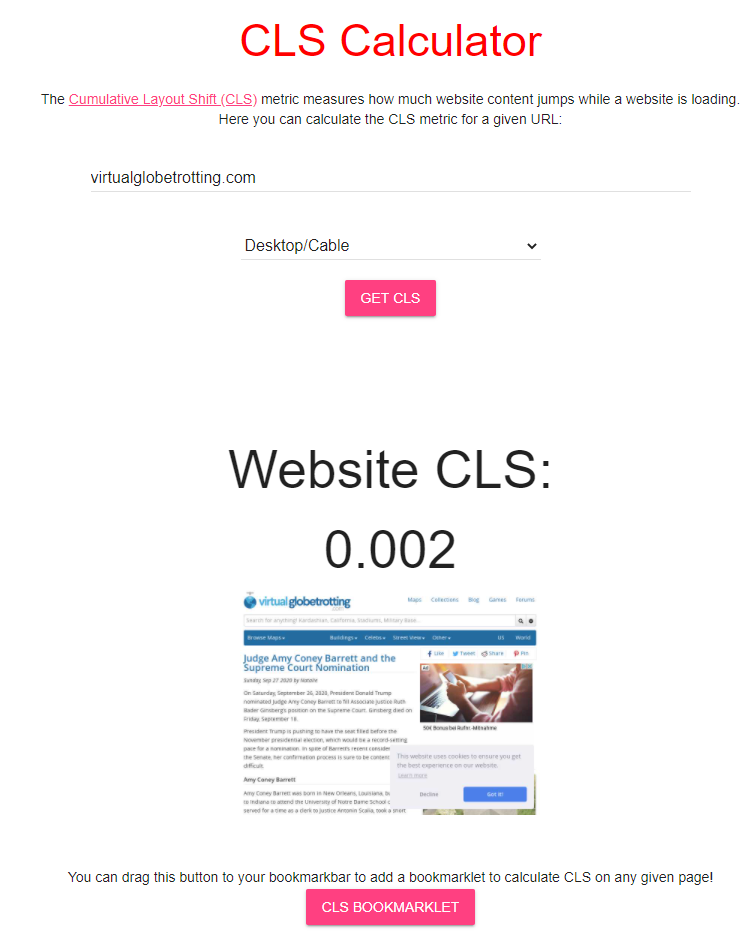
layoutstability.rocks

layoutstability.rocks provides a simple form where you can enter a URL to get the CLS of a page:

CLS in LayoutStability.rocks
Web Vitals Chrome Extension

The Web Vitals Chrome Extension shows a page’s Largest Contentful Paint (LCP) in the extension bar, plus a popup with LCP, First Input Delay (FID) and Cumulative Layout Shift.

CLS Web Vitals Chrome extension

Commercial Synthetic Monitoring Tools

There are several commercial synthetic performance monitoring solutions that help measure Cumulative Layout Shift over time. Here is a sample of some of the best:

SpeedCurve

SpeedCurve has full support for Web Vitals, including CLS:

CLS in SpeedCurve
Calibre

Calibre is a synthetic performance monitoring product, and has full support for Web Vitals, including CLS.

CLS in Calibre

Rigor

Rigor offers synthetic performance monitoring and supports Web Vitals.

DareBoost

DareBoost is a synthetic performance monitoring and website analysis product, and has recently added support for CLS.

CLS in Dareboost

Why does CLS differ between Synthetic and RUM?

(or even between tools?)

CLS scores reported by synthetic tests (such as Lighthouse, WebPagetest or PageSpeed Insights) may be different than CLS scores coming from real-world (RUM) data. RUM libraries (such as boomerang.js or web-vitals.js) may also report different CLS scores than browser data (such as from the Chrome User Experience (CrUX) report).

Here are some reasons why:

  • Each tool may measure layout shifts until a different “end” point
    • See the When does it End? section for more details
    • This is especially important for Single Page Apps. For example, the Chrome User Experience (CrUX) data measures until the visibility state changes (i.e. when the page goes hidden or unloads), while other RUM tools (like Boomerang) more frequently measure just up to the Page Load event, and each individual in-page Soft Navigation separately
  • A single testcase (run) of a synthetic tool (e.g. one Lighthouse run) may report dramatically different results than real-world aggregated data (e.g. RUM or CrUX)
  • Aggregated data may be reflective of a specific date or period in time, while other tools may focus on other date ranges. For example:
    • CrUX always shows the last 28 days
    • mPulse RUM can report any period from last 5 minutes to up to 18 months ago
  • Google generally recommends measuring CLS at the 75th percentile across mobile and desktop devices. Make sure your tool has the capability of measuring different percentiles (and not just averages or only the median)
  • Some tools throw out, or limit CLS scores over a certain value. For example:
  • While today, layout shifts are not counted from IFRAMEs, the spec and synthetic tools suggest they should affect CLS. RUM tools may not be able to easily get layout shifts from IFRAMEs, causing RUM to under-report versus synthetic.

Real World Data

What do Cumulative Layout Shift scores look like in the real world?

I’ve written a companion post to this titled Cumulative Layout Shift in the Real World, which dives into CLS data by looking at data from Akamai mPulse’s RUM.

Head there for insights into how Cumulative Layout Shift scores correlate with business metrics, bounce rates, load times, rage clicks, and more!

What’s Next?

Cumulative Layout Shift is a relatively new metric, and it is still evolving. You can see some of the discussions happening in its GitHub issue tracker as well as through discussions in the Web Performance Working Group.

While it is only supported in Chromium-based browsers today, we hope that it is being considered for other engines as we’ve seen that the metric can provide a good measurement of user experience and correlates with other business metrics.

However, there is still a lot of work to be done to better understand where it’s working, when it doesn’t work, and how we should improve its usefulness over time. As more sites start paying attention to CLS, we will probably learn about its good and bad uses.

Will it be included as part of Google’s Core Vitals metrics next year? We’ll see! They’ve indicated that they’ll evaluate and evolve the primary metrics each year as they gather feedback.

References

Thanks

A few words of thanks…

Thanks to the Boomerang development team (funded by Akamai as part of mPulse), and other mPulse and Akamai employees, and specifically Avinash Shenoy for his work adding CLS support to Boomerang.

The Google engineering team has put a lot of thought and research into Web Vitals, the Layout Shift API and Cumulative Layout Shift scores. Kudos to them for driving for a new performance metric that helps reflect the user experience.

Updates

  • 2020-10-21: Updated the IFRAMEs section to note that CrUX does factor in IFRAME layout shifts into their CLS scores

Check Yourself Before You Wreck Yourself: Auditing and Improving the Performance of Boomerang

February 4th, 2020

At FOSDEM 2020, I talked about our recent Boomerang Performance Audit and the improvements we’ve made since:

Check Yourself Before You Wreck Yourself: Auditing and Improving the Performance of Boomerang on YouTube

Here’s the description:


Boomerang is an open-source Real User Monitoring (RUM) JavaScript library used by thousands of websites to measure their visitor’s experiences. The developers behind Boomerang take pride in building a reliable and performant third-party library that everyone can use without being concerned about its measurements affecting their site. We recently performed and shared an audit of Boomerang’s performance, to help communicate its “cost of doing business”, and in doing so we found several areas of code that we wanted to improve. We’ll discuss how we performed the audit, some of the improvements we’ve made, how we’re testing and validating our changes, and the real-time telemetry we capture for our library to ensure we’re having as little of an impact as possible on the sites we’re included on.

Boomerang is an open-source Real User Monitoring (RUM) JavaScript library used by thousands of websites to measure their visitor’s experiences.

Boomerang runs on billions of page loads a day, either via the open-source library or as part of Akamai’s mPulse RUM service. The developers behind Boomerang take pride in building a reliable and performant third-party library that everyone can use without being concerned about its measurements affecting their site.

Recently, we performed and shared an audit of Boomerang’s performance, to help communicate the “cost of doing business” of including Boomerang on a page while it takes its measurements. In doing the audit, we found several areas of code that we wanted to improve and have been making continuous improvements ever since. We’ve taken ideas and contributions from the OSS community, and have built a Performance Lab that helps “lock in” our improvements by continuously measuring the metrics that are important to us.

We’ll discuss how we performed the audit, some of the improvements we’ve made, how we’re testing and validating our changes, and the real-time telemetry we capture on our library to ensure we’re having as little of an impact as possible on the sites we’re included on.

You can watch the presentation on YouTube or catch the slides.

Boomerang Performance Update

December 5th, 2019

Table Of Contents

  1. Introduction
  2. Boomerang Loader Snippet Improvements
  3. ResourceTiming Compression Optimization
  4. Debug Messages
  5. Minification
  6. Cookie Size
  7. Cookie Access
  8. MD5 plugin
  9. SPA plugin
  10. Brotli
  11. Performance Test Suite
  12. Next

Boomerang is an open-source JavaScript library that measures the page load experience of real users, commonly called RUM (Real User Measurement).

Boomerang is used by thousands of websites large and small, either via the open-source library or as part of Akamai’s mPulse RUM service. With Boomerang running on billions of page loads a day, the developers behind Boomerang take pride in building a reliable and performant third-party library that everyone can use without being concerned about its measurements affecting their site.

Two years ago, we performed an audit of Boomerang’s performance, to help communicate the “cost” of including Boomerang on a page as a third-party script. In doing the audit, we found several areas of code that we wanted to improve, and have been working steadily to make it better for our customers.

This article highlights some of the improvements we’ve made in the last two years, and what we still want to work on next!

Boomerang Loader Snippet Improvements

We recommended loading Boomerang via our custom loader snippet. The snippet ensures Boomerang loads asynchronously and non-blocking, so it won’t affect the Page Load time. Version 10 (v10) of this snippet utilizes an IFRAME to host Boomerang, which gets it out of the critical path.

When we reviewed the performance impact of the snippet we found that on modern devices and browsers the snippet itself should take less than 10ms of CPU, but on older or slower devices it could take 20-40ms.

A significant portion of this CPU cost was creating a dynamic IFRAME and document.write()‘ing into it.

Last year, our team developed an updated version of the loader snippet we call Version 12 (v12), which utilizes Preload on modern browsers (instead of an IFRAME) to load Boomerang asynchronously. This avoids the majority of the CPU cost we saw when profiling the snippet.

As long as your browser supports Preload, the new loader snippet should have negligible CPU cost:

DeviceOSBrowserSnippet v10 (ms)Snippet v12 (ms)Method
PC DesktopWin 10Chrome 7371Preload
PC DesktopWin 10Firefox 6633IFRAME
PC DesktopWin 10IE 101212IFRAME
PC DesktopWin 10IE 111414IFRAME
PC DesktopWin 10Edge 4481Preload
MacBook Pro (2017)macOS High SierraSafari 1231Preload
Galaxy S4Android 4Chrome 56371Preload
Galaxy S8Android 8Chrome 7391Preload
Galaxy S10Android 9Chrome 7371Preload
iPhone 4iOS 7Safari 71919IFRAME
iPhone 5siOS 11Safari 1199IFRAME
iPhone 5siOS 12Safari 1291Preload

Browsers which don’t support Preload (such as IE and Firefox) will still use the IFRAME fallback, but it should still take minimal time to execute.

In addition, the new loader snippet is CSP-compliant, and brings some SEO improvements (i.e. creating an IFRAME in the <head> can confuse some web crawlers).

You can review the difference between the two versions here.

ResourceTiming Compression Optimization

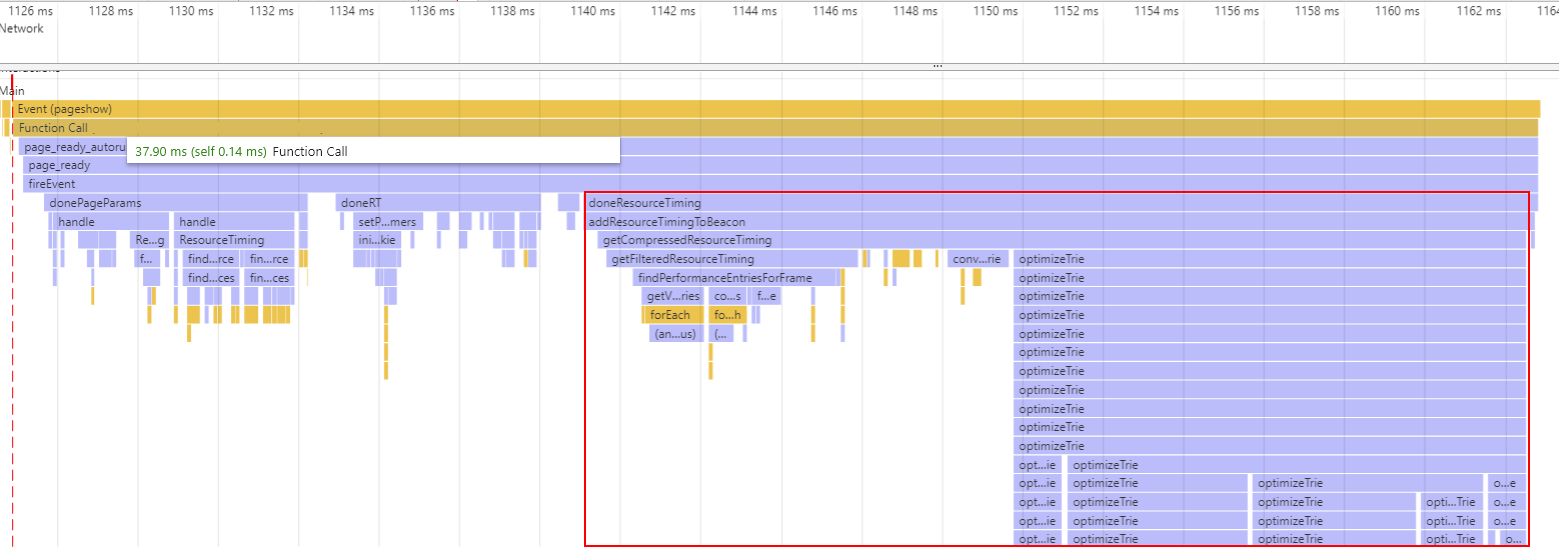
Boomerang can collect ResourceTiming data for all of the resources on the page. We compress the data to reduce its size, but we found this was one of the most expensive things we did.

Boomerang's ResourceTiming Compression in CPU Profiles

On some sites — especially those with hundreds of resources — our ResourceTiming compression could take 20-100ms or more. Most of the cost is in our optimizeTrie() function. Let’s take a look at what it does.

Say you have a list of ResourceTiming entries, i.e. resources fetched from a website:

http://site.com/
http://site.com/assets/js/main.js
http://site.com/assets/js/lib.js
http://site.com/assets/css/screen.css

We convert this list of URLs into an optimized Trie, a data structure that compresses common prefixes (i.e. http://site.com/ for all URLs above):

{"http://site.com/": {
    "|": "[data]",
    "assets/": {
        "js/": {
            "main.js": "[data]",
            "lib.js": "[data]"
        },
        "css/screen.css": "[data]"
    }
}

Originally, we were compressing a perfectly-optimized Trie — we would evaluate every character of every URL to find if there are other URLs that share the same prefix. This character iteration would create call stacks N deep, where N is the longest URL on the page. This is pretty costly to execute as you can imagine!

We switched this Trie optimization to instead split each URL at every "/" instead of every character. This leads to a slightly less optimized Trie (meaning, a few bytes larger), but it’s significantly faster. Call stacks are now only as deep as the number of slashes in the URL.

These optimizations are most significant on large sites (i.e. 100+ URLs): on sites where the ResourceTiming optimization was taking > 100ms (on desktop CPUs), changing to splitting at "/" reduced CPU time to ~25ms at only a 4% growth in data.

On less complex sites that used to take 25-35ms to compress this data, changing our algorithm reduced CPU time to just ~10ms at only 2-3% data growth.

Collecting ResourceTiming is still one of the more expensive operations that Boomerang does, but its costs are much less noticeable!

You can review our change here.

Debug Messages

Our community noticed that even in the production builds of Boomerang, the BOOMR.debug() debug messages were included in the minified JavaScript, even though they would never be echo’d to the console.

Stripping these messages from the build saw immediate size improvements:

  • Original size (minified): 205,769 bytes
  • BOOMR.debug() and related messages removed: 196,125 bytes (-5%)

Gzipped:

  • Original size (minified, gzipped): 60,133 bytes
  • BOOMR.debug() and related messages removed (minified, gzipped): 57,123 bytes (-6%)

Removing dead code is always a win!

You can review our change here.

Minification

For production builds, we used UglifyJS-2 to minify Boomerang.

Minification is incredibly powerful — in our case, our “debug” builds are over 800 KB, and are reduced to 191 KB on minification:

  • Boomerang with all comments and debug code: 820,130 bytes
  • Boomerang minified: 196,125 bytes (76% savings)

When Boomerang was first created, it used the YUI Compressor for minification. We switched to UglifyJS-2 in 2015 as it offered the best minification rate at the time.

UgifyJS-3 is now out, so we wanted to investigate if it (or any other tool) offered better minification in 2019.

After some experimentation, we changed from UglifyJS-2 to UglifyJS-3, while also enabling the ie8:true option for compatibility and compress.keep_fnames option to improve Boomerang Error reporting.

After all of these changes, Boomerang is 2,074 bytes larger uncompressed (because of ie8 and keep_fnames), though 723 bytes smaller once gzipped. Had we not enabled those compatibility options, Uglify-3 would’ve been 2,596 bytes smaller than Uglify-2. We decided the compatibility changes were worth it.

You can review this change here.

Our team also looked at the Closure compiler, and we estimate it would give us additional savings:

  • UglifyJS-3: 47 KB brotli, 55 KB gzip
  • Closure: 42 KB brotli, 47 KB gzip

Unfortunately, there are some optimizations in the Closure compiler that complain about parts of the Boomerang source code. Boomerang today can collect performance metrics on IE6+, and switching to Closure might reduce our support for older browsers.

Cookie Size

mPulse uses a first-party cookie RT to track mPulse sessions between pages, and for tracking Page Load time on browsers that don’t support NavigationTiming.

Here’s an example of what the cookie might look like in a modern browser. Our cookie consists of name-value pairs (~322 bytes):

dm=virtualglobetrotting.com
si=9563ee29-e809-4844-88df-d4e84697f475
ss=1537818004420
sl=1
tt=7556
obo=0
sh=1537818012102%3D1%3A0%3A7556
bcn=%2F%2F17d98a5a.akstat.io%2F
ld=1537818012103
nu=https%3A%2F%2Fvirtualglobetrotting.com%maps%2F
cl=1537818015199
r=https%3A%2F%2Fvirtualglobetrotting.com%2F
ul=1537818015211

We reviewed everything that we were storing in the cookie, and found a few areas for improvement.

The two biggest contributors to its size are the "nu" and "r" values, which are the URL of the next page the user is navigating to, and the referring page, respectively. This means the cookie will be at least as long as those two URLs.

We decided that we didn’t need to store the full URL in the cookie: we could use a hash instead, and compare the hashes on the next page. This can save a lot of bytes on longer-URL sites.

We were also able to reduce the size of all of the timestamps in the cookie by switching to Base36 encoding, and offsetting each timestamp by the start time ("ss"). We also removed some unused debugging data ("sh").

Example cookie after all of the above changes (~189 bytes, 41% smaller):

dm=virtualglobetrotting.com
si=9563ee29-e809-4844-88df-d4e84697f475
ss=jmgp4udg
sl=1
tt=5tw
obo=0
bcn=%2F%2F17d98a5a.akstat.io%2F
ld=5xf
nu=13f91b339af573feb2ad5f66c9d65fc7
cl=8bf
ul=8br
z=1

You can review our change here.

Cookie Access

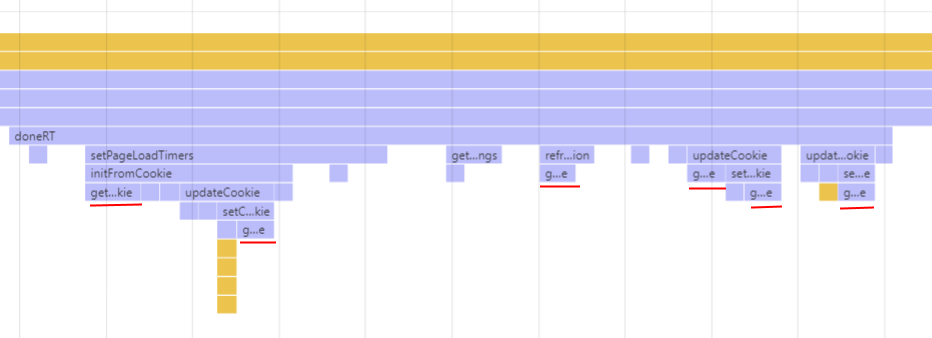
As part of the 2017 Boomerang Performance Audit we found that Boomerang was reading/writing the Cookie multiple times during the page load, and the relevant functions were showing up frequently in CPU profiles:

Boomerang Cookie Access

Upon review, we found that Boomerang was reading the RT cookie up to 21 times during a page load and setting it a further 8 times. This seemed… excessive. Cookie accesses may show up on CPU profiles because it can be accessing the disk to persist the data.

Through an audit of these reads/writes and some optimizations, we’ve been able to reduce this down to 2 reads and 4 writes, which is the minimal number we think are required to be reliable.

You can review our change here.

MD5 plugin

This improvement comes from our new Boomerang developer Tsvetan Stoychev. In his words:

“About 2 months ago we received a ticket in our GitHub repository about an issue developers experienced when they tried to build a Boomerang bundle that does not contain the Boomerang MD5 plugin. It was nothing critical but I started working on a small fix to make sure the issue doesn’t happen again in newer versions of Boomerang.

While working on the fix, I managed to understand the bigger picture and the use cases where we used the MD5 plugin. I saw an opportunity to replace MD5 implementation with an algorithm that doesn’t generate hashes as strong as MD5 but would still work in our use case.

The goal was to reduce the Boomerang bundle size and to keep things backward-compatible. I asked around in a group of professionals who do programming for IoT devices and received some good ideas about lightweight algorithms that could save a lot of bytes.

I looked at 2 candidates: CRC32 and FNV-1. The winner was a slightly modified version of FNV-1 and in terms of bytes it was 0.33 KB (uncompressed) compared to MD5, which was 8.17 KB (uncompressed). I also experimented with CRC32 but the JavaScript implementation was 2.55 KB (uncompressed) because the CRC32 source code contains a string of a CRC table that adds quite a few bytes. As a matter of fact, there is a way to use a smaller version that is 0.56 KB (uncompressed) where the CRC table is generated on the fly, but I found this version was adding more complexity and had a performance penalty when the CRC table was generated.

Let’s look at the data I gathered during my research where I compare performance, bytes and chances for collisions:

#CollisionsSize (uncompressed)Hash LengthHashes / Sec
MD508.17 KB3235,397
CRC3282.55 KB9-10253,680
FNV-1 (original)30.33 KB9-10180,056
FNV-1 (modified)00.34 KB6-8113,532
  • Collision testing was performed on 500,000 unique URLs.
  • Performance benchmark was performed with the help of jsPerf

FNV-1 modifications:

  • In order to achieve better entropy for the FNV-1 algorithm, we concatenate the length of our input string with the end of the original FNV-1 generated hash.
  • The FNV-1 output is actually a number that we convert to base 36 in the modified version in order to make the number’s string representation shorter.

Below is the final result in case you would like to test the modified version of FNV-1:

var fnv = function(string) {
    string = encodeURIComponent(string);
    var hval = 0x811c9dc5;
    for (var i = 0; i < string.length; i++) {
        hval = hval ^ string.charCodeAt(i);
        hval += (hval << 1) + (hval << 4) + (hval << 7) + (hval << 8) + (hval << 24);
    }
    var hash = (hval >>> 0).toString() + string.length;
    return parseInt(hash).toString(36);
}

You can review our change here.

SPA Plugin

This improvement comes from our Boomerang developer Nigel Heron, who’s been working on a large refactor (and simplification) of our Single Page App monitoring code. In his words:

“Boomerang had 4 SPA plugins: Angular, Ember, Backbone and History. The first 3 are SPA framework specific and hook into special functions in their respective frameworks to detect route changes (eg. Angular’s $routeChangeStart).

The History plugin could be used in 2 ways, either by hooking into the React Router framework’s history object or by hooking into the browser’s window.history object for use by any other framework that calls the window History API before issuing route changes.

As SPA frameworks have evolved over the years, calling into the History API before route changes has become standard. We determined that the timings observed by hooking History API calls vs hooking into framework specific events was negligible.

We modified the History plugin to remove React specific code and removed the 3 framework specific plugins from Boomerang.

This has simplified Boomerang’s SPA logic, simplified the configuration of Boomerang on SPA sites and as a bonus, has dropped the size of Boomerang!

unminifiedminifiedgzip
before796 KB202 KB57.27 KB
after779 KB200 KB57.07 KB

You can review our change here.

Brotli

This is a fix that could be applied to any third-party library, but when we ran our audit two years ago, we had not yet enabled Brotli compression for boomerang.js delivery when using mPulse.

mPulse’s boomerang.js is delivered via the Akamai CDN, and we were able to utilize Akamai’s Resource Optimizer to automatically enable Brotli compression for our origin-gzip-compressed JavaScript URLs, with minimal effort. We should have done this sooner!

The over-the-wire byte savings of Brotli vs gzip are pretty significant. Taking the most recent build of Boomerang with all plugins enabled:

  • gzip: 54,803 bytes
  • brotli: 48,663 bytes (11.2% savings)

Brotli is now enabled for all boomerang.js downloads for mPulse customers.

(Over-the-wire byte size does not reduce the parse/compile/initialization time of Boomerang, and we’re still looking for additional ways of making Boomerang and its plugins smaller and more efficient)

Performance Test Suite

After spending so much time improving the above issues, it would be a shame if we were working on unrelated changes and accidentally regressed our improvements!

To assist us in this, we built a lightweight performance test suite into the Boomerang build infrastructure that can be executed on-demand and the results can be compared to previous runs.

We built the performance tests on top of our existing End-to-End (E2E) tests, which are basic HTML pages we use to test Boomerang in various scenarios. Today we have over 550+ E2E tests that run on every build.

The new Boomerang Performance Tests utilize a similar test infrastructure and also track metrics built into the debug builds of Boomerang, such as the scenario’s CPU time or how many times the cookie was set.

Example results of running one Boomerang Test scenario:

> grunt perf

{
  "00-basic": {
    "00-empty": {
      "page_load_time": 30,
      "boomerang_javascript_time": 29.5,
      "total_javascript_time": 43,
      "mark_startup_called": 1,
      "mark_check_doc_domain_called": 4,
  ...
}

If we re-run the same test later after making changes, we can directly compare the results:

> grunt perf:compare

Running "perf-compare" task
Results comparison to baseline:
00-basic.00-empty.page_load_time  :  30 -6 (-20%)

We still need to be attentive to our changes and to run these test automatically to “hold the line”.

We also need to try to be mindful and put in instrumentation (metrics) when we’re making fixes to make sure we have something to track over time.

You can review our change here.

Next

With all of the above improvements, where are we at?

We’ve:

  • Reduced the overhead and increased the compatibility of the Loader Snippet
  • Reduced the CPU cost of gathering ResourceTiming data
  • Reduced the size of Boomerang by stripping debug messages, applying smarter minification, and enabling Brotli
  • Reduced the size of and overhead of cookies for Session tracking
  • Reduced the size of Boomerang and complexity of hashing URLs by switching to FNV, and by simplifying our SPA plugins
  • Created a Performance Test Suite to track our improvements over time

All of these changes had to be balanced against the other work we do to improve the library itself. We still have a large list of other performance-related items we hope to tackle in 2020.

One of the main areas we continue to focus on is Boomerang’s size. As more features, reliability and compatibility fixes get added, Boomerang continues to increase in size. While we’ve done a lot of work to keep it under 50 KB (over the wire), we know there is more we can do.

One thing we’re looking into for our mPulse customers is to deliver builds of Boomerang with the minimal features necessary for that application’s configuration. For example, if Single Page App support is not needed, all of the related SPA plugins can be omitted. We’re exploring ways of quickly switching between different builds of Boomerang for mPulse customers, while still having a high browser cache hit rate and yet allowing customers to change their configuration and see it “live” within 5 minutes.

Note that open-source users of Boomerang can always build a custom build with only the plugins they care about. Depending on the features needed, open-source builds can be under 30 KB with the majority of the plugins included.

Thanks

Boomerang is built by the developers at Akamai and the broader performance community on Github. Many people have a hand in building and improving Boomerang, including the changes mentioned above by: Nigel Heron, Nic Jansma, Andreas Marschke, Avinash Shenoy, Tsvetan Stoychev, Philip Tellis, Tim Vereecke, Aleksey Zemlyanskiy, and all of the other open-source contributors.

Side Effects of Boomerang’s JavaScript Error Tracking

April 9th, 2019

Table Of Contents

  1. Introduction
  2. What is Boomerang Doing
  3. Fixing Script Error
  4. Workarounds for Third Parties that Aren’t Sending ACAO
  5. Disabling Wrapping
  6. Side Effects of Wrapping
    1. Overhead
    2. Console Logs
    3. Browser CPU Profiling
    4. Chrome Lighthouse and Page Speed Insights
    5. WebPagetest
  7. Summary

Introduction

TL;DR: If you don’t have time to read this article, head down to the summary. If you’re specifically interested in how Boomerang may affect Chrome Lighthouse, Page Speed Insights or WebPagetest, check those sections.

Boomerang is an open-source JavaScript library that measures the page load time experienced by real users, commonly called RUM (Real User Measurement). Boomerang is easily integrated into personal projects, enterprise websites, and also powers Akamai’s mPulse RUM monitoring. Boomerang optionally includes a JavaScript Error Tracking plugin, which monitors the page for JavaScript errors and includes those error messages on the beacon.

When JavaScript Error Tracking is enabled for Boomerang, it can provide real-time telemetry (analytics) on the health of your application. However, due to the way Boomerang gathers important details about each error (e.g. the full message and stack), it might be incorrectly blamed for causing errors, or as the culprit for high CPU usage.

This unintentional side-effect can be apparent in tools like browser developer tools’ consoles, WebPagetest, Chrome Lighthouse and other benchmarks that report on JavaScript CPU usage. For example, Lighthouse may blame Boomerang under Reduce JavaScript Execution Time due to how Boomerang "wraps" functions to gather better error details. This unfortunately "blames" Boomerang for more work than it is actually causing.

Let’s explore why, and how you can ensure those tools report on the correct source of errors and JavaScript CPU usage.

This article is applicable to both the open-source Boomerang as well as the Boomerang used with Akamai mPulse. Where appropriate, differences will be mentioned.

Read more…