Last updated: May 2021
Table Of Contents
- Introduction
- How was it done before?
2.1. What’s Wrong With This? - Marks and Measures
3.1. How to Use
3.2. Example Usage
3.3. Standard Mark Names
3.4. UserTiming Level 3
3.5. Arbitrary Timestamps
3.6. Arbitrary Metadata - Benefits
- Developer Tools
- Use Cases
- Compressing
- Availability
- Using NavigationTiming Data
- Conclusion
- Updates
Introduction
UserTiming is a specification developed by the W3C Web Performance working group, with the goal of giving the developer a standardized interface to log timestamps ("marks") and durations ("measures").
UserTiming utilizes the PerformanceTimeline that we saw in ResourceTiming, but all of the UserTiming events are put there by the you the developer (or the third-party scripts you’ve included in the page).
UserTiming Level 1 and Level 2 are both a Recommendation, which means that browser vendors are encouraged to implement it. Level 3 adds additional features and is in development.
As of May 2021, 96.6% of the world-wide browser market-share support UserTiming.
How was it done before?
Prior to UserTiming, developers have been keeping track of performance metrics, such as logging timestamps and event durations by using simple JavaScript:
var start = new Date().getTime();
// do stuff
var now = new Date().getTime();
var duration = now - start;
What’s wrong with this?
Well, nothing really, but… we can do better.
First, as discussed previously, Date().getTime() is not reliable and DOMHighResTimestamps should be used instead (e.g. performance.now()).
Second, by logging your performance metrics into the standard interface of UserTiming, browser developer tools and third-party analytics services will be able to read and understand your performance metrics.
Marks and Measures
Developers generally use two core ideas to profile their code. First, they keep track of timestamps for when events happen. They may log these timestamps (e.g. via Date().getTime()) into JavaScript variables to be used later.
Second, developers often keep track of durations of events. This is often done by taking the difference of two timestamps.
Timestamps and durations correspond to "marks" and "measures" in UserTiming terms. A mark is a timestamp, in DOMHighResTimeStamp format. A measure is a duration, the difference between two marks, also measured in milliseconds.
How to use
Creating a mark or measure is done via the window.performance interface:
partial interface Performance {
    void mark(DOMString markName);

    void clearMarks(optional  DOMString markName);

    void measure(DOMString measureName, optional DOMString startMark,
        optional DOMString endMark);

    void clearMeasures(optional DOMString measureName);
};

interface PerformanceEntry {
  readonly attribute DOMString name;
  readonly attribute DOMString entryType;
  readonly attribute DOMHighResTimeStamp startTime;
  readonly attribute DOMHighResTimeStamp duration;
};

interface PerformanceMark : PerformanceEntry { };

interface PerformanceMeasure : PerformanceEntry { };
A mark (PerformanceMark) is an example of a PerformanceEntry, with no additional attributes:
nameis the mark’s nameentryTypeis"mark"startTimeis the time the mark was createddurationis always0
A measure (PerformanceMeasure) is also an example of a PerformanceEntry, with no additional attributes:
nameis the measure’s nameentryTypeis"measure"startTimeis thestartTimeof the start markdurationis the difference between thestartTimeof the start and end mark
Example Usage
Let’s start by logging a couple marks (timestamps):
// mark
performance.mark("start");
// -> {"name": "start", "entryType": "mark", "startTime": 1, "duration": 0}

performance.mark("end");
// -> {"name": "end", "entryType": "mark", "startTime": 2, "duration": 0}

performance.mark("another");
// -> {"name": "another", "entryType": "mark", "startTime": 3, "duration": 0}
performance.mark("another");
// -> {"name": "another", "entryType": "mark", "startTime": 4, "duration": 0}
performance.mark("another");
// -> {"name": "another", "entryType": "mark", "startTime": 5, "duration": 0}
Later, you may want to compare two marks (start vs. end) to create a measure (called diff), such as:
performance.measure("diff", "start", "end");
// -> {"name": "diff", "entryType": "measure", "startTime": 1, "duration": 1}
Note that measure() always calculates the difference by taking the latest timestamp that was seen for a mark. So if you did a measure against the another marks in the example above, it will take the timestamp of the third call to mark("another"):
performance.measure("diffOfAnother", "start", "another");
// -> {"name": "diffOfAnother", "entryType": "measure", "startTime": 1, "duration": 4}
There are many ways to create a measure:
- If you call
measure(name), thestartTimeis assumed to bewindow.performance.timing.navigationStartand theendTimeis assumed to be now. - If you call
measure(name, startMarkName), thestartTimeis assumed to bestartTimeof the given mark’s name and theendTimeis assumed to be now. - If you call
measure(name, startMarkName, endMarkName), thestartTimeis assumed to bestartTimeof the given start mark’s name and theendTimeis assumed to be thestartTimeof the given end mark’s name.
Some examples of using measure():
// log the beginning of our task (assuming now is '1')
performance.mark("start");
// -> {"name": "start", "entryType": "mark", "startTime": 1, "duration": 0}

// do work (assuming now is '2')
performance.mark("start2");
// -> {"name": "start2", "entryType": "mark", "startTime": 2, "duration": 0}

// measure from navigationStart to now (assuming now is '3')
performance.measure("time to get to this point");
// -> {"name": "time to get to this point", "entryType": "measure", "startTime": 0, "duration": 3}

// measure from "now" to the "start" mark (assuming now is '4')
performance.measure("time to do stuff", "start");
// -> {"name": "time to do stuff", "entryType": "measure", "startTime": 1, "duration": 3}

// measure from "start2" to the "start" mark
performance.measure("time from start to start2", "start", "start2");
// -> {"name": "time from start to start2", "entryType": "measure", "startTime": 1, "duration": 1}
Once a mark or measure has been created, you can query for all marks, all measures, or specific marks/measures via the PerformanceTimeline. Here’s a review of the PerformanceTimeline methods:
window.performance.getEntries();
window.performance.getEntriesByType(type);
window.performance.getEntriesByName(name, type);getEntries(): Gets all entries in the timelinegetEntriesByType(type): Gets all entries of the specified type (egresource,mark,measure)getEntriesByName(name, type): Gets all entries with the specified name (eg URL or mark name).typeis optional, and will filter the list to that type.
Here’s an example of using the PerformanceTimeline to fetch a mark:
// performance.getEntriesByType("mark");
[
    {
        "duration":0,
        "startTime":1
        "entryType":"mark",
        "name":"start"
    },
    {
        "duration":0,
        "startTime":2,
        "entryType":"mark",
        "name":"start2"
    },
    ...
]

// performance.getEntriesByName("time from start to start2", "measure");
[
    {
        "duration":1,
        "startTime":1,
        "entryType":"measure",
        "name":"time from start to start2"
    }
]
You also have the ability to clear (remove) marks and measures from the buffer:
// clears all marks
performance.clearMarks();

// clears the named marks
performance.clearMarks("my-mark");

// clears all measures
performance.clearMeasures();

// clears the named measures
performance.clearMeasures("my-measure");
You can also skip the buffer and listen for marks or measures via a PerformanceObserver:
if (typeof window.PerformanceObserver === "function") {
  var userTimings = [];

  var observer = new PerformanceObserver(function(entries) {
    Array.prototype.push.apply(userTimings, entries.getEntries());
  });

  observer.observe({entryTypes: ['mark', 'measure']});
}
Standard Mark Names
There are a couple of mark names that were at one point suggested by the W3C specification to have special meanings:
mark_fully_loaded: The time when the page is considered fully loaded as marked by the developer in their applicationmark_fully_visible: The time when the page is considered completely visible to an end-user as marked by the developer in their applicationmark_above_the_fold: The time when all of the content in the visible viewport has been presented to the end-user as marked by the developer in their applicationmark_time_to_user_action: The time of the first user interaction with the page during or after a navigation, such as scroll or click, as marked by the developer in their application
By using these standardized names, other third-party tools could have theoretically picked up on your meanings and treated them specially (for example, by overlaying them on your waterfall).
These names were removed from the Level 2 of the spec. You can still use those names if you choose, but I’m not aware of any tools that treat them specially.
Obviously, you can use these mark names (or anything else) for anything you want, and don’t have to stick by the recommended meanings.
UserTiming3
Level 3 of the specification is still under development, but has some additional features that may be useful:
- Ability to execute marks and measures across arbitrary timestamps
- Support for reporting arbitrary metadata along with marks and measures
Not all browsers support Level 3. As of May 2021, the only browser that does is Chrome.
Arbitrary Timestamps
With UserTiming Level 3, you can now specify a startTime (for marks), and a start and/or end time and/or duration for measures.
For marks, this gives you finer control over the exact timestamp, instead of taking "now" as the "start" timestamp. For example, you could save a time associated with an event (via performance.now()), and you may not be sure you want to log that event as a mark until later. Later, if you create a mark for it, you can give the timestamp you had stored away:
// do something -- not sure you want to mark yet?
var weShouldMark = false;
var startTime = performance.now();
doSomeWork();

// do other things
weShouldMark = doOtherThings();

// decide you wanted to mark that start
if (weShouldMark) {
  performance.mark("work-started", {
    startTime: startTime
  });
}
For measures, you can now specify an arbitrary start, end or duration:
// specifying a start and end
performance.measure("my-custom-measure", {
  start: startTime,
  end: performance.now()
});

// specifying a duration (need to specify start or end as well)
performance.measure("my-custom-measure", {
  start: startTime,
  duration: 100 // ms
});
Arbitrary Metadata / detail
Both marks and measures now allow you to specify a detail option, which is an object that will be stored alongside the mark/measure for later retrieval. For example, if you have any metadata you want saved as part of the mark/measure, you can store it and get it later:
performance.mark("my-mark", {
  detail: {
    page: "this-page",
    component: "that-component"
  },
});

performance.getEntriesByName("my-mark")[0];
// {
//   name: "my-mark",
//   startTime: 12345,
//   duration: 0,
//   detail: { page: "this-page", component: "that-component"}
// }
Benefits
So why would you use UserTiming over just Date().getTime() or performance.now()?
First, it uses the PerformanceTimeline, so marks and measures are in the PerformanceTimeline along with other events
Second, it uses DOMHighResTimestamp instead of Date so the timestamps have sub-millisecond resolution, and are monotonically non-decreasing (so aren’t affected by the client’s clock).
Developer Tools
UserTiming marks and measures are currently available in the Chrome, Internet Explorer Developer Tools.
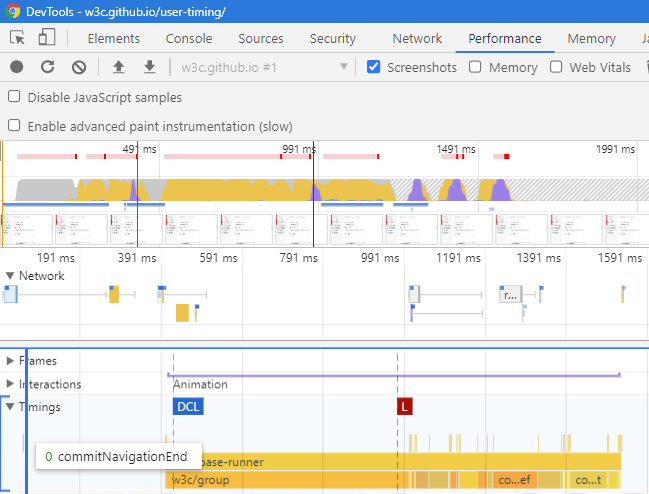
For Chrome, they are in Performance traces under Timings:

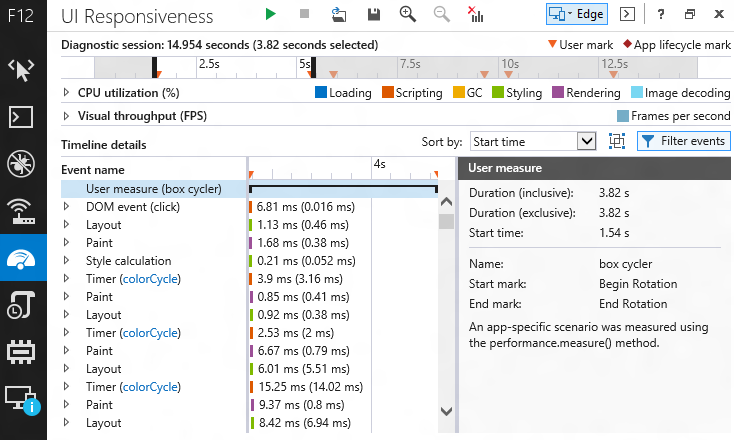
For IE, they are called User marks and are shown as upside-down red triangles below:

They are not yet shown in Firefox or Safari.
Use Cases
How could you use UserTiming? Here are some ideas:
- Any place that you’re already logging timestamps or calculating durations could be switched to UserTiming
- Easy way to add profiling events to your application
- Note important scenario durations in your Performance Timeline
- Measure important durations for analytics
Compressing
If you’re adding UserTiming instrumentation to your page, you probably also want to consume it. One way is to grab everything, package it up, and send it back to your own server for analysis.
In my UserTiming Compression article, I go over a couple ways of how to do this. Versus just sending the UserTiming JSON, usertiming-compression.js can reduce the byte size down to just 10-15% of the original.
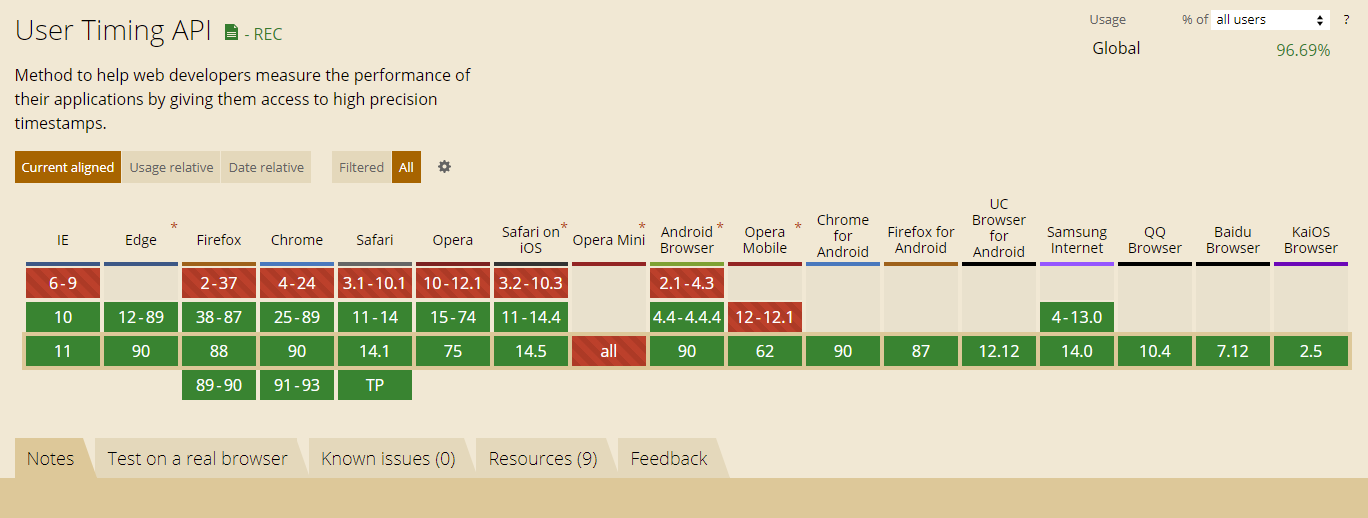
Availability
UserTiming is available in most modern browsers. According to caniuse.com 96.6% of world-wide browser market share supports ResourceTiming, as of May 2021. This includes Internet Explorer 10+, Firefox 38+, Chrome 25+, Opera 15+, Safari 11+ and Android Browser 4.4+.

If you want to use UserTiming for everything, there are polyfills available that work 100% reliably in all browsers.
I have one such polyfill, UserTiming.js, available on Github.
DIY / Open Source / Commercial
If you want to use UserTiming, you could easily compress and beacon the data to your back-end for processing.
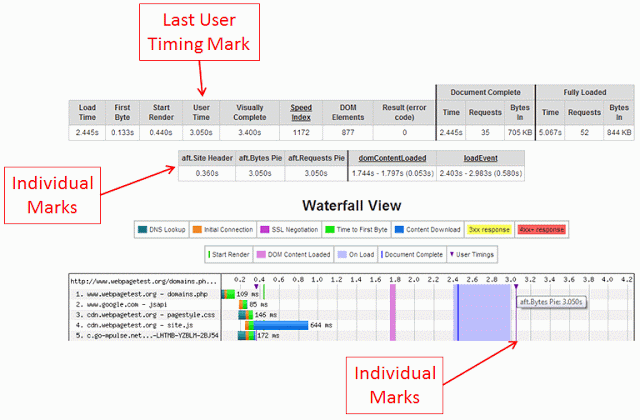
WebPageTest sends UserTiming to Google Analytics, Boomerang and Akamai mPulse:

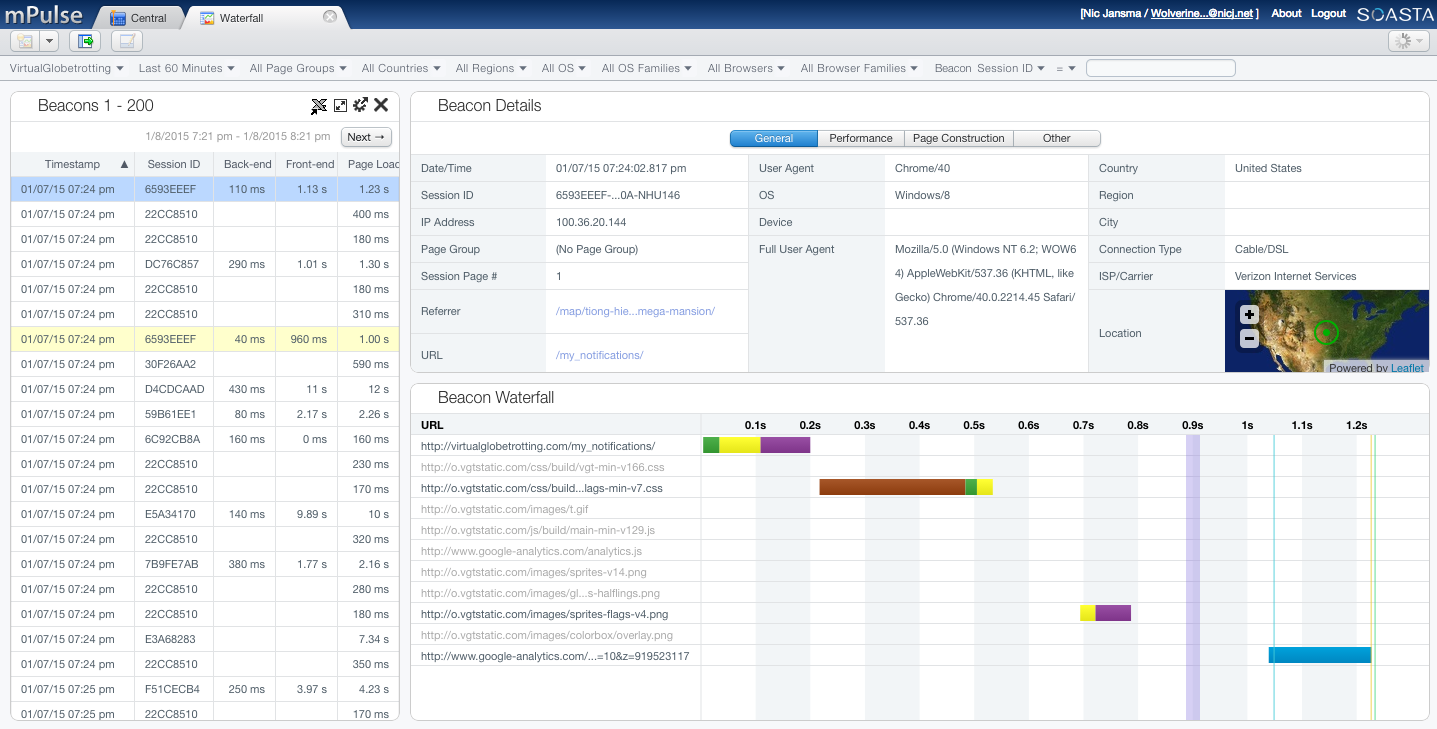
Akamai mPulse collects UserTiming information for any Custom Timers you specify (I work at Akamai, on mPulse and Boomerang):

Conclusion
UserTiming is a great interface to log your performance metrics into a standardized interface. As more services and browsers support UserTiming, you will be able to see your data in more and more places.
That wraps up our talk about how to monitor and measure the performance of your web apps. Hope you enjoyed it.
Other articles in this series:
More resources:
- UserTiming W3C specification
DOMHighResTimeStampW3C specification- PerformanceTimeline W3C specification
- UserTiming.js polyfill
Updates
- 2015-12-01: Added Compressing section
- 2021-05:
- Updated caniuse.com market share
- Added example usage via
PerformanceObserver - Added details about Level 3 usage (arbitrary timestamps and details)
- Added a Table of Contents
- Updated Standard Mark Names section about deprecation