Measuring the Performance of Single Page Applications

October 15th, 2015

Philip Tellis and I recently gave this talk at Velocity New York 2015.  Check out the slides on Slideshare:

measuring-the-performance-of-single-page-applications

In the talk, we discuss the three main challenges of measuring the performance of SPAs, and how we’ve been able to build SPA performance monitoring into Boomerang.

The talk is also available on YouTube.

UserTiming in Practice

May 29th, 2015

Last updated: May 2021

Table Of Contents

  1. Introduction
  2. How was it done before?
    2.1. What’s Wrong With This?
  3. Marks and Measures
    3.1. How to Use
    3.2. Example Usage
    3.3. Standard Mark Names
    3.4. UserTiming Level 3
    3.5. Arbitrary Timestamps
    3.6. Arbitrary Metadata
  4. Benefits
  5. Developer Tools
  6. Use Cases
  7. Compressing
  8. Availability
  9. Using NavigationTiming Data
  10. Conclusion
  11. Updates

Introduction

UserTiming is a specification developed by the W3C Web Performance working group, with the goal of giving the developer a standardized interface to log timestamps ("marks") and durations ("measures").

UserTiming utilizes the PerformanceTimeline that we saw in ResourceTiming, but all of the UserTiming events are put there by the you the developer (or the third-party scripts you’ve included in the page).

UserTiming Level 1 and Level 2 are both a Recommendation, which means that browser vendors are encouraged to implement it. Level 3 adds additional features and is in development.

As of May 2021, 96.6% of the world-wide browser market-share support UserTiming.

How was it done before?

Prior to UserTiming, developers have been keeping track of performance metrics, such as logging timestamps and event durations by using simple JavaScript:

var start = new Date().getTime();
// do stuff
var now = new Date().getTime();
var duration = now - start;

What’s wrong with this?

Well, nothing really, but… we can do better.

First, as discussed previously, Date().getTime() is not reliable and DOMHighResTimestamps should be used instead (e.g. performance.now()).

Second, by logging your performance metrics into the standard interface of UserTiming, browser developer tools and third-party analytics services will be able to read and understand your performance metrics.

Marks and Measures

Developers generally use two core ideas to profile their code. First, they keep track of timestamps for when events happen. They may log these timestamps (e.g. via Date().getTime()) into JavaScript variables to be used later.

Second, developers often keep track of durations of events. This is often done by taking the difference of two timestamps.

Timestamps and durations correspond to "marks" and "measures" in UserTiming terms. A mark is a timestamp, in DOMHighResTimeStamp format. A measure is a duration, the difference between two marks, also measured in milliseconds.

How to use

Creating a mark or measure is done via the window.performance interface:

partial interface Performance {
    void mark(DOMString markName);

    void clearMarks(optional  DOMString markName);

    void measure(DOMString measureName, optional DOMString startMark,
        optional DOMString endMark);

    void clearMeasures(optional DOMString measureName);
};

interface PerformanceEntry {
  readonly attribute DOMString name;
  readonly attribute DOMString entryType;
  readonly attribute DOMHighResTimeStamp startTime;
  readonly attribute DOMHighResTimeStamp duration;
};

interface PerformanceMark : PerformanceEntry { };

interface PerformanceMeasure : PerformanceEntry { };

A mark (PerformanceMark) is an example of a PerformanceEntry, with no additional attributes:

  • name is the mark’s name
  • entryType is "mark"
  • startTime is the time the mark was created
  • duration is always 0

A measure (PerformanceMeasure) is also an example of a PerformanceEntry, with no additional attributes:

  • name is the measure’s name
  • entryType is "measure"
  • startTime is the startTime of the start mark
  • duration is the difference between the startTime of the start and end mark

Example Usage

Let’s start by logging a couple marks (timestamps):

// mark
performance.mark("start"); 
// -> {"name": "start", "entryType": "mark", "startTime": 1, "duration": 0}

performance.mark("end"); 
// -> {"name": "end", "entryType": "mark", "startTime": 2, "duration": 0}

performance.mark("another"); 
// -> {"name": "another", "entryType": "mark", "startTime": 3, "duration": 0}
performance.mark("another"); 
// -> {"name": "another", "entryType": "mark", "startTime": 4, "duration": 0}
performance.mark("another"); 
// -> {"name": "another", "entryType": "mark", "startTime": 5, "duration": 0}

Later, you may want to compare two marks (start vs. end) to create a measure (called diff), such as:

performance.measure("diff", "start", "end");
// -> {"name": "diff", "entryType": "measure", "startTime": 1, "duration": 1}

Note that measure() always calculates the difference by taking the latest timestamp that was seen for a mark. So if you did a measure against the another marks in the example above, it will take the timestamp of the third call to mark("another"):

performance.measure("diffOfAnother", "start", "another");
// -> {"name": "diffOfAnother", "entryType": "measure", "startTime": 1, "duration": 4}

There are many ways to create a measure:

  • If you call measure(name), the startTime is assumed to be window.performance.timing.navigationStart and the endTime is assumed to be now.
  • If you call measure(name, startMarkName), the startTime is assumed to be startTime of the given mark’s name and the endTime is assumed to be now.
  • If you call measure(name, startMarkName, endMarkName), the startTime is assumed to be startTime of the given start mark’s name and the endTime is assumed to be the startTime of the given end mark’s name.

Some examples of using measure():

// log the beginning of our task (assuming now is '1')
performance.mark("start");
// -> {"name": "start", "entryType": "mark", "startTime": 1, "duration": 0}

// do work (assuming now is '2')
performance.mark("start2");
// -> {"name": "start2", "entryType": "mark", "startTime": 2, "duration": 0}

// measure from navigationStart to now (assuming now is '3')
performance.measure("time to get to this point");
// -> {"name": "time to get to this point", "entryType": "measure", "startTime": 0, "duration": 3}

// measure from "now" to the "start" mark (assuming now is '4')
performance.measure("time to do stuff", "start");
// -> {"name": "time to do stuff", "entryType": "measure", "startTime": 1, "duration": 3}

// measure from "start2" to the "start" mark
performance.measure("time from start to start2", "start", "start2");
// -> {"name": "time from start to start2", "entryType": "measure", "startTime": 1, "duration": 1}

Once a mark or measure has been created, you can query for all marks, all measures, or specific marks/measures via the PerformanceTimeline. Here’s a review of the PerformanceTimeline methods:

window.performance.getEntries();
window.performance.getEntriesByType(type);
window.performance.getEntriesByName(name, type);
  • getEntries(): Gets all entries in the timeline
  • getEntriesByType(type): Gets all entries of the specified type (eg resource, mark, measure)
  • getEntriesByName(name, type): Gets all entries with the specified name (eg URL or mark name). type is optional, and will filter the list to that type.

Here’s an example of using the PerformanceTimeline to fetch a mark:

// performance.getEntriesByType("mark");
[
    {
        "duration":0,
        "startTime":1
        "entryType":"mark",
        "name":"start"
    },
    {
        "duration":0,
        "startTime":2,
        "entryType":"mark",
        "name":"start2"
    },
    ...
]

// performance.getEntriesByName("time from start to start2", "measure");
[
    {
        "duration":1,
        "startTime":1,
        "entryType":"measure",
        "name":"time from start to start2"
    }
]

You also have the ability to clear (remove) marks and measures from the buffer:

// clears all marks
performance.clearMarks();

// clears the named marks
performance.clearMarks("my-mark");

// clears all measures
performance.clearMeasures();

// clears the named measures
performance.clearMeasures("my-measure");

You can also skip the buffer and listen for marks or measures via a PerformanceObserver:

if (typeof window.PerformanceObserver === "function") {
  var userTimings = [];

  var observer = new PerformanceObserver(function(entries) {
    Array.prototype.push.apply(userTimings, entries.getEntries());
  });

  observer.observe({entryTypes: ['mark', 'measure']});
}

Standard Mark Names

There are a couple of mark names that were at one point suggested by the W3C specification to have special meanings:

  • mark_fully_loaded: The time when the page is considered fully loaded as marked by the developer in their application
  • mark_fully_visible: The time when the page is considered completely visible to an end-user as marked by the developer in their application
  • mark_above_the_fold: The time when all of the content in the visible viewport has been presented to the end-user as marked by the developer in their application
  • mark_time_to_user_action: The time of the first user interaction with the page during or after a navigation, such as scroll or click, as marked by the developer in their application

By using these standardized names, other third-party tools could have theoretically picked up on your meanings and treated them specially (for example, by overlaying them on your waterfall).

These names were removed from the Level 2 of the spec. You can still use those names if you choose, but I’m not aware of any tools that treat them specially.

Obviously, you can use these mark names (or anything else) for anything you want, and don’t have to stick by the recommended meanings.

UserTiming3

Level 3 of the specification is still under development, but has some additional features that may be useful:

  • Ability to execute marks and measures across arbitrary timestamps
  • Support for reporting arbitrary metadata along with marks and measures

Not all browsers support Level 3. As of May 2021, the only browser that does is Chrome.

Arbitrary Timestamps

With UserTiming Level 3, you can now specify a startTime (for marks), and a start and/or end time and/or duration for measures.

For marks, this gives you finer control over the exact timestamp, instead of taking "now" as the "start" timestamp. For example, you could save a time associated with an event (via performance.now()), and you may not be sure you want to log that event as a mark until later. Later, if you create a mark for it, you can give the timestamp you had stored away:

// do something -- not sure you want to mark yet?
var weShouldMark = false;
var startTime = performance.now();
doSomeWork();

// do other things
weShouldMark = doOtherThings();

// decide you wanted to mark that start
if (weShouldMark) {
  performance.mark("work-started", {
    startTime: startTime
  });
}

For measures, you can now specify an arbitrary start, end or duration:

// specifying a start and end
performance.measure("my-custom-measure", {
  start: startTime,
  end: performance.now()
});

// specifying a duration (need to specify start or end as well)
performance.measure("my-custom-measure", {
  start: startTime,
  duration: 100 // ms
});

Arbitrary Metadata / detail

Both marks and measures now allow you to specify a detail option, which is an object that will be stored alongside the mark/measure for later retrieval. For example, if you have any metadata you want saved as part of the mark/measure, you can store it and get it later:

performance.mark("my-mark", {
  detail: {
    page: "this-page",
    component: "that-component"
  },
});

performance.getEntriesByName("my-mark")[0];
// {
//   name: "my-mark",
//   startTime: 12345,
//   duration: 0,
//   detail: { page: "this-page", component: "that-component"}
// }

Benefits

So why would you use UserTiming over just Date().getTime() or performance.now()?

First, it uses the PerformanceTimeline, so marks and measures are in the PerformanceTimeline along with other events

Second, it uses DOMHighResTimestamp instead of Date so the timestamps have sub-millisecond resolution, and are monotonically non-decreasing (so aren’t affected by the client’s clock).

Developer Tools

UserTiming marks and measures are currently available in the Chrome, Internet Explorer Developer Tools.

For Chrome, they are in Performance traces under Timings:

UserTiming in Chrome Dev Tools

For IE, they are called User marks and are shown as upside-down red triangles below:

UserTiming in IE F12 Dev Tools

They are not yet shown in Firefox or Safari.

Use Cases

How could you use UserTiming? Here are some ideas:

  • Any place that you’re already logging timestamps or calculating durations could be switched to UserTiming
  • Easy way to add profiling events to your application
  • Note important scenario durations in your Performance Timeline
  • Measure important durations for analytics

Compressing

If you’re adding UserTiming instrumentation to your page, you probably also want to consume it. One way is to grab everything, package it up, and send it back to your own server for analysis.

In my UserTiming Compression article, I go over a couple ways of how to do this. Versus just sending the UserTiming JSON, usertiming-compression.js can reduce the byte size down to just 10-15% of the original.

Availability

UserTiming is available in most modern browsers. According to caniuse.com 96.6% of world-wide browser market share supports ResourceTiming, as of May 2021. This includes Internet Explorer 10+, Firefox 38+, Chrome 25+, Opera 15+, Safari 11+ and Android Browser 4.4+.

CanIUse - UserTiming

If you want to use UserTiming for everything, there are polyfills available that work 100% reliably in all browsers.

I have one such polyfill, UserTiming.js, available on Github.

DIY / Open Source / Commercial

If you want to use UserTiming, you could easily compress and beacon the data to your back-end for processing.

WebPageTest sends UserTiming to Google Analytics, Boomerang and Akamai mPulse:

WebPageTest UserTiming

Akamai mPulse collects UserTiming information for any Custom Timers you specify (I work at Akamai, on mPulse and Boomerang):

Akamai mPulse

Conclusion

UserTiming is a great interface to log your performance metrics into a standardized interface. As more services and browsers support UserTiming, you will be able to see your data in more and more places.

That wraps up our talk about how to monitor and measure the performance of your web apps. Hope you enjoyed it.

Other articles in this series:

More resources:

Updates

  • 2015-12-01: Added Compressing section
  • 2021-05:
    • Updated caniuse.com market share
    • Added example usage via PerformanceObserver
    • Added details about Level 3 usage (arbitrary timestamps and details)
    • Added a Table of Contents
    • Updated Standard Mark Names section about deprecation

ResourceTiming in Practice

May 28th, 2015

Last updated: May 2021

Table Of Contents

  1. Introduction
  2. How was it done before?
  3. How to use
    3.1 Interlude: PerformanceTimeline
    3.2 ResourceTiming
    3.3 Initiator Types
    3.4 What Resources are Included
    3.5 Crawling IFRAMEs
    3.6 Cached Resources
    3.7 304 Not Modified
    3.8 The ResourceTiming Buffer
    3.9 Timing-Allow-Origin
    3.10 Blocking Time
    3.11 Content Sizes
    3.12 Service Workers
    3.13 Compressing ResourceTiming Data
    3.14 PerformanceObserver
  4. Use Cases
    4.1 DIY and Open-Source
    4.2 Commercial Solutions
  5. Availability
  6. Tips
  7. Browser Bugs
  8. Conclusion
  9. Updates

1. Introduction

ResourceTiming is a specification developed by the W3C Web Performance working group, with the goal of exposing accurate performance metrics about all of the resources downloaded during the page load experience, such as images, CSS and JavaScript.

ResourceTiming builds on top of the concepts of NavigationTiming and provides many of the same measurements, such as the timings of each resource’s DNS, TCP, request and response phases, along with the final "loaded" timestamp.

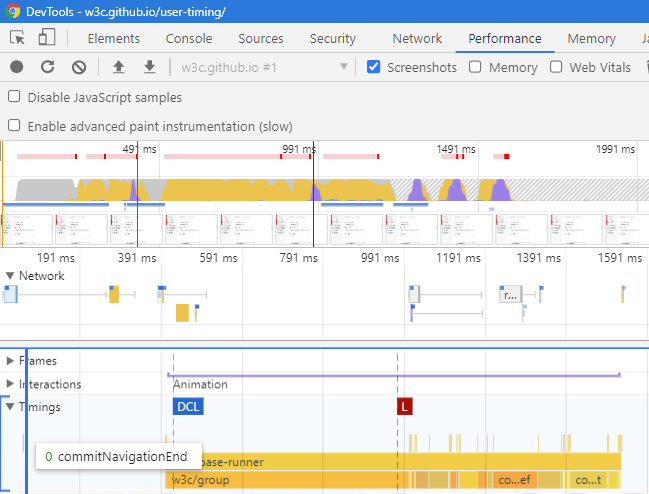
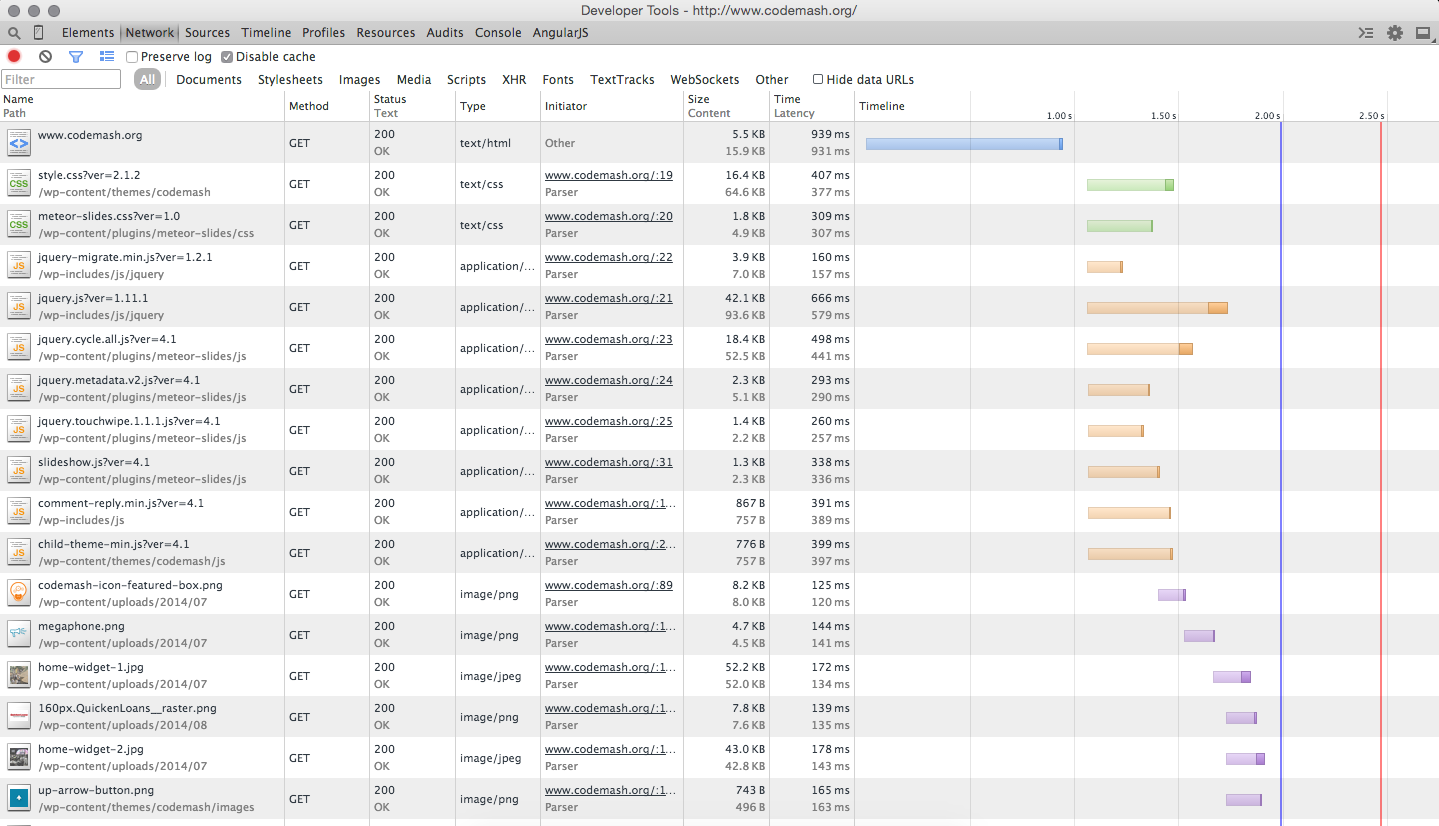
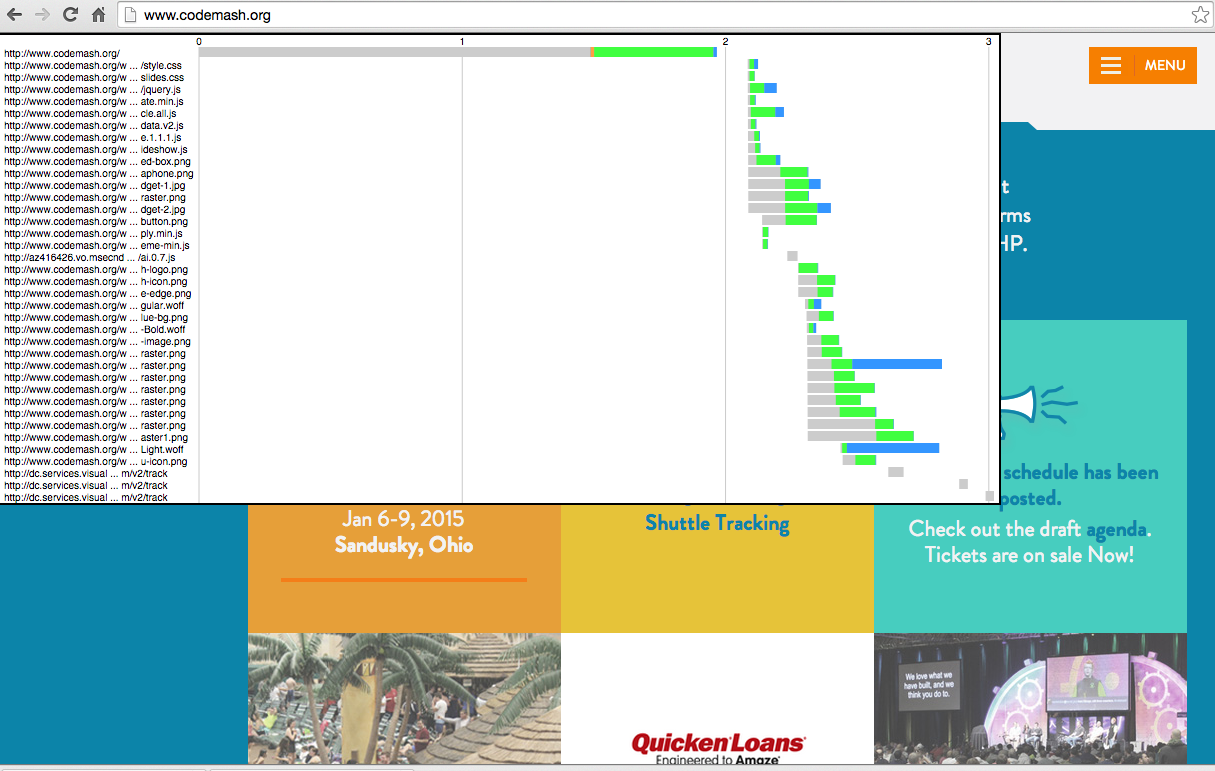
ResourceTiming takes its inspiration from resource Waterfalls. If you’ve ever looked at the Networking tab in Internet Explorer, Chrome or Firefox developer tools, you’ve seen a Waterfall before. A Waterfall shows all of the resources fetched from the network in a timeline, so you can quickly visualize any issues. Here’s an example from the Chrome Developer Tools:

ResourceTiming inspiration

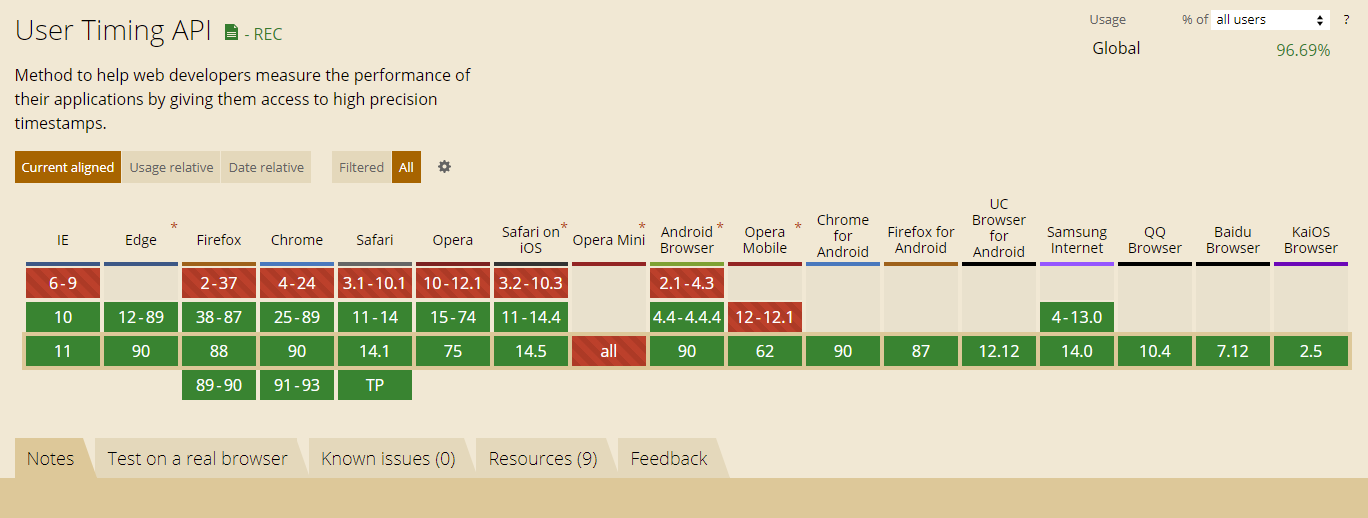
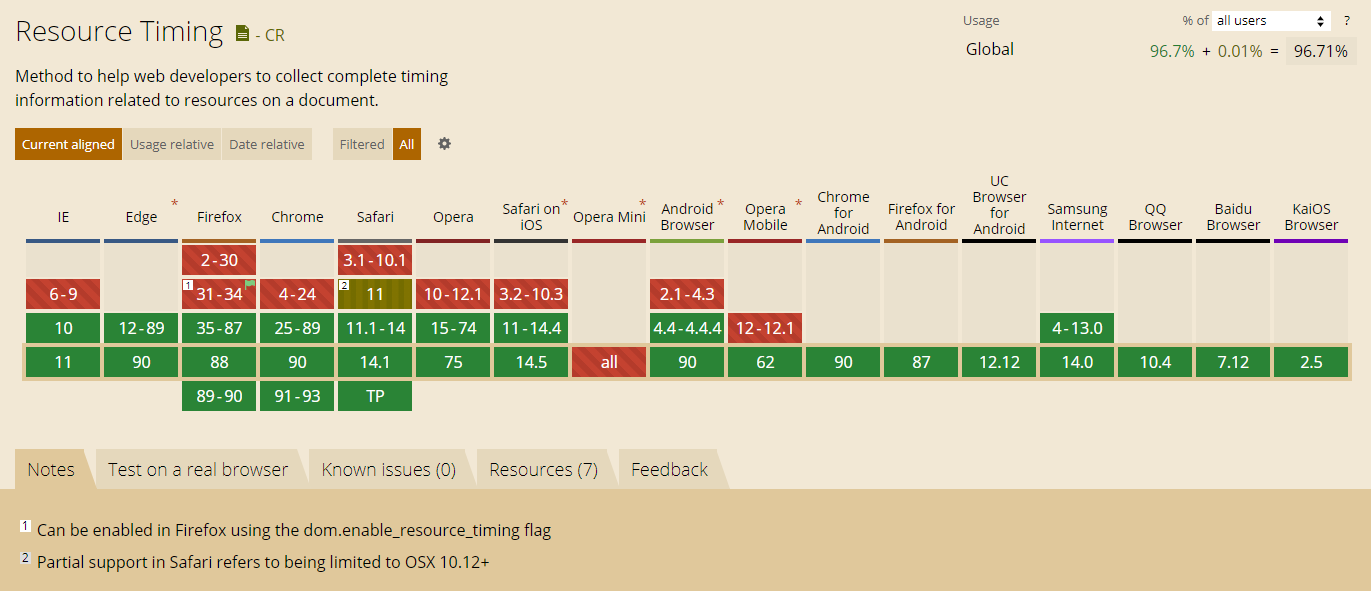
ResourceTiming (Level 1) is a Candidate Recommendation, which means it has been shipped in major browsers. ResourceTiming (Level 2) is a Working Draft and adds additional features like content sizes and new attributes. It is still a work-in-progress, but many browsers already support it.

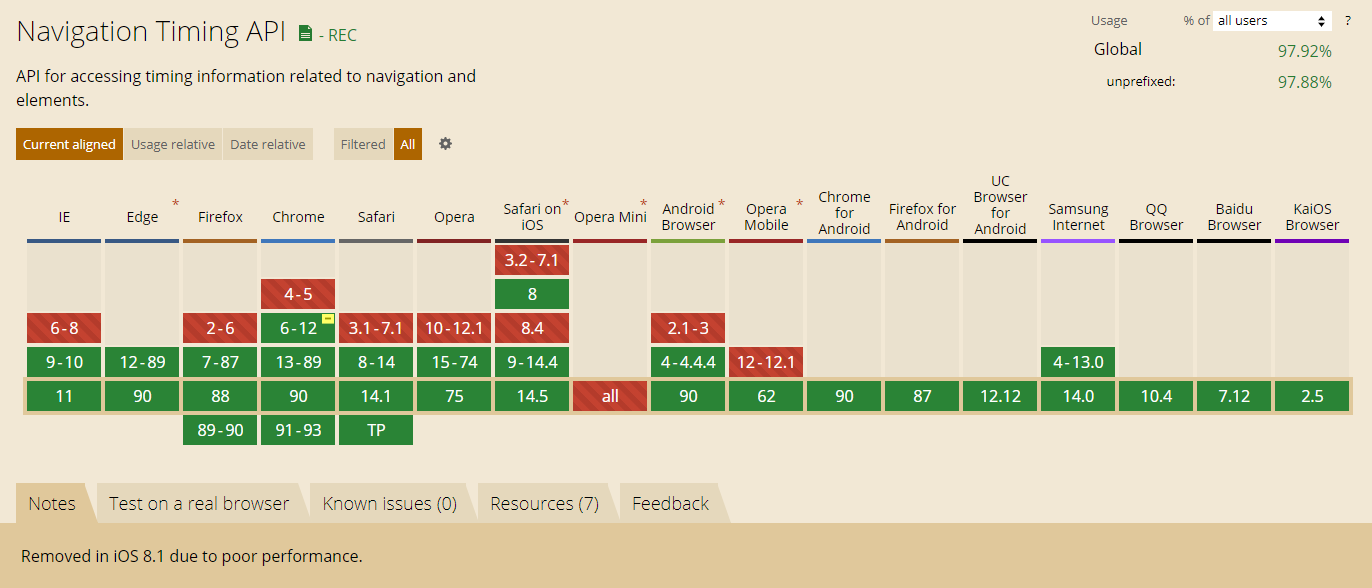
As of May 2021, 96.7% of the world-wide browser market-share supports ResourceTiming.

How was it done before?

Prior to ResourceTiming, you could measure the time it took to download resources on your page by hooking into the associated element’s onload event, such as for Images.

Take this example code:

var start = new Date().getTime();
var image1 = new Image();

image1.onload = function() {
    var now = new Date().getTime();
    var latency = now - start;
    alert("End to end resource fetch: " + latency);
};
image1.src = 'http://foo.com/image.png';

With the code above, the image is inserted into the DOM when the script runs, at which point it sets the start variable to the current time. The image’s onload event calculates how long it took for the resource to be fetched.

While this is one method for measuring the download time of an image, it’s not very practical.

First of all, it only measures the end-to-end download time, plus any overhead required for the browser to fire the onload callback. For images, this could also include the time it takes to parse and render the image. You cannot get a breakdown of DNS, TCP, SSL, request or response times with this method.

Another issue is with the use of Date.getTime(), which has some major drawbacks. See our discussion on DOMHighResTimeStamp in the NavigationTiming discussion for more details.

Most importantly, to use this method you have to construct your entire web app dynamically, at runtime. Dynamically adding all of the elements that would trigger resource fetches in <script> tags is not practical, nor performant. You would have to insert all <img>, <link rel="stylesheet">, and <script> tags to instrument everything. Doing this via JavaScript is not performant, and the browser cannot pre-fetch resources that would have otherwise been in the HTML.

Finally, it’s impossible to measure all resources that are fetched by the browser using this method. For example, it’s not possible to hook into stylesheets or fonts defined via @import or @font-face statements.

ResourceTiming addresses all of these problems.

How to use

ResourceTiming data is available via several methods on the window.performance interface:

window.performance.getEntries();
window.performance.getEntriesByType(type);
window.performance.getEntriesByName(name, type);

Each of these functions returns a list of PerformanceEntrys. getEntries() will return a list of all entries in the PerformanceTimeline (see below), while if you use getEntriesByType("resource") or getEntriesByName("foo", "resource"), you can limit your query to just entries of the type PerformanceResourceTiming, which inherits from PerformanceEntry.

That may sound confusing, but when you look at the array of ResourceTiming objects, they’ll simply have a combination of the attributes below. Here’s the WebIDL (definition) of a PerformanceEntry:

interface PerformanceEntry {
    readonly attribute DOMString name;
    readonly attribute DOMString entryType;

    readonly attribute DOMHighResTimeStamp startTime;
    readonly attribute DOMHighResTimeStamp duration;
};

Each PerformanceResourceTiming is a PerformanceEntry, so has the above attributes, as well as the attributes below:

[Exposed=(Window,Worker)]
interface PerformanceResourceTiming : PerformanceEntry {
    readonly attribute DOMString           initiatorType;
    readonly attribute DOMString           nextHopProtocol;
    readonly attribute DOMHighResTimeStamp workerStart;
    readonly attribute DOMHighResTimeStamp redirectStart;
    readonly attribute DOMHighResTimeStamp redirectEnd;
    readonly attribute DOMHighResTimeStamp fetchStart;
    readonly attribute DOMHighResTimeStamp domainLookupStart;
    readonly attribute DOMHighResTimeStamp domainLookupEnd;
    readonly attribute DOMHighResTimeStamp connectStart;
    readonly attribute DOMHighResTimeStamp connectEnd;
    readonly attribute DOMHighResTimeStamp secureConnectionStart;
    readonly attribute DOMHighResTimeStamp requestStart;
    readonly attribute DOMHighResTimeStamp responseStart;
    readonly attribute DOMHighResTimeStamp responseEnd;
    readonly attribute unsigned long long  transferSize;
    readonly attribute unsigned long long  encodedBodySize;
    readonly attribute unsigned long long  decodedBodySize;
    serializer = {inherit, attribute};
};

Interlude: PerformanceTimeline

The PerformanceTimeline is a critical part of ResourceTiming, and one interface that you can use to fetch ResourceTiming data, as well as other performance information, such as UserTiming data. See also the section on the PerformanceObserver for another way of consuming ResourceTiming data.

The methods getEntries(), getEntriesByType() and getEntriesByName() that you saw above are the primary interfaces of the PerformanceTimeline. The idea is to expose all browser performance information via a standard interface.

All browsers that support ResourceTiming (or UserTiming) will also support the PerformanceTimeline.

Here are the primary methods:

  • getEntries(): Gets all entries in the timeline
  • getEntriesByType(type): Gets all entries of the specified type (eg resource, mark, measure)
  • getEntriesByName(name, type): Gets all entries with the specified name (eg URL or mark name). type is optional, and will filter the list to that type.

We’ll use the PerformanceTimeline to fetch ResourceTiming data (and UserTiming data).

Back to ResourceTiming

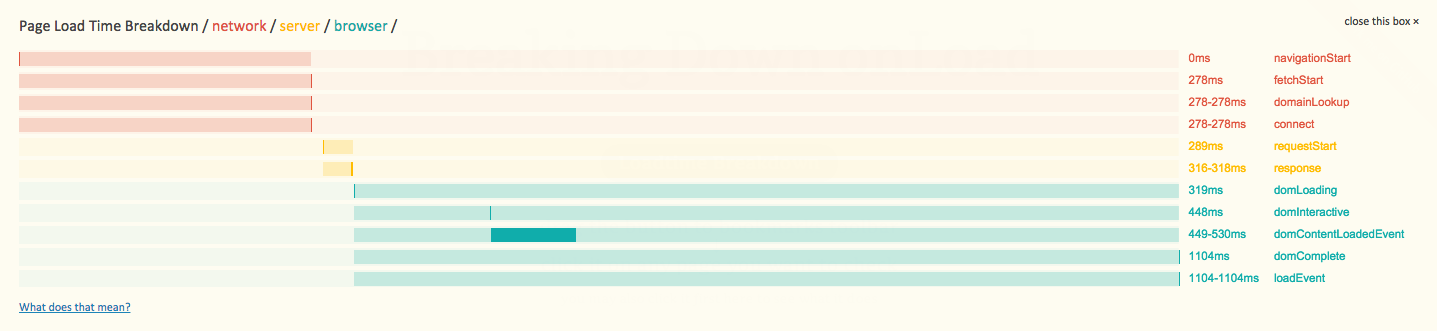
ResourceTiming takes its inspiration from the NavigationTiming timeline.

Here are the phases a single resource would go through during the fetch process:

ResourceTiming timeline

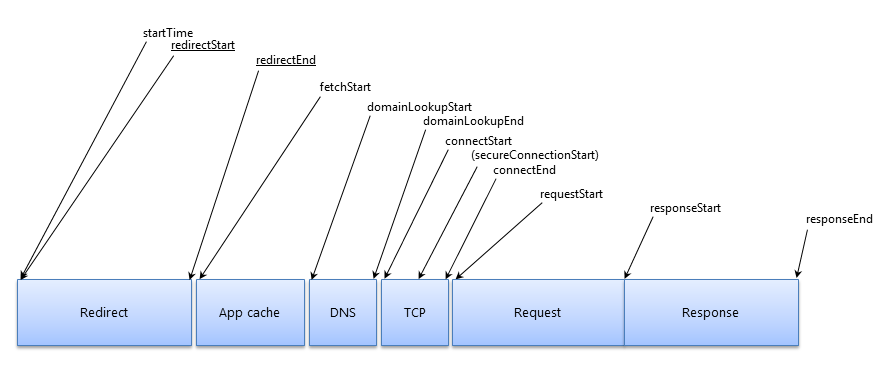
To fetch all of the resources on a page, you simply call one of the PerformanceTimeline methods:

var resources = window.performance.getEntriesByType("resource");

/* eg:
[
    {
        name: "https://www.foo.com/foo.png",

        entryType: "resource",

        startTime: 566.357000003336,
        duration: 4.275999992387369,

        initiatorType: "img",
        nextHopProtocol: "h2",

        workerStart: 300.0,
        redirectEnd: 0,
        redirectStart: 0,
        fetchStart: 566.357000003336,
        domainLookupStart: 566.357000003336,
        domainLookupEnd: 566.357000003336,
        connectStart: 566.357000003336,
        secureConnectionStart: 0,
        connectEnd: 566.357000003336,
        requestStart: 568.4959999925923,
        responseStart: 569.4220000004862,
        responseEnd: 570.6329999957234,

        transferSize: 1000,
        encodedBodySize: 1000,
        decodedBodySize: 1000,
    }, ...
]
*/

Please note that all of the timestamps are DOMHighResTimeStamps, so they are relative to window.performance.timing.navigationStart or window.performance.timeOrigin. Thus a value of 500 means 500 milliseconds after the page load started.

Here is a description of all of the ResourceTiming attributes:

  • name is the fully-resolved URL of the attribute (relative URLs in your HTML will be expanded to include the full protocol, domain name and path)
  • entryType will always be "resource" for ResourceTiming entries
  • startTime is the time the resource started being fetched (e.g. offset from the performance.timeOrigin)
  • duration is the overall time required to fetch the resource
  • initiatorType is the localName of the element that initiated the fetch of the resource (see details below)
  • nextHopProtocol: ALPN Protocol ID such as http/0.9 http/1.0 http/1.1 h2 hq spdy/3 (ResourceTiming Level 2)
  • workerStart is the time immediately before the active Service Worker received the fetch event, if a ServiceWorker is installed
  • redirectStart and redirectEnd encompass the time it took to fetch any previous resources that redirected to the final one listed. If either timestamp is 0, there were no redirects, or one of the redirects wasn’t from the same origin as this resource.
  • fetchStart is the time this specific resource started being fetched, not including redirects
  • domainLookupStart and domainLookupEnd are the timestamps for DNS lookups
  • connectStart and connectEnd are timestamps for the TCP connection
  • secureConnectionStart is the start timestamp of the SSL handshake, if any. If the connection was over HTTP, or if the browser doesn’t support this timestamp (eg. Internet Explorer), it will be 0.
  • requestStart is the timestamp that the browser started to request the resource from the remote server
  • responseStart and responseEnd are the timestamps for the start of the response and when it finished downloading
  • transferSize: Bytes transferred for the HTTP response header and content body (ResourceTiming Level 2)
  • decodedBodySize: Size of the body after removing any applied content-codings (ResourceTiming Level 2)
  • encodedBodySize: Size of the body after prior to removing any applied content-codings (ResourceTiming Level 2)

duration includes the time it took to fetch all redirected resources (if any) as well as the final resource. To track the overall time it took to fetch just the final resource, you may want to use (responseEndfetchStart).

ResourceTiming does not (yet) include attributes that expose the HTTP status code of the resource (for privacy concerns).

Initiator Types

initiatorType is the localName of the element that fetched the resource — in other words, the name of the associated HTML element.

The most common values seen for this attribute are:

  • img
  • link
  • script
  • css: url(), @import
  • xmlhttprequest
  • iframe (known as subdocument in some versions of IE)
  • body
  • input
  • frame
  • object
  • image
  • beacon
  • fetch
  • video
  • audio
  • source
  • track
  • embed
  • eventsource
  • navigation
  • other
  • use

It’s important to note the initiatorType is not a "Content Type". It is the element that triggered the fetch, not the type of content fetched.

As an example, some of the above values can be confusing at first glance. For example, A .css file may have an initiatorType of "link" or "css" because it can either be fetched via a <link> tag or via an @import in a CSS file. While an initiatorType of "css" might actually be a foo.jpg image, because CSS fetched an image.

The iframe initiator type is for <IFRAME>s on the page, and the duration will be how long it took to load that frame’s HTML (e.g. how long it took for responseEnd of the HTML). It will not include the time it took for the <IFRAME> itself to fire its onload event, so resources fetched within the <IFRAME> will not be represented in an iframe‘s duration. (Example test case)

Here’s a list of common HTML elements and JavaScript APIs and what initiatorType they should map to:

  • <img src="...">: img
  • <img srcset="...">: img
  • <link rel="stylesheet" href="...">: link
  • <link rel="prefetch" href="...">: link
  • <link rel="preload" href="...">: link
  • <link rel="prerender" href="...">: link
  • <link rel="manfiest" href="...">: link
  • <script src="...">: script
  • CSS @font-face { src: url(...) }: css
  • CSS background: url(...): css
  • CSS @import url(...): css
  • CSS cursor: url(...): css
  • CSS list-style-image: url(...): css
  • <body background=''>: body
  • <input src=''>: input
  • XMLHttpRequest.open(...): xmlhttprequest
  • <iframe src="...">: iframe
  • <frame src="...">: frame
  • <object>: object
  • <svg><image xlink:href="...">: image
  • <svg><use>: use
  • navigator.sendBeacon(...): beacon
  • fetch(...): fetch
  • <video src="...">: video
  • <video poster="...">: video
  • <video><source src="..."></video>: source
  • <audio src="...">: audio
  • <audio><source src="..."></audio>: source
  • <picture><source srcset="..."></picture>: source
  • <picture><img src="..."></picture>: img
  • <picture><img srcsec="..."></picture>: img
  • <track src="...">: track
  • <embed src="...">: embed
  • favicon.ico: link
  • EventSource: eventsource

Not all browsers correctly report the initiatorType for the above resources. See this web-platform-tests test case for details.

What Resources are Included

All of the resources that your browser fetches to construct the page should be listed in the ResourceTiming data. This includes, but is not limited to images, scripts, css, fonts, videos, IFRAMEs and XHRs.

Some browsers (eg. Internet Explorer) may include other non-fetched resources, such as about:blank and javascript: URLs in the ResourceTiming data. This is likely a bug and may be fixed in upcoming versions, but you may want to filter out non-http: and https: protocols.

Additionally, some browser extensions may trigger downloads and thus you may see some of those downloads in your ResourceTiming data as well.

Not all resources will be fetched successfully. There might have been a networking error, due to a DNS, TCP or SSL/TLS negotiation failure. Or, the server might return a 4xx or 5xx response. How this information is surfaced in ResourceTiming depends on the browser:

  • DNS failure (cross-origin)
    • Chrome <= 78: No ResourceTiming entry
    • Chrome >= 79: domainLookupStart through responseStart are 0. responseEnd and duration are non-zero.
    • Internet Explorer: domainLookupStart through responseStart are 0. responseEnd and duration are non-zero.
    • Edge: domainLookupStart through responseStart are 0. responseEnd and duration are non-zero.
    • Firefox: domainLookupStart through responseStart are 0. duration is 0 in some cases. responseEnd is non-zero.
    • Safari: No ResourceTiming entry
  • TCP failure (cross-origin)
    • Chrome <= 78: No ResourceTiming entry
    • Chrome >= 79: domainLookupStart through responseStart are 0. responseEnd and duration are non-zero.
    • Internet Explorer: domainLookupStart through responseStart are 0. responseEnd and duration are non-zero.
    • Edge: domainLookupStart through responseStart are 0. responseEnd and duration are non-zero.
    • Firefox: domainLookupStart through responseStart and duration are 0. responseEnd is non-zero.
    • Safari: No ResourceTiming entry
  • SSL failure (cross-origin)
    • Chrome <= 78: No ResourceTiming entry
    • Chrome >= 79: domainLookupStart through responseStart are 0. responseEnd and duration are non-zero.
    • Internet Explorer: domainLookupStart through responseStart are 0. responseEnd and duration are non-zero.
    • Edge: domainLookupStart through responseStart are 0. responseEnd and duration are non-zero.
    • Firefox: domainLookupStart through responseStart and duration are 0. responseEnd is non-zero.
    • Safari: No ResourceTiming entry
  • 4xx/5xx response (same-origin)
    • Chrome <= 78: No ResourceTiming entry
    • Chrome >= 79: All timestamps are non-zero.
    • Internet Explorer: All timestamps are non-zero.
    • Edge: All timestamps are non-zero.
    • Firefox: All timestamps are non-zero.
    • Safari <= 12: No ResourceTiming entry.
    • Safari >= 13: All timestamps are non-zero.
  • 4xx/5xx response (cross-origin)
    • Chrome <= 78: No ResourceTiming entry
    • Chrome >= 79: All timestamps are non-zero.
    • Internet Explorer: startTime, fetchStart, responseEnd and duration are non-zero.
    • Edge: startTime, fetchStart, responseEnd and duration are non-zero.
    • Firefox: startTime, fetchStart, responseEnd and duration are non-zero.
    • Safari <= 12: No ResourceTiming entry.
    • Safari >= 13: All timestamps are non-zero.

The working group is attempting to get these behaviors more consistent across browsers. You can read this post for further details as well as inconsistencies found. See the browser bugs section for relevant bugs.

Note that the root page (your HTML) is not included in ResourceTiming. You can get all of that data from NavigationTiming.

An additional set of resources that may also be missing from ResourceTiming are resources fetched by cross-origin stylesheets fetched with no-cors policy.

There are a few additional reasons why a resource might not be in the ResourceTiming data. See the Crawling IFRAMEs and Timing-Allow-Origin sections for more details, or read the ResourceTiming Visibility post for an in-depth look.

Crawling IFRAMEs

There are two important caveats when working with ResourceTiming data:

  1. Each <IFRAME> on the page will only report on its own resources, so you must look at every frame’s performance.getEntriesByType("resource")
  2. You cannot access frame.performance.getEntriesByType() in a cross-origin frame

If you want to capture all of the resources that were fetched for a page load, you need to crawl all of the frames on the page (and sub-frames, etc), and join their entries to the main window’s.

This gist shows a naive way of crawling all frames. For a version that deals with all of the complexities of the crawl, such as adjusting resources in each frame to the correct startTime, you should check out Boomerang’s restiming.js plugin.

However, even if you attempt to crawl all frames on the page, many pages include third-party scripts, libraries, ads, and other content that loads within cross-origin frames. We have no way of accessing the ResourceTiming data from these frames. Over 30% of resources in the Alexa Top 1000 are completely invisible to ResourceTiming because they’re loaded in a cross-origin frame.

Please see my in-depth post on ResourceTiming Visibility for details on how this might affect you, and suggested workarounds.

Cached Resources

Cached resources will show up in ResourceTiming right along side resources that were fetched from the network.

For browsers that do not support ResourceTiming Level 2 with the content size attributes, there’s no direct indicator for the resource that it was served from the cache. In practice, resources with a very short duration (say under 30 milliseconds) are likely to have been served from the browser’s cache. They might take a few milliseconds due to disk latencies.

Browsers that support ResourceTiming Level 2 expose the content size attributes, which gives us a lot more information about the cache state of each resource. We can look at transferSize to determine cache hits.

Here is example code to determine cache hit status:

function isCacheHit() {
  // if we transferred bytes, it must not be a cache hit
  // (will return false for 304 Not Modified)
  if (transferSize > 0) return false;

  // if the body size is non-zero, it must mean this is a
  // ResourceTiming2 browser, this was same-origin or TAO,
  // and transferSize was 0, so it was in the cache
  if (decodedBodySize > 0) return true;

  // fall back to duration checking (non-RT2 or cross-origin)
  return duration < 30;
}

This algorithm isn’t perfect, but probably covers 99% of cases.

Note that conditional validations that return a 304 Not Modifed would be considered a cache miss with the above algorithm.

304 Not Modified

Conditionally fetched resources (with an If-Modified-Since or Etag header) might return a 304 Not Modified response.

In this case, the tranferSize might be small because it just reflects the 304 Not Modified response and no content body. transferSize might be less than the encodedBodySize in this case.

encodedBodySize and decodedBodySize should be the body size of the previously-cached resource.

(there is a Chrome 65 browser bug that might result in the encodedBodySize and decodedBodySize being 0)

Here is example code to detect 304s:

function is304() {
  if (encodedBodySize > 0 &&
      tranferSize > 0 &&
      tranferSize < encodedBodySize) {
    return true;
  }

  // unknown
  return null;
}

The ResourceTiming Buffer

There is a ResourceTiming buffer (per document / IFRAME) that stops filling after its limit is reached. By default, all modern browsers (except Internet Explorer / Edge) currently set this limit to 150 entries (per frame). Internet Explorer 10+ and Edge default to 500 entries (per frame). Some browsers may have also updated their default to 250 entries per frame.

The reasoning behind limiting the number of entries is to ensure that, for the vast majority of websites that are not consuming ResourceTiming entries, the browser’s memory isn’t consumed indefinitely holding on to a lot of this information. In addition, for sites that periodically fetch new resources (such as XHR polling), we would’t want the ResourceTiming buffer to grow unbound.

Thus, if you will be consuming ResourceTiming data, you need to have awareness of the buffer. If your site only downloads a handful of resources for each page load (< 100), and does nothing afterwards, you probably won’t hit the limit.

However, if your site downloads over a hundred resources, or you want to be able to monitor for resources fetched on an ongoing basis, you can do one of three things.

First, you can listen for the onresourcetimingbufferfull event which gets fired on the document when the buffer is full. You can then use setResourceTimingBufferSize(n) or clearResourceTimings() to resize or clear the buffer.

As an example, to keep the buffer size at 150 yet continue tracking resources after the first 150 resources were added, you could do something like this;

if ("performance" in window) {
  function onBufferFull() {
    var latestEntries = performance.getEntriesByType("resource");
    performance.clearResourceTimings();

    // analyze or beacon latestEntries, etc
  }

  performance.onresourcetimingbufferfull = performance.onwebkitresourcetimingbufferfull = onBufferFull;
}

Note onresourcetimingbufferfull is not currently supported in Internet Explorer (10, 11 or Edge).

If your site is on the verge of 150 resources, and you don’t want to manage the buffer, you could also just safely increase the buffer size to something reasonable in your HTML header:

<html><head>
<script>
if ("performance" in window 
    && window.performance 
    && window.performance.setResourceTimingBufferSize) {
    performance.setResourceTimingBufferSize(300);
}
</script>
...
</head>...

(you should do this for any <iframe> that might load more than 150 resources too)

Don’t just setResourceTimingBufferSize(99999999) as this could grow your visitors’s browser’s memory unnecessarily.

Finally, you can also use a PerformanceObserver to manage your own "buffer" of ResourceTiming data.

Note: Some browsers are starting up update the default limit of 150 resources to 250 resources instead.

Timing-Allow-Origin

A cross-origin resource is any resource that doesn’t originate from the same domain as the page. For example, if your visitor is on http://foo.com/ and you’ve fetched resources from http://cdn.foo.com or http://mycdn.com, those resources will both be considered cross-origin.

By default, cross-origin resources only expose timestamps for the following attributes:

  • startTime (will equal fetchStart)
  • fetchStart
  • responseEnd
  • duration

This is to protect your privacy (so an attacker can’t load random URLs to see where you’ve been).

This means that all of the following attributes will be 0 for cross-origin resources:

  • redirectStart
  • redirectEnd
  • domainLookupStart
  • domainLookupEnd
  • connectStart
  • connectEnd
  • secureConnectionStart
  • requestStart
  • responseStart

In addition, all size information will be 0 for cross-origin resources:

  • transferSize
  • encodedBodySize
  • decodedBodySize

In addition, cross-origin resources that redirected will have a startTime that only reflects the final resource — startTime will equal fetchStart instead of redirectStart. This means the time of any redirect(s) will be hidden from ResourceTiming.

Luckily, if you control the domains you’re fetching other resources from, you can overwrite this default precaution by sending a Timing-Allow-Origin HTTP response header:

Timing-Allow-Origin = "Timing-Allow-Origin" ":" origin-list-or-null | "*"

In practice, most people that send the Timing-Allow-Origin HTTP header just send a wildcard origin:

Timing-Allow-Origin: *

So if you’re serving any of your content from another domain name, i.e. from a CDN, it is strongly recommended that you set the Timing-Allow-Origin header for those responses.

Thankfully, third-party libraries for widgets, ads, analytics, etc are starting to set the header on their content. Only about 13% currently do, but this is growing (according to the HTTP Archive). Notably, Google, Facebook, Disqus, and mPulse send this header for their scripts.

Blocking Time

Browsers will only open a limited number of connections to each unique origin (protocol/server name/port) when downloading resources.

If there are more resources than the # of connections, the later resources will be "blocking", waiting for their turn to download.

Blocking time is generally seen as "missing periods" (non-zero durations) that occur between connectEnd and requestStart (when waiting on a Keep-Alive TCP connection to reuse), or between fetchStart and domainLookupStart (when waiting on things like the browser’s cache).

The duration attribute includes Blocking time. So in general, you may not want to use duration if you’re only interested in actual network timings.

Unfortunately, duration, startTime and responseEnd are the only attributes you get with cross-origin resources, so you can’t easily subtract out Blocking time from cross-origin resources.

To calculate Blocking time, you would do something like this:

var blockingTime = 0;
if (res.connectEnd && res.connectEnd === res.fetchStart) {
    blockingTime = res.requestStart - res.connectEnd;
} else if (res.domainLookupStart) {
    blockingTime = res.domainLookupStart - res.fetchStart;
}

Content Sizes

Beginning with ResourceTiming 2, content sizes are included for all same-origin or Timing-Allow-Origin resources:

  • transferSize: Bytes transferred for HTTP response header and content body
  • decodedBodySize: Size of the body after removing any applied content-codings
  • encodedBodySize: Size of the body after prior to removing any applied content-codings

Some notes:

  • If transferSize is 0, and timestamps like responseStart are filled in, the resource was served from the cache
  • If transferSize is 0, but timestamps like responseStart are also 0, the resource was cross-origin, so you should look at the cached state algorithm to determine its cache state
  • transferSize might be less than encodedBodySize in cases where a conditional validation occurred (e.g. 304 Not Modified). In this case, transferSize would be the size of the 304 headers, while encodedBodySize would be the size of the cached response body from the previous request.
  • If encodedBodySize and decodedBodySize are non-0 and differ, the content was compressed (e.g. gzip or Brotli)
  • encodedBodySize might be 0 in some cases (e.g. HTTP 204 (No Content) or 3XX responses)
  • See the ServiceWorker section for details when a ServiceWorker is involved

ServiceWorkers

If you are using ServiceWorkers in your app, you can get information about the time the ServiceWorker activated (fetch was fired) for each resource via the workerStart attribute.

The difference between workerStart and fetchStart is the processing time of the ServiceWorker:

var workerProcessingTime = 0;
if (res.workerStart && res.fetchStart) {
    workerProcessingTime = res.fetchStart - res.workerStart;
}

When a ServiceWorker is active for a resource, the size attributes of transferSize, encodedBodySize and decodedBodySize are under-specified, inconsistent between browsers, and will often be exactly 0 even when bytes are transferred. There is an open NavigationTiming issue tracking this. In addition, the timing attributes may be under-specified in some cases, with a separate issue tracking that.

Compressing ResourceTiming Data

The HTTP Archive tells us there are about 100 HTTP resources on average, per page, with an average URL length of 85 bytes.

On average, each resource is ~ 500 bytes when JSON.stringify()‘d.

That means you could expect around 45 KB of ResourceTiming data per page load on the "average" site.

If you’re considering beaconing ResourceTiming data back to your own servers for analysis, you may want to consider compressing it first.

There’s a couple things you can do to compress the data, and I’ve written about these methods already. I’ve shared an open-source script that can compress ResourceTiming data that looks like this:

{
    "responseEnd":323.1100000002698,
    "responseStart":300.5000000000000,
    "requestStart":252.68599999981234,
    "secureConnectionStart":0,
    "connectEnd":0,
    "connectStart":0,
    "domainLookupEnd":0,
    "domainLookupStart":0,
    "fetchStart":252.68599999981234,
    "redirectEnd":0,
    "redirectStart":0,
    "duration":71.42400000045745,
    "startTime":252.68599999981234,
    "entryType":"resource",
    "initiatorType":"script",
    "name":"http://foo.com/js/foo.js"
}

To something much smaller, like this (which contains 3 resources):

{
    "http://": {
        "foo.com/": {
            "js/foo.js": "370,1z,1c",
            "css/foo.css": "48c,5k,14"
        },
        "moo.com/moo.gif": "312,34,56"
    }
}

Overall, we can compresses ResourceTiming data down to about 15% of its original size.

Example code to do this compression is available on github.

See also the discussion on payload sizes in my Beaconing In Practice article.

PerformanceObserver

Instead of using performance.getEntriesByType("resource") to fetch all of the current resources from the ResourceTiming buffer, you could instead use a PerformanceObserver to get notified about all fetches.

Example usage:

if (typeof window.PerformanceObserver === "function") {
  var resourceTimings = [];

  var observer = new PerformanceObserver(function(entries) {
    Array.prototype.push.apply(resourceTimings, entries.getEntries());
  });

  observer.observe({entryTypes: ['resource']});
}

The benefits of using a PerformanceObserver are:

  • You have stricter control over buffering old entries (if you want to buffer at all)
  • If there are multiple scripts or libraries on the page trying to manage the ResourceTiming buffer (by setting its size or clearing it), the PerformanceObserver won’t be affected by it.

However, there are two major challenges with using a PerformanceObserver for ResourceTiming:

  • You’ll need to register the PerformanceObserver before everything else on the page, ideally via an inline-<script> tag in your page’s <head>. Otherwise, requests that fire before the PerformanceObserver initializes won’t be delivered to the callback. There is some work being done to add a buffered: true option, but it is not yet implemented in browsers. In the meantime, you could call observer.observe() and then immediately call performance.getEntriesByType("resource") to get the current buffer.
  • Since each frame on the page maintains its own buffer of ResoruceTiming entries, and its own PerformanceObserver list, you will need to register a PerformanceObserver in all frames on the page, including child frames, grandchild frames, etc. This results in a race condition, where you need to either monitor the page for all <iframe>s being created an immediately hook a PerformanceObserver in their window, or, you’ll have to crawl all of the frames later and get performance.getEntriesByType("resource") anyways. There are some thoughts about adding a bubbles: true flag to make this easier.

Use Cases

Now that ResourceTiming data is available in the browser in an accurate and reliable manner, there are a lot of things you can do with the information. Here are some ideas:

  • Send all ResourceTimings to your backend analytics
  • Raise an analytics event if any resource takes over X seconds to download (and trend this data)
  • Watch specific resources (eg third-party ads or analytics) and complain if they are slow
  • Monitor the overall health of your DNS infrastructure by beaconing DNS resolve time per-domain
  • Look for production resource errors (eg 4xx/5xx) in browsers that add errors to the buffer it (IE/Firefox)
  • Use ResourceTiming to determine your site’s "visual complete" metric by looking at timings of all above-the-fold images

The possibilities are nearly endless. Please leave a comment with how you’re using ResourceTiming data.

DIY and Open-Source

Here are several interesting DIY / open-source solutions that utilize ResourceTiming data:

Andy Davies’ Waterfall.js shows a waterfall of any page’s resources via a bookmarklet: github.com/andydavies/waterfall

Andy Davies' Waterfall.js

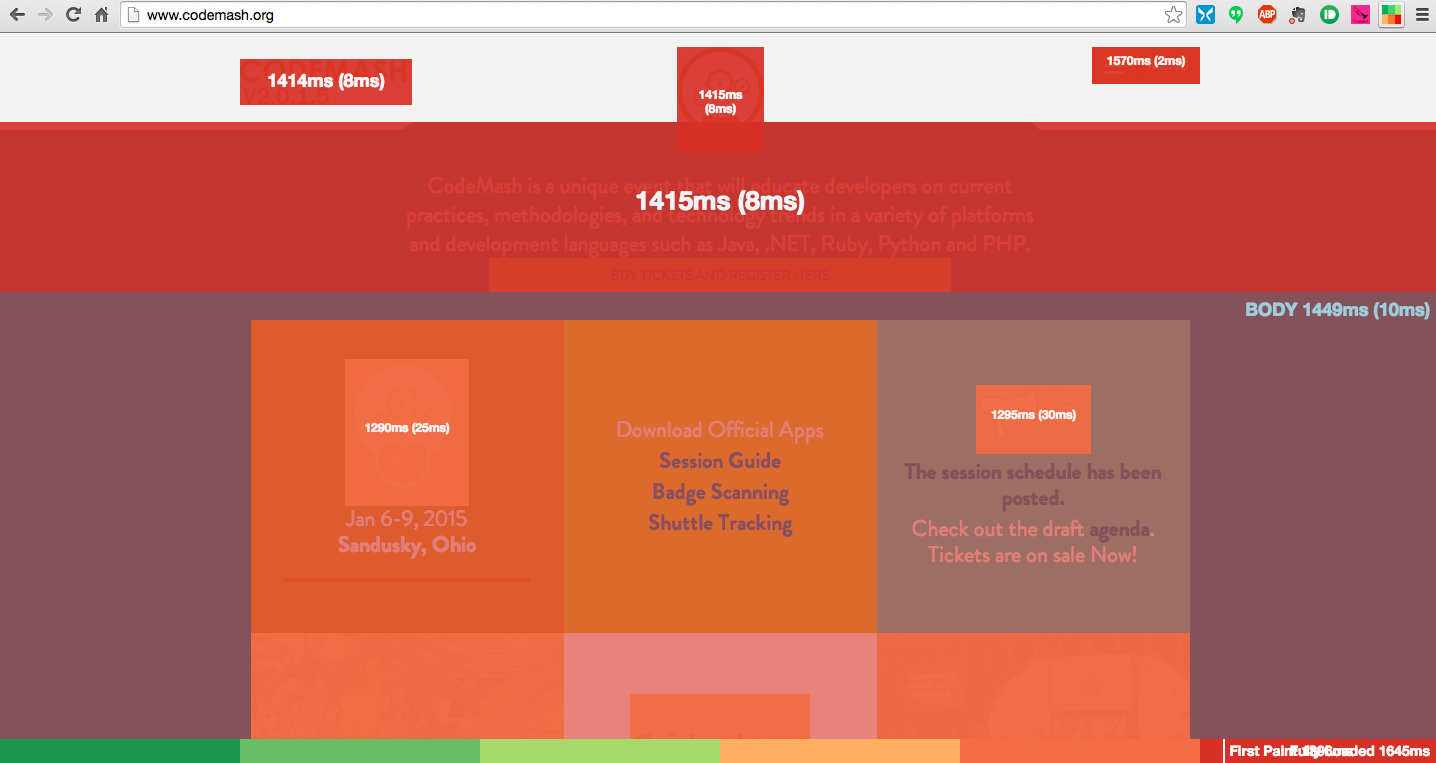
Mark Zeman’s Heatmap bookmarklet / Chrome extension gives a heatmap of when images loaded on your page: github.com/zeman/perfmap

Mark Zeman's Heatmap bookmarklet and extension

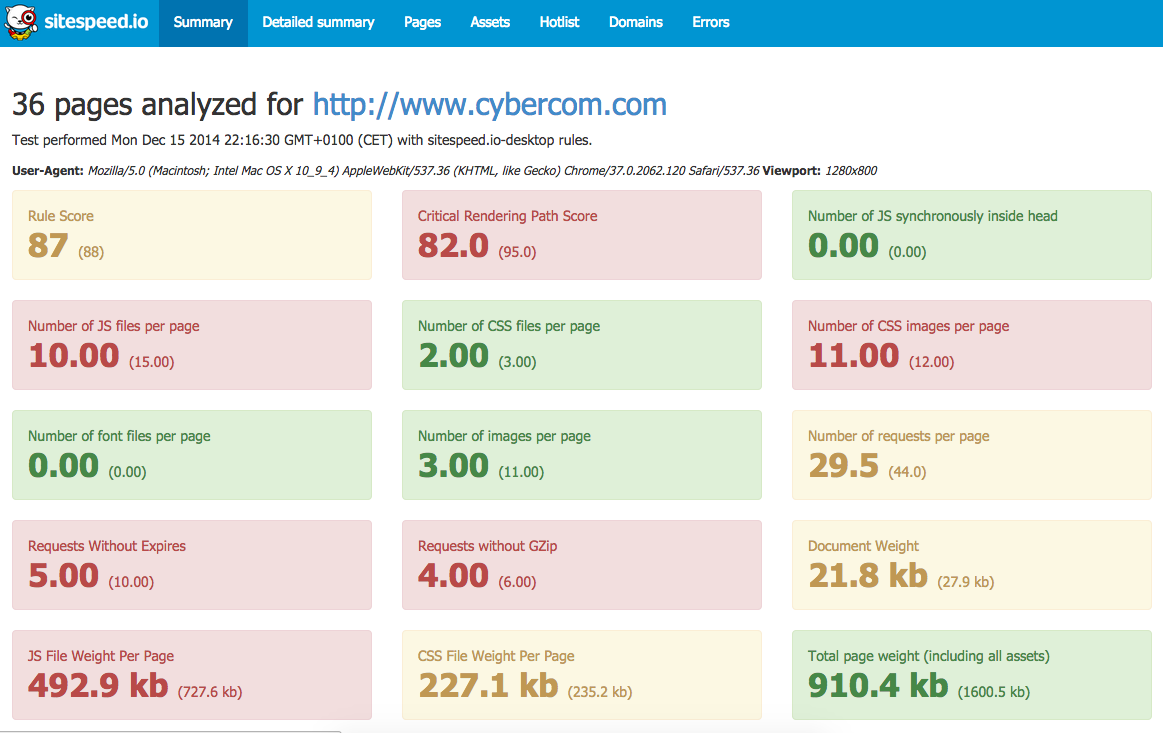
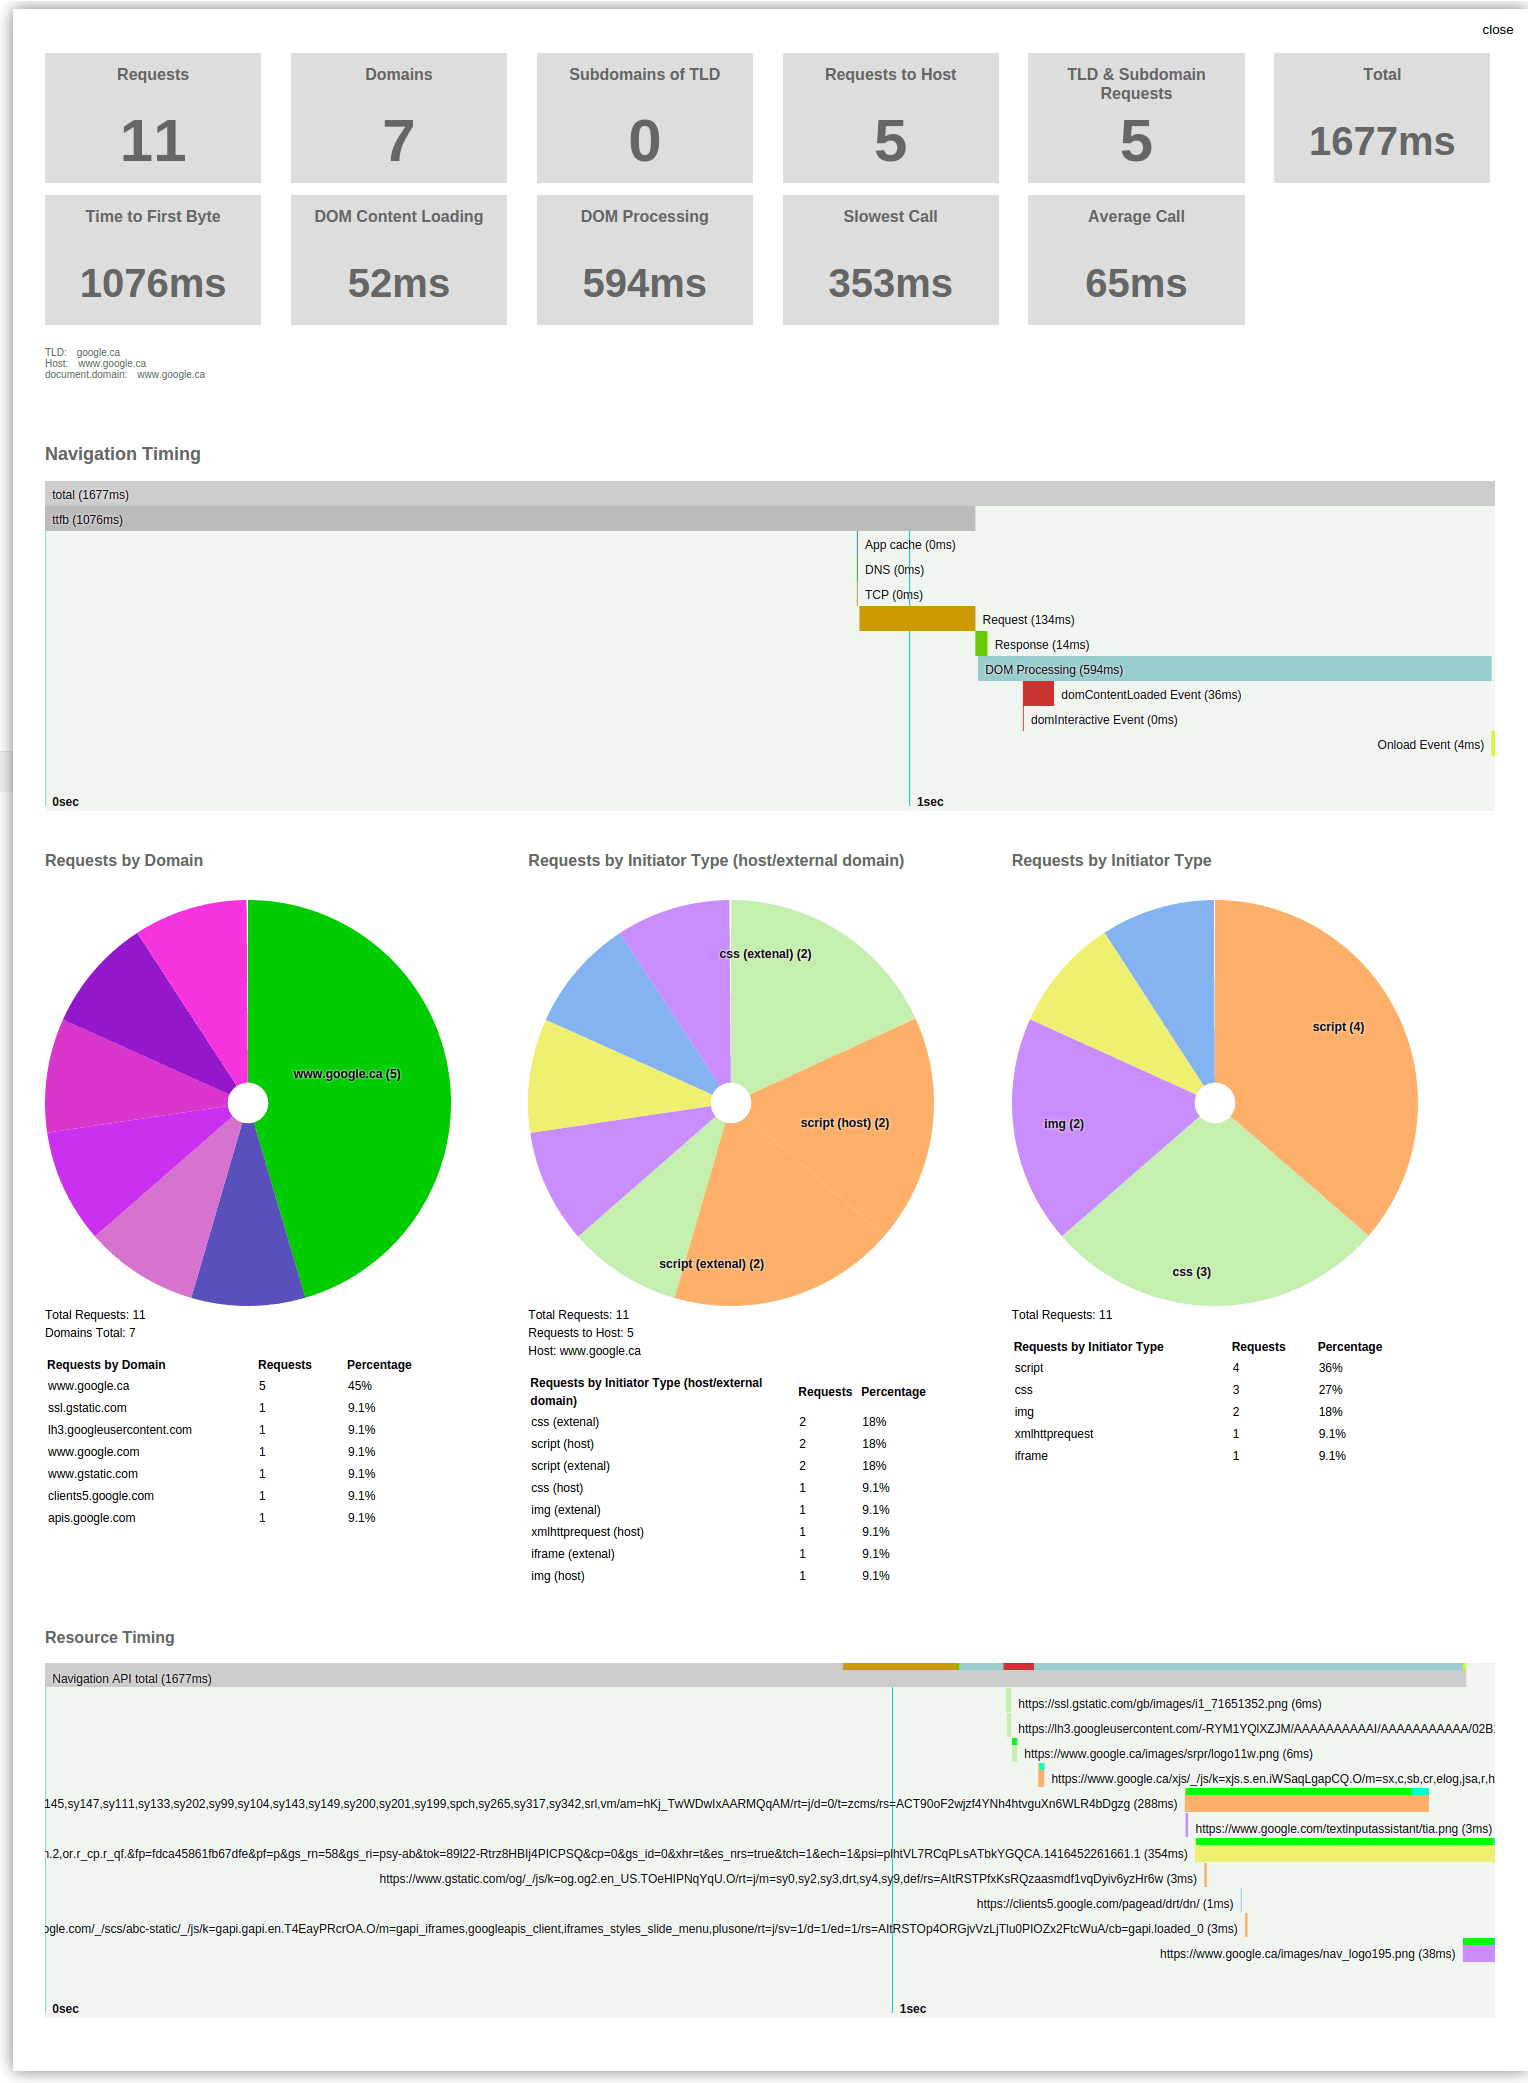
Nurun’s Performance Bookmarklet breaks down your resources and creates a waterfall and some interesting charts: github.com/nurun/performance-bookmarklet

Nurun's Performance Bookmarklet

Boomerang (which I work on) also captures ResourceTiming data and beacons it back to your backend analytics server: github.com/lognormal/boomerang

Commercial Solutions

If you don’t want to build or manage a DIY / Open-Source solution to gather ResourceTiming data, there are many great commercial services available.

Disclaimer: I work at Akamai, on mPulse and Boomerang

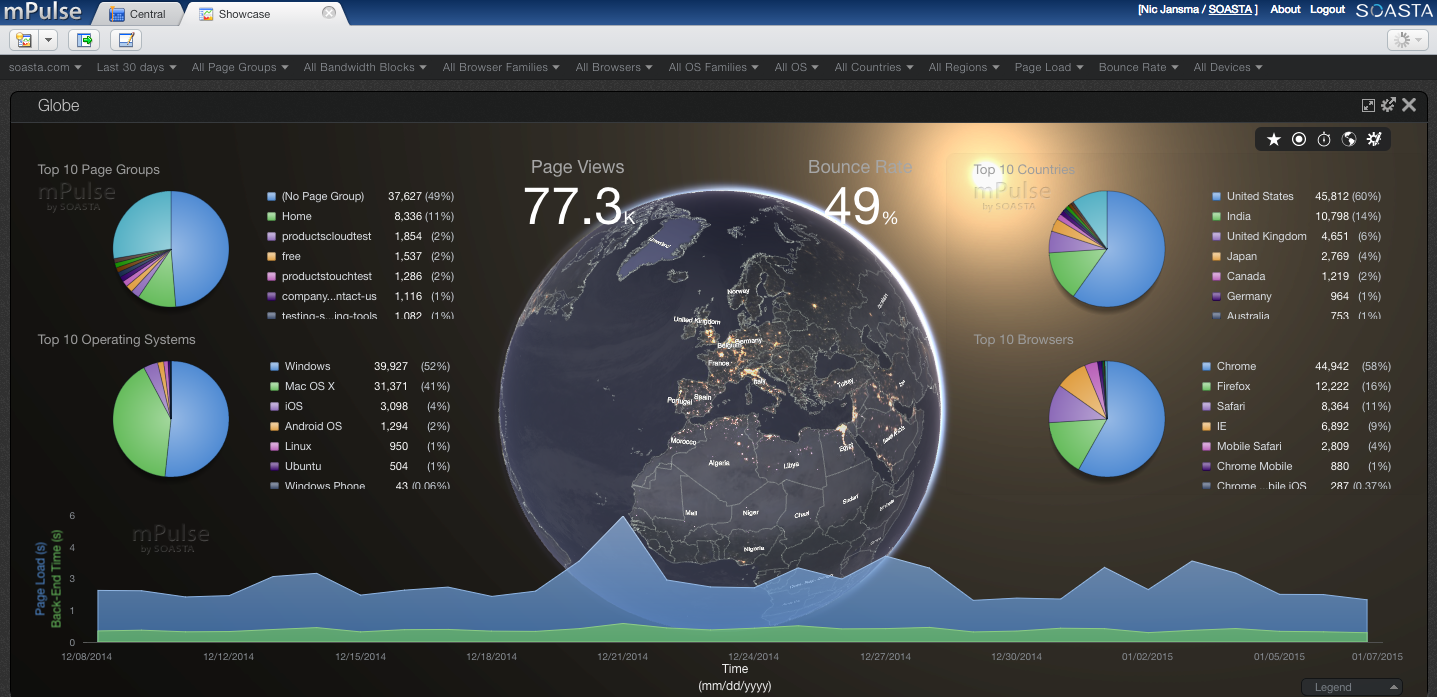
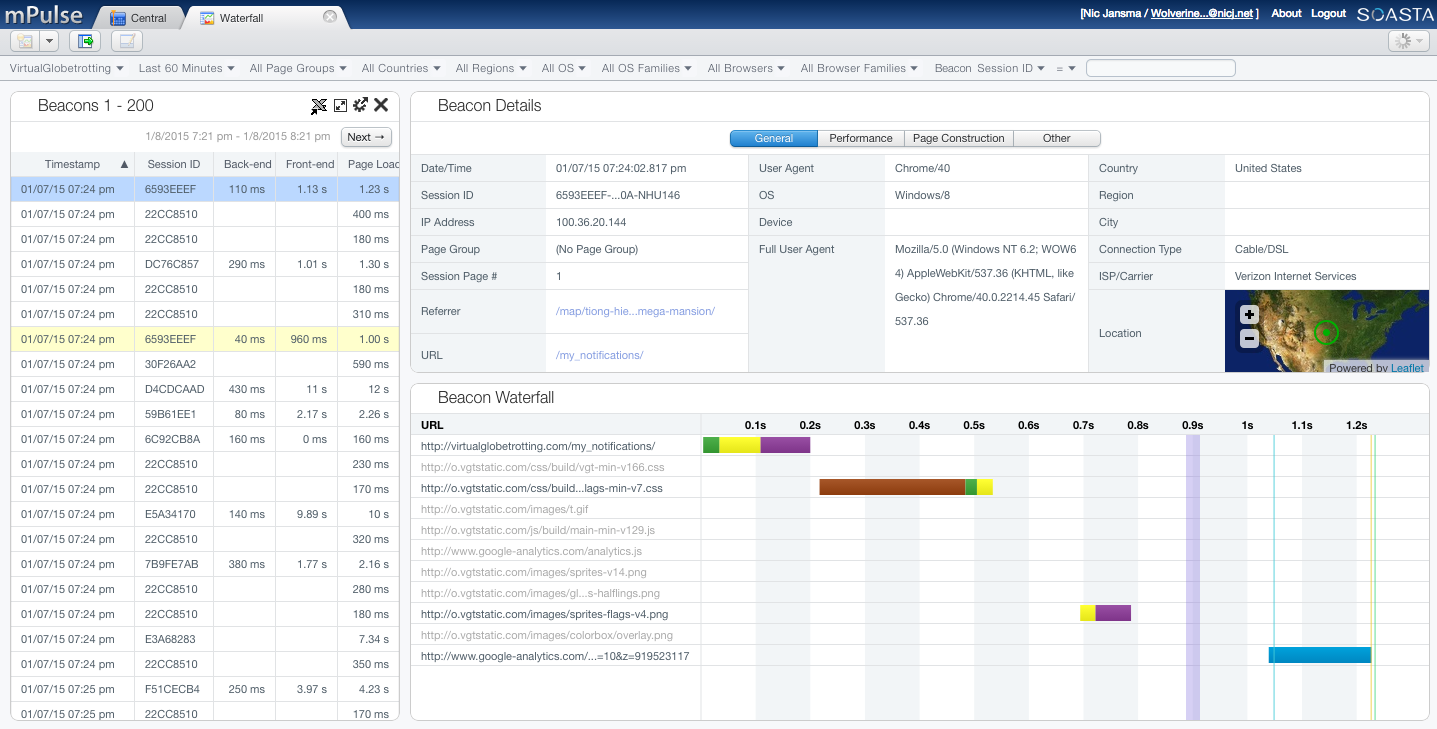
Akamai mPulse captures 100% of your site’s traffic and gives you Waterfalls for each visit:
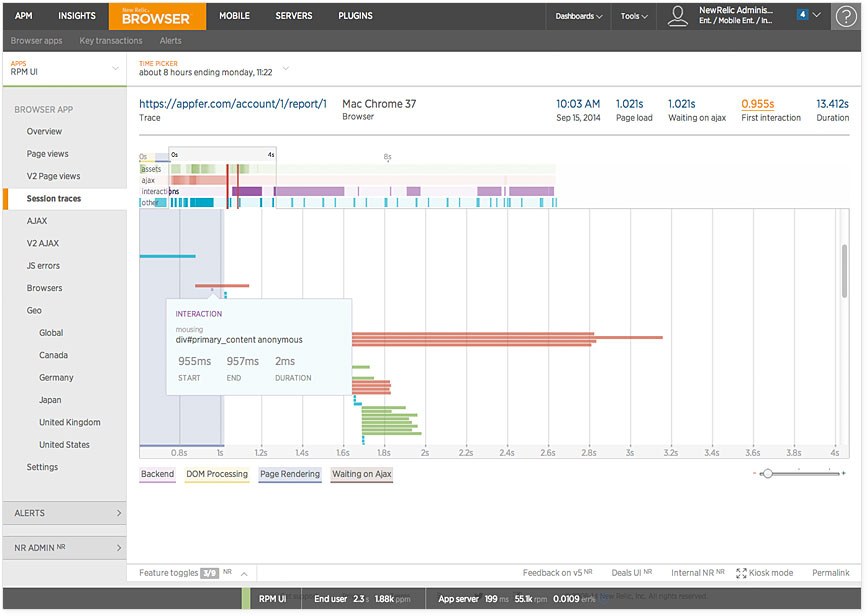
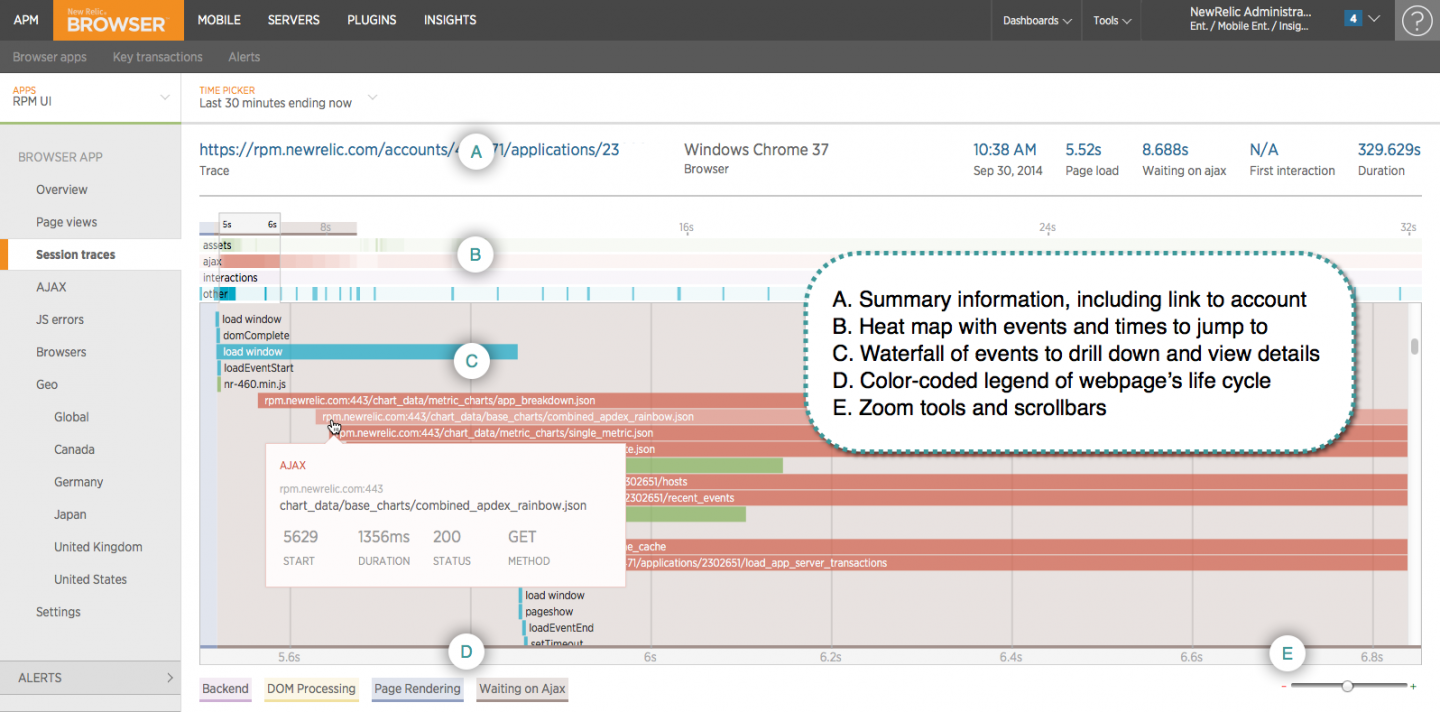
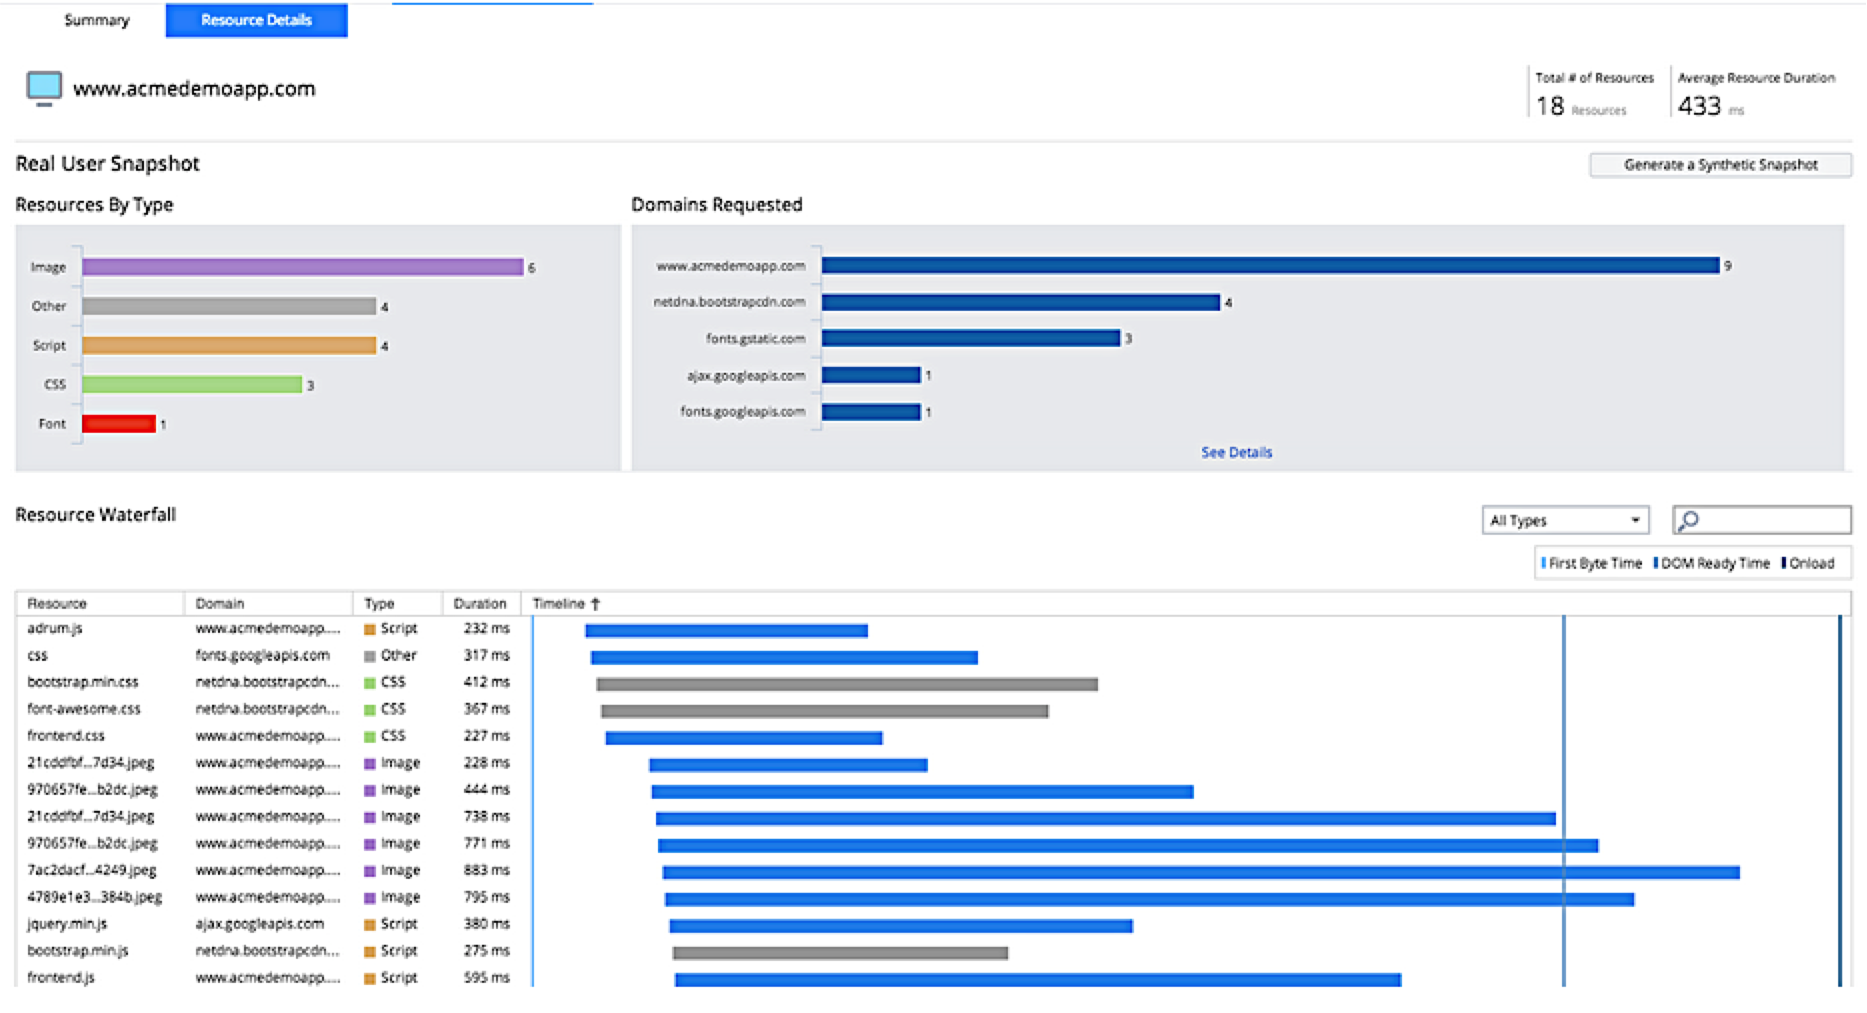
Akamai mPulse Resource Timing

New Relic Browser:

New Relic Browser

App Dynamics Web EUEM:
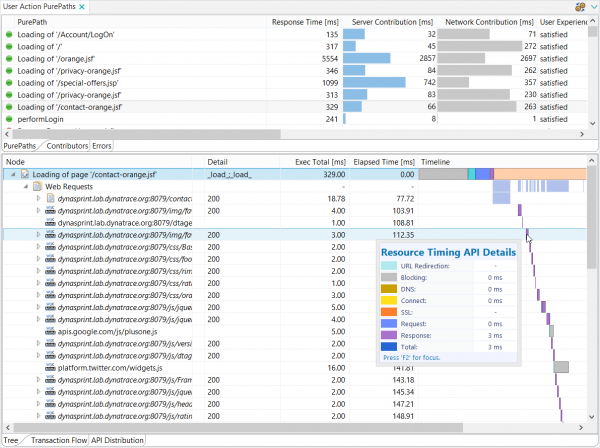
App Dynamics Web EUEM

Dynatrace UEM

Dynatrace UEM

Availability

ResourceTiming is available in most modern browsers. According to caniuse.com, 96.7% of world-wide browser market share supports ResourceTiming (as of May 2021). This includes Internet Explorer 10+, Edge, Firefox 36+, Chrome 25+, Opera 15+, Safari 11 and Android Browser 4.4+.

CanIUse - ResourceTiming - April 2018

There are no polyfills available for ResourceTiming, as the data is just simply not available if the browser doesn’t expose it.

Tips

Here are some additional (and re-iterated) tips for using ResourceTiming data:

  • For many sites, most of your content will not be same-origin, so ensure all of your CDNs and third-party libraries send the Timing-Allow-Origin HTTP response header.
  • Each IFRAME will have its own ResourceTiming data, and those resources won’t be included in the parent FRAME/document. You’ll need to traverse the document frames to get all resources. See github.com/nicjansma/resourcetiming-compression.js.
  • Resources loaded from cross-origin frames will not be visible
  • ResourceTiming data does not ((yet)[https://github.com/w3c/resource-timing/issues/90]) include the HTTP response code for privacy concerns.
  • If you’re going to be managing the ResourceTiming buffer, make sure no other scripts are managing it as well (eg third-party analytics scripts). Otherwise, you may have two listeners for onresourcetimingbufferfull stomping on each other.
  • The duration attribute includes Blocking time (when a resource is blocked behind other resources on the same socket).
  • about:blank and javascript: URLs may be in the ResourceTiming data for some browsers, and you may want to filter them out.
  • Browser extensions may show up in ResourceTiming data, if they initiate downloads. We’ve seen Skype and other extensions show up.

ResourceTiming Browser Bugs

Browsers aren’t perfect, and unfortunately there some outstanding browser bugs around ResourceTiming data. Here are some of the known ones (some of which may have been fixed the time you read this):

Sidebar – it’s great that browser vendors are tracking these issues publicly.

Conclusion

ResourceTiming exposes accurate performance metrics for all of the resources fetched on your page. You can use this data for a variety of scenarios, from investigating the performance of your third-party libraries to taking specific actions when resources aren’t performing according to your performance goals.

Next up: Using UserTiming data to expose custom metrics for your JavaScript apps in a standardized way.

Other articles in this series:

More resources:

Updates

  • 2016-01-03: Updated Firefox’s 404 and DNS behavior via Aaron Peters
  • 2018-04:
    • Updated the PerformanceResourceTiming interface for ResourceTiming (Level 2) and descriptions of ResourceTiming 2 attributes
    • Updated an incorrect statement about initiatorType='iframe'. Previously this document stated that the duration would include the time it took for the <IFRAME> to download static embedded resources. This is not correct. duration only includes the time it takes to download the <IFRAME> HTML bytes (through responseEnd of the HTML, so it does not include the onload duration of the <IFRAME>).
    • Updated list of attributes that are 0 for cross-origin resources (to include size attributes)
    • Added a note with examples on how to crawl frames
    • Added a note on ResourceTiming Visibility and how cross-origin frames affect ResourceTiming
    • Removed some notes about older versions of Chrome
    • Added section on Content Sizes
    • Updated the Cached Resources section to add an algorithm for ResourceTiming2 data
    • Updated initiatorType list as well as added a map of common elements to what initiatorType they would be
    • Added a note about ResourceTiming missing resources fetched by cross-origin stylesheets fetched with no-cors policy
    • Added note about startTime missing when there are redirects with no Timing-Allow-Origin
    • Added a section for 304 Not Modified responses
    • Added a section on PerformanceObserver
    • Updated the ServiceWorker section
    • Added a section on Browser Bugs
    • Updated caniuse.com market share
  • 2018-06:
    • Updated note that IE/Edge have a default buffer size of 500 entries
    • Added note about change to increase recommended buffer size of 150 to 250
  • 2019-01
  • 2021-05
    • Updated Content Sizes and ServiceWorker sections for how the former is affected by the later
    • Updated caniuse.com market share
    • Added some additional known browser bugs

NavigationTiming in Practice

May 27th, 2015

Last updated: May 2021

Table Of Contents

  1. Introduction
  2. How was it done before?
    2.1. What’s Wrong With This?
  3. Interlude: DOMHighResTimestamp
    3.1. Why Not the Date Object?
  4. Accessing NavigationTiming Data
    4.1. NavigationTiming Timeline
    4.2. Example Data
    4.3. How to Use
    4.4. NavigationTiming2
    4.5. Service Workers
  5. Using NavigationTiming Data
    5.1 DIY
    5.2 Open-Source
    5.3 Commercial Solutions
  6. Availability
  7. Tips
  8. Browser Bugs
  9. Conclusion
  10. Updates

Introduction

NavigationTiming is a specification developed by the W3C Web Performance working group, with the goal of exposing accurate performance metrics that describe your visitor’s page load experience (via JavaScript).

NavigationTiming (Level 1) is currently a Recommendation, which means that browser vendors are encouraged to implement it, and it has been shipped in all major browsers.

NavigationTiming (Level 2) is a Working Draft and adds additional features like content sizes and other new data. It is still a work-in-progress, but many browsers already support it.

As of May 2021, 97.9% of the world-wide browser market-share supports NavigationTiming (Level 1).

Let’s take a deep-dive into NavigationTiming!

How it was done before?

NavigationTiming exposes performance metrics to JavaScript that were never available in older browsers, such as your page’s network timings and breakdown. Prior to NavigationTiming, you could not measure your page’s DNS, TCP, request or response times because all of those phases occurred before your application (JavaScript) started up, and the browser did not expose them.

Before NavigationTiming was available, you could still estimate some performance metrics, such as how long it took for your page’s static resources to download. To do this, you can hook into the browser’s onload event, which is fired once all of the static resources on your page (such as JavaScript, CSS, IMGs and IFRAMES) have been downloaded.

Here’s sample (though not very accurate) code:

<html><head><script>
var start = new Date().getTime();

function onLoad {
  var pageLoadTime = (new Date().getTime()) - start;
}

body.addEventListener('load', onLoad, false);
</script></head></html>

What’s wrong with this?

First, it only measures the time from when the JavaScript runs to when the last static resource is downloaded.

If that’s all you’re interested in measuring, that’s fine, but there’s a large part of the user’s experience that you’ll be blind to.

Let’s review the main phases that the browser goes through when fetching your HTML:

  1. DNS resolve: Look up the domain name to find what IP address to connect to
  2. TCP connect: Connect to your server on port 80 (HTTP) or 443 (HTTPS) via TCP
  3. Request: Send a HTTP request, with headers and cookies
  4. Response: Wait for the server to start sending the content (back-end time)

It’s only after Phase 4 (Response) is complete that your HTML is parsed and your JavaScript can run.

Phase 1-4 timings will vary depending on the network. One visitor might fetch your content in 100 ms while it might take another user, on a slower connection, 5,000 ms before they see your content. That delay translates into a painful user-experience.

Thus if you’re only monitoring your application from JavaScript in the <HEAD> to the onload (as in the snippet above), you are blind to a large part of the overall experience.

So the primitive approach above has several downsides:

  • It only measures the time from when the JavaScript runs to when the last static resource is downloaded
  • It misses the initial DNS lookup, TCP connection and HTTP request phases
  • Date().getTime() is not reliable

Interlude – DOMHighResTimeStamp

What about #3? Why is Date.getTime() (or Date.now() or +(new Date)) not reliable?

Let’s talk about another modern browser feature, DOMHighResTimeStamp, aka performance.now().

DOMHighResTimeStamp is a new data type for performance interfaces. In JavaScript, it’s typed as a regular number primitive, but anything that exposes a DOMHighResTimeStamp is following several conventions.

Notably, DOMHighResTimeStamp is a monotonically non-decreasing timestamp with an epoch of performance.timeOrigin and sub-millisecond resolution. It is used by several W3C webperf performance specs, and can always be queried via window.performance.now();

Why not just use the Date object?

DOMHighResTimeStamp helps solve three shortcomings of Date. Let’s break its definition down:

  • monotonically non-decreasing means that every time you fetch a DOMHighResTimeStamp, its’ value will always be at least the same as when you accessed it last. It will never decrease.
  • timestamp with an epoch of performance.timeOrigin means it’s value is a timestamp, whose basis (start) is window.performance.timeOrigin. Thus a DOMHighResTimeStamp of 10 means it’s 10 milliseconds after time time given by performance.timeOrigin
  • sub-millisecond resolution means the value has the resolution of at least a millisecond. In practice, DOMHighResTimeStamps will be a number with the milliseconds as whole-numbers and fractions of a millisecond represented after the decimal. For example, 1.5 means 1500 microseconds, while 100.123 means 100 milliseconds and 123 microseconds.

Each of these points addresses a shortcoming of the Date object. First and foremost, monotonically non-decreasing fixes a subtle issue with the Date object that you may not know exists. The problem is that Date simply exposes the value of your end-user’s clock, according to the operating system. While the majority of the time this is OK, the system clock can be influenced by outside events, even in the middle of when your app is running.

For example, when the user changes their clock, or an atomic clock service adjusts it, or daylight-savings kicks in, the system clock may jump forward, or even go backwards!

So imagine you’re performance-profiling your application by keeping track of the start and end timestamps of some event via the Date object. You track the start time… and then your end-users atomic clock kicks in and adjusts the time forward an hour… and now, from JavaScript Date‘s point of view, it seems like your application just took an hour to do a simple task.

This can even lead to problems when doing statistical analysis of your performance data. Imagine if your monitoring tool is taking the mean value of operational times and one of your users’ clocks jumped forward 10 years. That outlier, while "true" from the point of view of Date, will skew the rest of your data significantly.

DOMHighResTimeStamp addresses this issue by guaranteeing it is monotonically non-decreasing. Every time you access performance.now(), you are guaranteed it will be at least equal to, if not greater than, the last time you accessed it.

You should’t mix Date timestamps (which are Unix epoch based, so you get sample times like 1430700428519) with DOMHighResTimeStamps. If the user’s clock changes, and you mix both Date and DOMHighResTimeStamps, the former could be wildly different from the later.

To help enforce this, DOMHighResTimeStamp is not Unix epoch based. Instead, its epoch is window.performance.timeOrigin (more details of which are below). Since it has sub-millisecond resolution, this means that the values that you get from it are the number of milliseconds since the page load started. As a benefit, this makes them easier to read than Date timestamps, since they’re relatively small and you don’t need to do (now - startTime) math to know when something started running.

DOMHighResTimeStamp is available in most modern browsers, including Internet Explorer 10+, Edge, Firefox 15+, Chrome 20+, Safari 8+ and Android 4.4+. If you want to be able to always get timestamps via window.performance.now(), you can use a polyfill. Note these polyfills will be millisecond-resolution timestamps with a epoch of "something" in unsupported browsers, since monotonically non-decreasing can’t be guaranteed and sub-millisecond isn’t available unless the browser supports it.

As a summary:

DateDOMHighResTimeStamp
Accessed viaDate().getTime()performance.now()
Resolutionmillisecondsub-millisecond
StartUnix epochperformance.timeOrigin
Monotonically Non-decreasingNoYes
Affected by user’s clockYesNo
Example14201475246063392.275999998674

Accessing NavigationTiming Data

So, how do you access NavigationTiming data?

The simplest (and now deprecated) method is that all of the performance metrics from NavigationTiming are available underneath the window.performance DOM object. See the NavigationTiming2 section for a more modern way of accessing this data.

NavigationTiming’s metrics are primarily available underneath window.performance.navigation and window.performance.timing. The former provides performance characteristics (such as the type of navigation, or the number of redirects taken to get to the current page) while the latter exposes performance metrics (timestamps).

Here’s the WebIDL (definition) of the Level 1 interfaces (see the NavigationTiming2 section below for details on accessing the new data)

window.performance.navigation:

interface PerformanceNavigation {
  const unsigned short TYPE_NAVIGATE = 0;
  const unsigned short TYPE_RELOAD = 1;
  const unsigned short TYPE_BACK_FORWARD = 2;
  const unsigned short TYPE_RESERVED = 255;
  readonly attribute unsigned short type;
  readonly attribute unsigned short redirectCount;
};

window.performance.timing:

interface PerformanceTiming {
    readonly attribute unsigned long long navigationStart;
    readonly attribute unsigned long long unloadEventStart;
    readonly attribute unsigned long long unloadEventEnd;
    readonly attribute unsigned long long redirectStart;
    readonly attribute unsigned long long redirectEnd;
    readonly attribute unsigned long long fetchStart;
    readonly attribute unsigned long long domainLookupStart;
    readonly attribute unsigned long long domainLookupEnd;
    readonly attribute unsigned long long connectStart;
    readonly attribute unsigned long long connectEnd;
    readonly attribute unsigned long long secureConnectionStart;
    readonly attribute unsigned long long requestStart;
    readonly attribute unsigned long long responseStart;
    readonly attribute unsigned long long responseEnd;
    readonly attribute unsigned long long domLoading;
    readonly attribute unsigned long long domInteractive;
    readonly attribute unsigned long long domContentLoadedEventStart;
    readonly attribute unsigned long long domContentLoadedEventEnd;
    readonly attribute unsigned long long domComplete;
    readonly attribute unsigned long long loadEventStart;
    readonly attribute unsigned long long loadEventEnd;
};

The NavigationTiming Timeline

Each of the timestamps above corresponds with events in the timeline below:

NavigationTiming timeline

Note that each of the timestamps are Unix epoch-based, instead of being performance.timeOrigin-based like DOMHighResTimeStamps. This has been addressed in NavigationTiming2.

The entire process starts at timing.navigationStart (which should be the same as performance.timeOrigin). This is when your end-user started the navigation. They might have clicked on a link, or hit reload in your browser. The navigation.type property tells you what type of page-load it was: a regular navigation (link- or bookmark- click) (TYPE_NAVIGATE = 0), a reload (TYPE_RELOAD = 1), or a back-forward navigation (TYPE_BACK_FORWARD = 2). Each of these types of navigations will have different performance characteristics.

Around this time, the browser will also start to unload the previous page. If the previous page is the same origin (domain) as the current page, the timestamps of that document’s onunload event (start and end) will be filled in as timing.unloadEventStart and timing.unloadEventEnd. If the previous page was on another origin (or there was no previous page), these timestamps will be 0.

Next, in some cases, your site may go through one or more HTTP redirects before it reaches the final destination. navigation.redirectCount gives you an important insight into how many hops it took for your visitor to reach your page. 301 and 302 redirects each take time, so for performance reasons you should reduce the number of redirects to reach your content to 0 or 1. Unfortunately, due to security concerns, you do not have access to the actual URLs that redirected to this page, and it is entirely possibly that a third-party site (not under your control) initiated the redirect. The difference between timing.redirectStart and timing.redirectEnd encompasses all of the redirects. If these values are 0, it means that either there were no redirects, or at least one of the redirects was from a different origin.

fetchStart is the next timestamp, and indicates the timestamp for the start of the fetch of the current page. If there were no redirects when loading the current page, this value should equal navigationStart. Otherwise, it should equal redirectEnd.

Next, the browser goes through the networking phases required to fetch HTML over HTTP. First the domain is resolved (domainLookupStart and domainLookupEnd), then a TCP connection is initiated (connectStart and connectEnd). Once connected, a HTTP request (with headers and cookies) is sent (requestStart). Once data starts coming back from the server, responseStart is filled, and is ended when the last byte from the server is read at responseEnd.

Note that the only phase without an end timestamp is requestEnd, as the browser does not have insight into when the server received the response.

Any of the above phases (DNS, TCP, request or response) might not take any time, such as when DNS was already resolved, a TCP connection is re-used or when content is served from disk. In this case, the timestamps should not be 0, but should reflect the timestamp that the phase started and ended, even if the duration is 0. For example, if fetchStart is at 1000 and a TCP connection is reused, domainLookupStart, domainLookupEnd, connectStart and connectEnd should all be 1000 as well.

secureConnectionStart is an optional timestamp that is only filled in if it the page was loaded over a secure connection. In that case, it represents the time that the SSL/TLS handshake started.

After responseStart, there are several timestamps that represent phases of the DOM’s lifecycle. These are domLoading, domInteractive, domContentLoadedEventStart, domContentLoadedEventEnd and domComplete.

domLoading, domInteractive and domComplete correspond to when the Document’s readyState are set to the corresponding loading, interactive and complete states.

domContentLoadedEventStart and domContentLoadedEventEnd correspond to when the DOMContentLoaded event fires on the document and when it has completed running.

Finally, once the body’s onload event fires, loadEventStart is filled in. Once all of the onload handlers are complete, loadEventEnd is filled in. Note this means if you’re querying window.performance.timing from within the onload event, loadEventEnd will be 0. You could work around this by querying the timestamps from a setTimeout(..., 10) fired from within the onload event, as in the code example below.

Note: There is a bug in some browsers where they are reporting 0 for some timestamps. This is a bug, as all same-origin timestamps should be filled in, but if you’re consuming this data, you may have to adjust for this.

Browser vendors are also free to ad their own additional timestamps to window.performance.timing. Here is the only currently known vendor-prefixed timestamp available:

  • msFirstPaint – Internet Explorer 9+ only, this event corresponds to when the first paint occurred within the document. It makes no guarantee about what content was painted — in fact, the paint could be just the "white out" prior to other content being displayed. Do not rely on this event to determine when the user started seeing actual content.

Example data

Here’s sample data from a page load:

// window.performance.navigation
redirectCount: 0
type: 0

// window.performance.timing
navigationStart: 1432762408327,
unloadEventEnd: 0,
unloadEventStart: 0,
redirectStart: 0,
redirectEnd: 0,
fetchStart: 1432762408648,
connectEnd: 1432762408886,
secureConnectionStart: 1432762408777,
connectStart: 1432762408688,
domainLookupStart: 1432762408660,
domainLookupEnd: 1432762408688,
requestStart: 1432762408886,
responseStart: 1432762409141,
responseEnd: 1432762409229,
domComplete: 1432762411136,
domLoading: 1432762409147,
domInteractive: 1432762410129,
domContentLoadedEventStart: 1432762410164,
domContentLoadedEventEnd: 1432762410263,
loadEventEnd: 1432762411140,
loadEventStart: 1432762411136

How to Use

All of the metrics exposed on the window.performance interface are available to your application via JavaScript. Here’s example code for gathering durations of the different phases of the main page load experience:

function onLoad() {
  if ('performance' in window && 'timing' in window.performance) {
    // gather after all other onload handlers have fired
    setTimeout(function() {
      var t = window.performance.timing;
      var ntData = {
        redirect: t.redirectEnd - t.redirectStart,
        dns: t.domainLookupEnd - t.domainLookupStart,
        connect: t.connectEnd - t.connectStart,
        ssl: t.secureConnectionStart ? (t.connectEnd - secureConnectionStart) : 0,
        request: t.responseStart - t.requestStart,
        response: t.responseEnd - t.responseStart,
        dom: t.loadEventStart - t.responseEnd,
        total: t.loadEventEnd - t.navigationStart
      };
    }, 0);
  }
}

NavigationTiming2

Currently a Working Draft, NavigationTiming (Level 2) builds on top of NavigationTiming:

  • Now based on Resource Timing Level 2
  • Support for the Performance Timeline and via a PerformanceObserver
  • Support for High Resolution Time
  • Adds the next hop protocol
  • Adds transfer and content sizes
  • Adds ServerTiming
  • Add ServiceWorker information

The Level 1 interface, window.performance.timing, will not been changed for Level 2. Level 2 features are not being added to that interface, primarily because the timestamps under window.performance.timing are not DOMHighResTimeStamp timestamps (such as 100.123), but Unix-epoch timestamps (e.g. 1420147524606).

Instead, there’s a new navigation type available from the PerformanceTimeline that contains all of the Level 2 data.

Here’s an example of how to get the new NavigationTiming data:

if ('performance' in window &&
    window.performance &&
    typeof window.performance.getEntriesByType === 'function') {
    var ntData = window.performance.getEntriesByType("navigation")[0];
}

Example data:

 {
    "name": "https://website.com/",
    "entryType": "navigation",
    "startTime": 0,
    "duration": 1568.5999999986961,
    "initiatorType": "navigation",
    "nextHopProtocol": "h2",
    "workerStart": 0,
    "redirectStart": 0,
    "redirectEnd": 0,
    "fetchStart": 3.600000054575503,
    "domainLookupStart": 3.600000054575503,
    "domainLookupEnd": 3.600000054575503,
    "connectStart": 3.600000054575503,
    "connectEnd": 3.600000054575503,
    "secureConnectionStart": 0,
    "requestStart": 9.700000053271651,
    "responseStart": 188.50000004749745,
    "responseEnd": 194.2999999737367,
    "transferSize": 7534,
    "encodedBodySize": 7287,
    "decodedBodySize": 32989,
    "serverTiming": [],
    "unloadEventStart": 194.90000000223517,
    "unloadEventEnd": 195.10000001173466,
    "domInteractive": 423.9999999990687,
    "domContentLoadedEventStart": 423.9999999990687,
    "domContentLoadedEventEnd": 520.9000000031665,
    "domComplete": 1562.900000018999,
    "loadEventStart": 1562.900000018999,
    "loadEventEnd": 1568.5999999986961,
    "type": "navigate",
    "redirectCount": 0
}

As you can see, all of the fields from NavigationTiming Level 1 are there (except domLoading which was removed), but they’re all DOMHighResTimeStamp timestamps now.

In addition, there are new Level 2 fields:

  • nextHopProtocol: ALPN Protocol ID such as http/0.9 http/1.0 http/1.1 h2 hq spdy/3 (ResourceTiming Level 2)
  • workerStart is the time immediately before the active Service Worker received the fetch event, if a ServiceWorker is installed
  • transferSize: Bytes transferred for the HTTP response header and content body
  • decodedBodySize: Size of the body after removing any applied content-codings
  • encodedBodySize: Size of the body after prior to removing any applied content-codings
  • serverTiming: ServerTiming data

Service Workers

While NavigationTiming2 added a timestamp for workerStart, if you have a Service Worker active for your domain, there are some caveats to be aware of:

Using NavigationTiming Data

With access to all of this performance data, you are free to do with it whatever you want. You could analyze it on the client, notifying you when there are problems. You could send 100% of the data to your back-end analytics server for later analysis. Or, you could hook the data into a DIY or commercial RUM solution that does this for you automatically.

Let’s explore all of these options:

DIY

There are many DIY / Open Source solutions out there that gather and analyze data exposed by NavigationTiming.

Here are some DIY ideas for what you can do with NavigationTiming:

  • Gather the performance.timing metrics on your own and alert you if they are over a certain threshold (warning: this could be noisy)
  • Gather the performance.timing metrics on your own and XHR every page-load’s metrics to your backend for analysis
  • Watch for any pages that resulted in one or more redirects via performance.navigation.redirectCount
  • Determine what percent of users go back-and-forth on your site via performance.navigation.type
  • Accurately monitor your app’s bootstrap time that runs in the body’s onload event via (loadEventEnd - loadEventStart)
  • Monitor the performance of your DNS servers
  • Measure DOM event timestamps without adding event listeners

Open-Source

There are some great projects out there that consume NavigationTiming information.

Boomerang, an open-source library developed by Philip Tellis, had a method for tracking performance metrics before NavigationTiming was supported in modern browsers. Today, it incorporates NavigationTiming data if available. It does all of the hard work of gathering various performance metrics, and lets you beacon (send) the data to a server of your choosing. (I am a contributor to the project).

To compliment Boomerang, there are a couple open-source servers that receive Boomerang data, such as Boomcatch and BoomerangExpress. In both cases, you’ll still be left to analyze the data on your own:

BoomerangExpress

To view NavigationTiming data for any site you visit, you can use this kaaes bookmarklet:

kaaes bookmarklet

SiteSpeed.io helps you track your site’s performance metrics and scores (such as PageSpeed and YSlow):

SiteSpeed.io

Finally, if you’re already using Piwik, there’s a plugin that gathers NavigationTiming data from your visitors:

"generation time" = responseEnd - requestStart

Piwik

Commercial Solutions

If you don’t want to build or manage a DIY / Open-Source solution to gather RUM metrics, there are many great commercial services available.

Disclaimer: I work at Akamai, on mPulse and Boomerang

Akamai mPulse, which gathers 100% of your visitor’s performance data:

Akamai mPulse

Google Analytics Site Speed:

Google Analytics Site Speed

New Relic Browser:

New Relic Browser

NeuStar WPM:

NeuStar WPM

SpeedCurve:

SpeedCurve

There may be others as well — please leave a comment if you have experience using another service.

Availability

NavigationTiming is available in all modern browsers. According to caniuse.com 97.9% of world-wide browser market share supports NavigationTiming, as of May 2021. This includes Internet Explore 9+, Edge, Firefox 7+, Chrome 6+, Opera 15+, Android Browser 4+, Mac Safari 8+ and iOS Safari 9+.

CanIUse NavigationTiming

Tips

Some final tips to re-iterate if you want to use NavigationTiming data:

  • Use fetchStart instead of navigationStart, unless you’re interested in redirects, browser tab initialization time, etc.
  • loadEventEnd will be 0 until after the body’s onload event has finished (so you can’t measure it in the load event itself).
  • We don’t have an accurate way to measure the "request time", as requestEnd is invisible to us (the server sees it).
  • secureConnectionStart isn’t available in Internet Explorer, and will be 0 in other browsers unless on a HTTPS link.
  • If your site is the home-page for a user, you may see some 0 timestamps. Timestamps up through the responseEnd event may be 0 duration because some browsers speculatively pre-fetch home pages (and don’t report the correct timings).
  • If you’re going to be beaconing data to your back-end for analysis, if possible, send the data immediately after the body’s onload event versus waiting for onbeforeunload. onbeforeunload isn’t 100% reliable, and may not fire in some browsers (such as iOS Safari).
  • Single-Page Apps: You’ll need a different solution for "soft" or "in-page" navigations (Boomerang has SPA support).

Browser Bugs

NavigationTiming data may not be perfect, and in some cases, incorrect due to browser bugs. Make sure to validate your data before you use it.

We’ve seen the following problems in the wild:

  • Safari 8/9: requestStart and responseStart might be less than navigationStart and fetchStart
  • Safari 8/9 and Chrome (as recent as 56): requestStart and responseStart might be less than fetchStart, connect* and domainLookup*
  • Chrome (as recent as 56): requestStart is equal to navigationStart but less than fetchStart, connect* and domainLookup*
  • Firefox: Reporting 0 for timestamps that should always be filled in, such as domainLookup*, connect* and requestStart.
  • Chrome: Some timestamps are double what they should be (e.g. if "now" is 1524102861420, we see timestamps around 3048205722840, year 2066)
  • Chrome: When the page has redirects, the responseStart is less than redirectEnd and fetchStart
  • Firefox: The NavigationTiming of the iframe (window.frames[0].performance.timing) does not include redirect counts or redirect times, and many other timestamps are 0

If you’re analyzing NavigationTiming data, you should ensure that all timestamps increment according to the timeline. If not, you should probably question all of the timestamps and discard.

Some known bug reports:

Conclusion

NavigationTiming exposes valuable and accurate performance metrics in modern browsers. If you’re interested in measuring and monitoring the performance of your web app, NavigationTiming data is the first place you should look.

Next up: Interested in capturing the same network timings for all of the sub-resources on your page, such as images, JavaScript, and CSS? ResourceTiming is what you want.

Other articles in this series:

More resources:

Updates

  • 2018-04:
    • Updated caniuse.com market share
    • Updated NavigationTiming2 information, usage, fields
    • Added more browser bugs that we’ve found
  • 2021-05:
    • Updated caniuse.com market share
    • Added a Service Workers section
    • Replaced usage of performance.timing.navigationStart as a time origin with performance.timeOrigin
    • Minor grammar updates
    • Added a Table of Contents

Measuring the Performance of Your Web Apps

May 25th, 2015

You know that performance matters, right?

Just a few seconds slower and your site could be turning away thousands (or millions) of visitors. Don’t take my word for it: there are plenty of case studies, articles, findings, presentations, charts and more showing just how important it is to make your site load quickly. Google is even starting to shame-label slow sites. You don’t want to be that guy.

So how do you monitor and measure the performance of your web apps?

The performance of any system can be measured from several different points of view. Let’s take a brief look at three of the most common performance viewpoints for a web app: from the eyes of the developer, the server and the end-user.

This is the beginning of a series of articles that will expand upon the content given during my talk "Make it Fast: Using Modern Brower APIs to Monitor and Improve the Performance of your Web Applications" at CodeMash 2015.

Developer

The developer’s machine is the first line of defense in ensuring your web application is performing as intended. While developing your app, you are probably building, testing and addressing performance issues as you see them.

In addition to simply using your app, there are many tools you can use to measure how it’s performing. Some of my favorites are:

While ensuring everything is performing well on your development machine (which probably has tons of RAM, CPU and a quick connection to your servers) is a good first step, you also need to make sure your app is playing well with other services on your network, such as your web server, database, etc.

Server

Monitoring the server(s) that run your infrastructure (such as web, database, and other back-end services) is critical for a performance monitoring strategy. Many resources and tools have been developed to help engineers monitor what their servers are doing. Performance monitoring at the server level is critical for reliability (ensuring your core services are running) and scalability (ensuring your infrastructure is performing at the level you want).

From each of your servers’ points of view, there are several components that you can monitor to have visibility into how your infrastructure is performing. Some common monitoring and measuring tools are:

By putting these tools together, you can get a pretty good sense of how your overall infrastructure is performing.

End-user

So you’ve developed your app, deployed it to production, and have been monitoring your infrastructure closely to ensure all of your servers are performing smoothly.

Everything should be golden, right? Your end-users are having a fantastical experience and every one of them just loves visiting your site.

… clearly, that’s probably not the case. The majority of your end-users don’t surf the web on $3,000 development machines, using the latest cutting-edge browser on a low-latency link from your datacenter. A lot of your users are probably on a low-end tablet, on a cell network, 2,000 miles away from your datacenter.

The experience you’ve curated while developing your web app on your high-end development machine will probably be the best experience possible. All of your visitors will likely experience something worse, from not-a-noticeable-difference down to can’t-stand-how-slow-it-is-and-will-never-come-back.

Measuring performance from the server and the developer’s perspective is not the full story. In the end, the only thing that really matters is what your visitor sees, and the experience they have.

Just a few years ago, the web development community didn’t have a lot of tools available to monitor the performance from their end-users’ perspectives. Sure, you could capture simple JavaScript timestamps within your code:

var startTime = Date.now();
// do stuff
var elaspedTime = Date.now() - startTime;

You could spread this code throughout your app and listen for browser events such as onload, but simple timestamps don’t give a lot of visibility into the performance of your end-users.

In addition, since this style of timestamp/profiling is just JavaScript, you have zero visibility into the browser’s networking performance and what happened before the browser parsed your HTML and JavaScript.

W3C Webperf Working Group

To solve these issues, in 2010 the W3C (a standards body in charge of developing web standards such as HTML5, CSS, etc.) formed a new working group with the mission of giving developers the ability to assess and understand the performance characteristics of their web apps.

The W3C webperf working group is an organization whose members include Microsoft, Google, Mozilla, Opera, Facebook, Netflix, SOASTA and more. The working group collaboratively develops standards with the following goals:

  • Expose information that was not previously available
  • Give developers the tools they need to make their applications more efficient

  • Little to no overhead
  • Easy to understand APIs

Since it’s inception, the working group has published a number of standards, many of which are available in modern browsers today. Some of these standards are: